Soumya Bhowmick and Vipin Yadav, “Human Capital Formation through Public Education: How Fares India?”,ORF Occasional Paper No. 212, September 2019, Observer Research Foundation.
Public education is a tool for human capital formation. In India, even as private institutions provide an option, a majority of students attend public schooling; yet, private-school students continue to outperform their public-school counterparts. Using parameters associated with Goal 4 of the Sustainable Development Goals (SDG 4 – Quality Education), this paper estimates the sub-national level state of public education in India by constructing index scores. It also makes a critical assessment of the national education policy space in India in the past two decades. The paper finds that Delhi is the top performing state in public education across the country, and describes the various policy initiatives and reforms introduced over the years by the state government to improve the quality of public education. The paper highlights the role of governance in nurturing public education, and makes a case for the best institutional practices that can be adopted to transform public education in India.
Introduction
Harnessing India’s demographic dividend is crucially dependent on the education ecosystem of the country. After all, nearly one-fourth of India’s population, which accounts for the school- and college-going youth,[1]forms the human capital base of the country. This population belong in the age group of six – 23 years old.[2]As the requirements for expertise change and dependence on innovation increases, India should pay attention to providing its youth quality education that will nurture their skill sets. Although private education is mostly preferred in the urban regions, public education remains the more affordable option for the great majority of the Indian masses. Out of the total 1.522 million schools in India, about 80 percent are either Government or Government-aided institutions.[3]In 2017, 65 percent of the total school-going children in India (about 113 million) were serviced by the public education systems.[4]
The Draft National Education Policy 2019[5]recognises the importance of public education, proposing the allocation of 20 percent of total public expenditure to education over a period of 10 years. Even the government think tank, NITI Aayog suggests that the spending on education should be increased from the current three percent of GDP to at least six percent of GDP by 2022.[6](This is higher than the world average expenditure on education which stood at 4.815 percent of GDP in 2015, and also higher than the average expenditure on education by OECD member countries at 5.239 percent of GDP in 2015.[7])
This paper estimates the sub-national level state of public education in India by constructing index scores. The study covers only the public institutions, with the aim of analysing their institutional governance. Such an analysis is possible only for the Government institutions because credible data on their private counterparts is not available in the public domain. The paper uses the case of Delhi to argue for the adoption of best institutional practices to improve public education in India.
The paper is structured as follows: Section 1 focuses on the importance of public education in enhancing the human capital base of the country in a sustainable manner. It discusses the education policy space in India in the past two decades, and by identifying indicators associated with SDG 4 – Quality Education, it estimates the sub-national level scores and ranks the Indian states accordingly. Section 2 discusses the governance of the education landscape in Delhi, which the analysis in Section 1 finds as the top performer. It scrutinises the systems in Delhi’s public schools, which are governed in the pre-primary, primary, secondary, and senior secondary levels by the State Government of the NCT of Delhi; as well as the local Municipal Corporations of Delhi and the Kendriya-Vidyalayas (central schools), under the aegis of the Ministry of Human Resource Development. Building on the analysis in Section 1 and the comparison of the three institutional systems of education in Delhi in Section 2, the paper concludes by highlighting the systems and practices that can enhance the public education systems in the country.
1. The quest for quality public education in India
1.1. Education, skills and human capital
There is no dearth in literature championing education as the basis of human capital. For example, T. Schultz’s seminal paper (1950)[8]highlighted the role of education in facilitating human capital.[9]Kiker (1966)[10]later identified this in the work of other prominent economists such as A. Marshall (1920)[11]who had emphasised the significance of skills and knowledge as an important tool for economic development. Becker (1964)[12]and Mincer (1984),[13]for their part, showed how the concept of investment in human capital could influence future real incomes through inculcating knowledge resources such as quality education in individuals.
Education is a key element of human capital theory because it is viewed as the primary means of developing knowledge and thus is a way of quantifying the quality of labour. Mincer (1974)[14]is credited with developing the core model designed to explain differences in individual income as a function of the level of education and work experience. More recent studies by Mankiw, Romer &Weil (1992)[15]and Lucas (1988)[16]stress on the essential role of education as the main factor in increasing human capital and encouraging economic growth, by helping individuals acquire knowledge, opening doors to job opportunities, developing social interactions, being aware of their rights, improving health and reducing poverty.
In India, there is huge variance in the quality of education across institutions, regions and regimes. Standardised achievement tests carried out by Bashir (1994);[17]Govinda and Varghese (1993);[18]Kingdon (1994[19], 1996[20]); and Tooley and Dixon (2003)[21]have all found that private school students outperform their public school counterparts even after controlling for the schools’ student intakes. (These studies were conducted in different parts of India—i.e., Tamil Nadu, Madhya Pradesh, Uttar Pradesh and Andhra Pradesh.)
It is clear that the public education system in India needs a transformation. Indeed, even as private schooling will remain an option, the majority of students of India continue to rely on public education. Sen (2013)[22]notes the significance of public schools in the context of India’s state of economy as they are more affordable to the masses. Private educational institutions in rural areas are often characterised by their monopoly in terms of admission processes and fees, which makes the importance of public education all the more prominent.[23]Nussbaum (2006)[24]also argues that public educational facilities must focus on developing the critical and imaginative capabilities of students which is crucial for the health of a democracy, especially the poorer ones such as India. According to the Sustainable Development Solutions Network (SDSN), India accounts for around 21 percent of the world’s achievement gap for quality education.[25]With the mean years of schooling at 6.3 years and an 83-percent literacy rate for those 15-24 years old, India’s performance is worse than the developing countries of Southeast Asia like Indonesia, Malaysia, Thailand, and Vietnam.[26]
1.2. Sustainable Development Goal 4: Quality education
The United Nations’ (UN) Sustainable Development Goals (SDGs) recognise the role of a quality and accessible public education in developing human capital (SDG Goal 4). All the SDGs characterise features of human, social, natural and physical capital that need to be mainstreamed in national development frameworks[27]and whose achievement is associated with the ease of doing business and the investment promotion strategy of India.[28]In its targets, SDG Goal 4 embeds education and human capital facilities as essential inputs to a country’s economy. The goal emphasises the importance of access to good quality education as the most powerful vehicle for ensuring sustainable development. This goal encompasses the following targets:[29]
Table 1: SDG 4 Targets
(Source: United Nations General Assembly Report, 2015)
Sub-Goals
Objectives
4.1
By 2030, ensure that all girls and boys complete free, equitable and quality primary and secondary education leading to relevant and Goal 4 effective learning outcomes.
4.2
By 2030, ensure that all girls and boys have access to quality early childhood development, care and preprimary education so that they are ready for primary education.
4.3
By 2030, ensure equal access for all women and men to affordable and quality technical, vocational and tertiary education, including university.
4.4
By 2030, substantially increase the number of youth and adults who have relevant skills, including technical and vocational skills, for employment, decent jobs and entrepreneurship.
4.5
By 2030, eliminate gender disparities in education and ensure equal access to all levels of education and vocational training for the vulnerable, including persons with disabilities, indigenous peoples and children in vulnerable situations.
4.6
By 2030, ensure that all youth and a substantial proportion of adults, both men and women, achieve literacy and numeracy.
4.7
By 2030, ensure that all learners acquire the knowledge and skills needed to promote sustainable development, including, among others, through education for sustainable development and sustainable lifestyles, human rights, gender equality, promotion of a culture of peace and non-violence, global citizenship and appreciation of cultural diversity and of culture’s contribution to sustainable development.
4.a
Build and upgrade education facilities that are child, disability and gender sensitive and provide safe, nonviolent, inclusive and effective learning environments for all.
4.b
By 2020, substantially expand globally the number of scholarships available to developing countries, in particular least developed countries, small island developing States and African countries, for enrolment in higher education, including vocational training and information and communications technology, technical, engineering and scientific programmes, in developed countries and other developing countries.
4.c
By 2030, substantially increase the supply of qualified teachers, including through international cooperation for teacher training in developing countries, especially least developed countries and small island developing states.
1.3. Indian Education Policy Space
The Constitution of India directs through Article 45[i]that “the State shall endeavor to provide, within a period of ten years from the commencement of this Constitution, for free and compulsory education for all children until they complete the age of fourteen years.”[30]Marking progress towards this goal, the Right of Children to Free and Compulsory Education Act of 2009 (RTE) made fulltime and free elementary education of satisfactory and equitable quality, a fundamental right of each child.[31]The implementation of the RTE Act has resulted in considerable improvement in the country’s primary school enrolment rate and primary school completion rate, for both girls and boys. The UN also points to policy initiatives like the Sarva Shiksha Abhiyan (SSA) for pushing India towards universalisation of primary education.[32]SSA opens new schools in areas which do not have them and improves the infrastructure of the existing ones.[33]As a result of SSA, the Gross Enrolment Ratio[ii](GER) of students in primary schools in India reached 99.21 percent, and for the upper primary levels, 92.81 percent. In 2015-16, more than a million government schools were operational in India. Between 2002-03 to 2015-16, a total of 162,237 new primary schools and 78,903 new upper primary schools were opened across the country.[34]
The RTE Act also included provisions to ensure that the quality of education in the schools is satisfactory:[35]
Admitting non-admitted children to age-appropriate classrooms
Norms and standards relating to building infrastructure, Pupil to Teacher Ratio (PTR), school-working days, teacher-working hours
Prohibition of deployment of teachers for non-educational work
Measures to avoid rural and urban imbalance in public education, which include ensuring rational deployment of teachers to make sure that PTR requirements are met
Appointment of appropriately trained and qualified teachers
No detention policy: Students from Grade I to Grade VIII, cannot be detained in the same class for another year
No child shall be required to pass any board examination until the completion of elementary education
Continuous and Comprehensive Evaluation: Teachers should assess the learning ability of each child and accordingly supplement additional instructions
1.4. State of Public Education in India
Programmes like SSA succeeded in providing access to public schooling to millions of children, and the RTE Act pushed up the enrolment numbers. Over the years, India has also made considerable resource allocation towards improving the quality public education, an initiative consistent with SGD 4 targets. However, India continues to have a financial gap of around US$740 billion of investment for SDG 4.[36]At 2.6 percent of GDP, India’s education expenditure is much lower than the world’s average[37]at 4.815 percent of GDP in 2015.[38]
In 2009, the Indian states of Tamil Nadu and Himachal Pradesh partnered with the Organisation for Economic Cooperation and Development (OECD) to participate in the Programme for International Student Assessment (PISA).[39]PISA tests 15-year-old students of public schools from around the world in reading, mathematics, and science.[40]Based on the performance of the students, the two Indian states were ranked, respectively, 2ndand 3rdfrom last in reading and mathematics (72 and 73 out of 74 participating regions). In science, Himachal Pradesh was ranked last and Tamil Nadu was 3rdfrom last. The Indian private schools which participated in the PISA study fared marginally better than the public schools.[41]
The Annual Status of Education (ASER) annual reports by the NGO Pratham,[iii]have repeatedly pointed out that a large proportion of students studying in public schools in India are not learning even the basic skills of language comprehension and numeracy. ASER 2005 was the first time that children’s mastery of the basic skills of reading and arithmetic was measured in India, on a large scale and using indicators that even parents with low literacy skills could easily understand. Since 2005, ASER results have been cited in the Annual Economic Surveys of the Government of India; ASER has partnered with various state governments to carry out a range of assessments. The widespread reporting and the dissemination of the ASER results in 2005 and every year after that, has worked as a catalyst to drive governments’ focus towards learning outcomes in the public schools.[42]The latest ASER survey was conducted in 2018 in 596 (rural) districts of India, 17,730 villages and had a large sample size of 546,527 children (age 3-16). It found that nationally, around 50 percent of the grade-V students from public schools cannot read a grade II text or perform a simple arithmetic problem.[43]
1.5. SDG 4 in India: Sub-National Performance
One of the biggest challenges in achieving the SDG 4 is translating these global aspirations into local actions. Regular sub-national evaluation is necessary to ensure the effective implementation of SDG 4. To carry out this exercise, cross-sectional data on eight parameters are chosen (see Appendix 1-8) using inputs from the Central Statistics Office at the Ministry of Statistics and Programme Implementation.[44]This list of parameters mentioned in Table 2, as also identified by Ghosh et al. (2019)[45], may not be exhaustive but is indicative of the educational status in the Indian states.
Table 2: Indicators of Quality Education
SDG 4
Indicator
Data Source
Quality Education
4.a. (Complement of) People per Education Institute (2015 – 16)[46]
Department of Higher Education, Ministry of Human Resource Development & District Information System for Education (DISE), National University of Education Planning and Administration (NUEPA).
Unified District Information System for Education. (Table 3.20. Annual Average Drop-out Rate by Educational Level: 2014-15)
4.a. Ratio of NAAC Accredited Universities (2018)[53]
Central Universities: UGC 29 June, 2017; State Universities: 6 Oct, 2017; Deemed Universities: 6 Oct, 2017; Private Universities: 6 Oct, 2017; NAAC Accredited Universities: State wise Number of colleges and universities accredited by NAAC, 16.8.2018.
Using the normalised data[54]on these eight parameters,[55]weights are assigned to each of them by Principal Component Analysis (PCA).[iv]For two indicators – People per Education Institute and Student Dropout—the complement of their normalised scores have been taken. Since these two are negative indicators—i.e., their high scores depict lower performance in terms of SDG 4—their complement (of 1) is considered in the index construction to keep the parity in the direction of scores with the other parameters, which is necessary in calculating a composite, direction-free and unbiased index. Calculation of weights for each indicator under SDG 4 is conducted to rank the states. This methodology has been chosen over a simple average technique to understand the dominant patterns in the dataset, in terms of weights that should be assigned to each parameter.
Let us define the weight attached, by PCA, to an indicator ‘m’ in SDG 4 aswm, wherewm= [max{component1, comp2,……, compm}]2* explanatory power of [max{comp1, comp2,…,comp m}]. Each of the weights has been scaled up to sum up to 1 (100%), in order to avoid under representation (see Appendix 9). For example, in the case of Delhi, each of these respective weights is multiplied by the normalised scores for all the eight component indicators to arrive at its final SDG 4 score at 0.821. The same exercise is repeated for all the states and then ranked in accordance with their SDG 4 scores.
Indices are crucial for policymakers since it provides a holistic and informative overview than would not be possible otherwise. The objective of creating an index is to move from multiple indicators to a single metric of observation.[56]The construction of a multi-variate index is essentially based on the theoretical foundations of the multi-attribute utility theory. During certain decision analysis that involve making informed choices about multiple objectives, the preferences of the decision-maker are depicted numerically through utility functions[57]such as the weighted SDG 4 index developed in this paper.
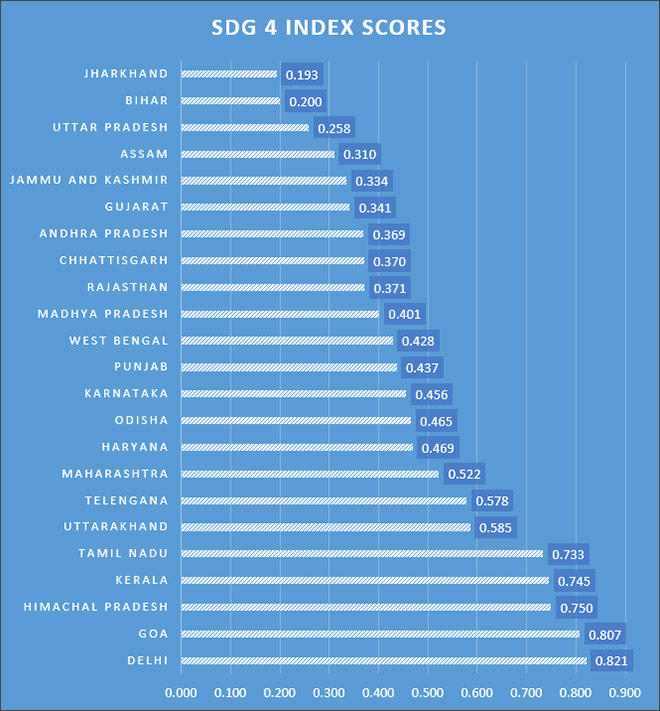
Finally, we get the state-wise composite SDG 4 indices as seen in the following graph, similarly developed by Ghosh et. al. (2019),[58]where Delhi is the top performer and Jharkhand is the worst. This index is strongly considered to be an advancement over the previously published NITI Aayog’s SDG 4 index scores[59]for two reasons: (1) the randomness in weight determination of the component indicators has been removed through robust statistical methods like principal component analysis; (2) the Niti Aayog’s SDG 4 indicators lack any focus on (a) higher education (sub goal 4.3), (b) overall literacy situation (sub goal 4.6) and (c) quantified infrastructural resources available (sub goal 4.a)—i.e., it does not cover as many of the targets outlined in SDG 4 and considers fewer indicators that are almost homogenous in category. Even the UN SDSN’s SDG Index and Dashboard Report 2018,[60]which scores India at 64.8 percent in terms of SDG 4, does not evaluate India at a sub-national level and uses only three basic parameters (net primary school enrolment rate, mean years of schooling & literacy rate of 15-24 year old’s) for evaluation at a national level.
Table 3: SDG 4 Index Scores
(Source: Authors’ own)
Most of the poorer northern states in India (Jharkhand, Bihar, Uttar Pradesh, Jammu and Kashmir, and Chhattisgarh) are low performers as compared to the south Indian states (Goa, Kerala, Tamil Nadu, Telengana, and Maharashtra). This is also relevant in contemporary times when the poorer states in India are increasing their education budgets in synchronisation with the richer states,[61]to encourage education infrastructure for the masses. Delhi is the best performer in terms of Quality Education, and Jharkhand is the worst. In Delhi, there is definite change in outlook towards the public education system and concrete measures have been taken in the past few years to revamp the government schools.[62]The National University of Education Planning and Administration (NUEPA) report in 2012 ranked Jharkhand at 34 out of 35 states and union territories in India, in terms of elementary education.[63]Although it has been almost 20 years since the formation of Jharkhand, according to a 2016 report in theFinancial Express, 35 out of 81 assembly constituencies have no college at all and in 11 districts there are no colleges for women. However, over the past few years, the state has tried to increase its expenditure on education.[64]
The rankings show that India’s rural states are lagging behind. Most of the states with the lower scores are the ones with higher percentages of poor rural population, such as Uttar Pradesh and Bihar. This is because of various reasons, including the low teaching quality due to non-permanent posts for teachers, teacher absenteeism or involvement in non-teaching duties, exemption from Teachers’ Eligibility Test (TET) and lack of quality training for teachers.[65]
1.6. Delhi and the rural-urban divide
Table 4 compares parameters for public education in the NCT of Delhi and its neighbouring states of Haryana, Rajasthan, and Uttar Pradesh (UP). In the NCT of Delhi, 97.5 percent of the population lives in urban areas, whereas 65 percent of the people in Haryana, 77 percent of the people in UP, and 75 percent of the people in Rajasthan, live in rural villages.[66]
The literacy rate of the population is much higher in Delhi than the neighbouring states. ASER 2018 reports indicate that a large section of primary students in rural Haryana, Rajasthan, and UP could not read a grade-2 book.[67]Although there is no comparable data for Delhi, the government’s recent assessments indicate that 63 percent of students from grade III to grade IX can now read[v]their grades’ textbook.[68]For the year 2015-16, the per-child education expenditure by the government of the NCT of Delhi, was higher than the combined per-child education expenditure by the governments of Rajasthan and UP.[69]The differences in the education expenditure outlays between Delhi and its surrounding areas, is a significant factor contributing to the disparity in the quality of public education in the region.
Table 4: Status of Public Education in Delhi and its neighbouring states
(Source: ASER 2018, Child Rights and You & Centre for Budget and Governance Accountability (CBGA) 2017)
Parameters
Delhi
Haryana
Rajasthan
Uttar Pradesh
Literacy rate
86.20%
75.60%
66.00%
67.70%
Gross Enrolment Ratio Higher-Secondary
77.90%
59.59%
59.31%
60.78%
Grade 5 Students who cannot read grade 2 text books
No comparable data
41.90%
50.90%
48.00%
Grade 5 students who can perform two digit division
No comparable data
49.10%
74.70%
70.30 %
Per student spending in Rupees (2015-16)
36964
No comparable data
12616
9167
2 Public education in Delhi
Public education in the NCT of Delhi is provided by different government agencies. To understand the public education landscape in the NCT of Delhi, it is essential to understand the governance structure and the operational mandate of these government agencies. Coordination issues between different Government agencies are most prominent in Primary and Secondary education level institutions in Delhi.
2.1. Structure of governance in Delhi
The NCT of Delhi, like other states and Union Territories, is governed by the three-level structure of governance: national, state, and local. However, the roles and responsibilities of each governance level is different in NCT of Delhi from those of other states and Union Territories.
From 1956 to 1992, Delhi was a union territory governed by the GoI, and it did not have a legislative assembly. In 1992, the Government of the National Capital Territory Act (GNCTD Act) came into force, and the Union Territory of Delhi was renamed the National Capital Territory of Delhi. The GNCTD Act also created a state-level legislative assembly for the NCT of Delhi. The members of this legislative assembly were chosen by direct election from territorial constituencies in the NCT of Delhi.[70]Although the GNCTD Act established a legislative assembly for the NCT of Delhi, its provisions limited the power of the legislative assembly in comparison to other states. The elected legislative assembly of Delhi does not have the authority to make laws relating to policing, public order, or land; these areas remain under the purview of the parliament of India.[71]
Different governance agencies, from the central, state and the local governments, are responsible for providing public services in the NCT of Delhi. For public services like healthcare, education, and access to electricity, there are overlaps in the responsibilities of the MCDs and the government of the NCT of Delhi, making coordination in governance essential to ensure good quality of these services. Since the MCDs are not accountable to the government of the NCT of Delhi, the coordination required is between local, state, and the central government agencies. To ensure more efficient coordination for the delivery of public services, the last two state governments of the NCT of Delhi, have demanded full statehood for Delhi.[72]A full statehood will make sure the local bodies are accountable directly to the government of the NCT of Delhi. However, the authority to make the NCT of Delhi a full state of India rests with the parliament of India and not with the state government of the NCT of Delhi or the people of Delhi.
2.2. Education landscape in Delhi
In the national capital territory (NCT) of Delhi, public school education is provided for the pre-primary, primary, secondary, and senior secondary levels. The government of the NCT of Delhi and the local MCD, run public schools across the capital city. Kendriya-Vidyalayas, known as the central schools, also operate in the NCT of Delhi. (See Table 5)
Table 5: Public Education Landscape of Delhi
(Source: Directorate of Education, Delhi; Kendriya-Vidyalaya Sangathan, MHRD & Status of Education (Public) Report 2017-2018, Praja Foundation)
MCD (2017-18)
DoE (2017-18)
KVs (2018-19)
Number of Schools
1695
1068
45
Number of Students Enrolled
7,24,627
14,60,675
1,14,738
Kendriya-Vidyalaya Sangathan: The Kendriya-Vidyalaya Sangathan (KVS) is an autonomous body that was established in 1962, and it works under the Ministry of Human Resource Development (MHRD) in Delhi. KVS oversees the functioning of some 1,064 Kendriya-Vidyalayas across India.[73]One of the main objectives of the KVS is to cater to the schooling and education needs of the children of transferable Central Government employees, including personnel from Defence and Para-Military units. KVS provides the children of these employees with a common programme of education. There are fixed number of admission seats in each KV and admission process follows set guidelines.[74]Applying for admission to a KV does not guarantee admission where usually the number of applications for admissions is much more than the available admission seats.[75]Although, the KVS also charges a monthly fee of INR 1725, not all students pay this fee and category wise exemption of fees is available.[76]45 Kendriya-Vidyalayas are running in the NCT of Delhi. These schools have classes from Grade I to Grade XII, and in the academic year 2018-19, they were catering to over 114,000 students.
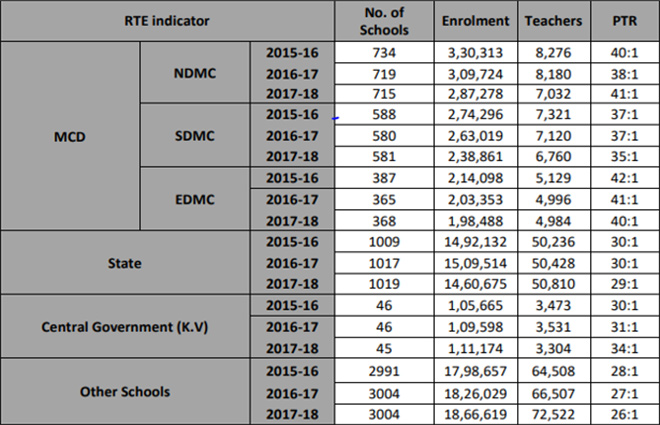
MCD-schools and DoE-schools: Providing pre-primary and primary education is mainly the responsibility of the local municipal bodies (MCD) in the NCT of Delhi. Directorate of Education (DoE) of the Government of NCT Delhi (Delhi-Government) is primarily responsible for secondary and senior secondary education. Although the primary education is the responsibility of MCD, DoE has converted 326 of its schools into Sarvodaya Vidyalayas.[vi]In Delhi, at present, there are 1695 schools run by MCD (MCD-schools) and 1068 schools run by DoE (DoE schools). In the academic year 2017-18, around 1.4 million students were attending DoE schools, and about 720,000 students were attending MCD schools. Independent administrative bodies run the MCD and DoE schools in the NCT of Delhi, but the MCD schools are only till grade V. After grade V, the students from MCD schools are transferred to a DoE school to continue their secondary education. This arrangement makes academic and administrative coordination between MCD and DoE essential to ensure quality public education for students across all grades and facilitate the academic transfer of students from MCD schools to DoE schools in grade VI.
In 2014, the Aam Aadmi Party (AAP) won the Delhi legislative elections with a vast majority, and their government runs the DoE schools. The Bhartiya Janta Party (BJP) formed the central government in 2014 and won the municipal elections in the three MCDs (East, North and South) in 2017, and their administration runs the MCD schools. The two political parties often disagree on the issues of fund allocation and monitoring responsibilities of the MCD.[77]In a recent affidavit filed by the DoE in Delhi High court, the DoE alleged that, “Education is not a priority for the local bodies. As a result not only the fundamental right of children, enrolled in the schools of local bodies, to receive a good quality education is being violated, it is unfair for them to not get similar kind of opportunities as their peers in Delhi government schools despite being the resident of the same territory.”[78]The political differences make the required coordination for ensuring a good quality education throughout public schooling in Delhi, much more challenging to achieve.
2.3. Delhi Government’s recent education reforms
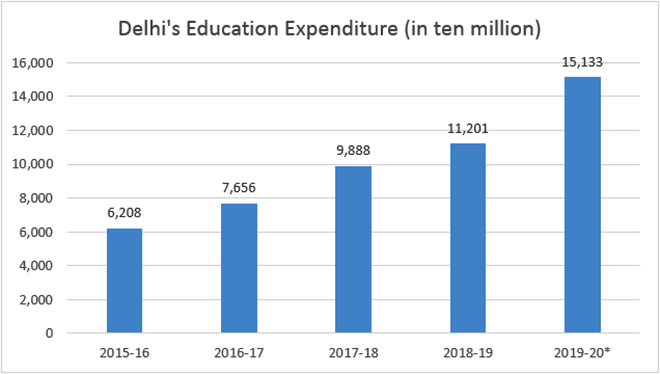
According to a baseline test taken in public schools by the DoE, in grades 6, 7 and 8, about 56 percent of the students could not read their textbooks. According to the Delhi-Government, students were being promoted from one grade to another without any attempt or remediation to improve their learning levels.[vii]The accumulated learning deficit is leading to low pass percentage in grade IX, which stands at 50 percent and declining continuously.[79]Over the last three years, the Delhi-Government has made substantial investments in public education. In 2016-17, Delhi-Government allocated 22.6 percent of its annual budget to education, the highest for any state in India and far above the national average of 15.6 percent.[80]The expenditure on education had increased from INR 62,080 million in 2015-16 to INR 112,010 million in 2018-19, an increase of over 80 percent.[81]The sharp increase in education expenditure points towards the importance and urgency towards reforming education system shown by the government of the NCT of Delhi.
Despite political and administrative differences, some of DoE’s education reform initiatives were also implemented by MCD in their schools.[82]The following are some of the reforms and initiatives[83]of the Delhi-Government to improve the quality of education in DoE schools:
Improving School Infrastructure: The DoE constructed over 8,000 new classrooms in the existing public schools and over 22 new schools with modern facilities in Delhi. Some 54 model DoE schools were set up across the NCT of Delhi. Estate managers were hired for each DoE school to look after the school building, assist in overall upkeep of the school and coordination with external bodies like the Public Welfare Department (PWD). In the budget of 2017-18, Delhi-Government also allocated INR 1000 million to build and modernise a library in every DoE school.
Reading Campaign: In 2016, the DoE launchedReading Campaign, targeting 56 percent of the enrolled students who could not read a grade IV textbook. This campaign aimed at attaining reading literacy in Hindi for every child. Teachers were trained in reading pedagogy. According to Delhi-Government, over 100,000 students learned to read an advanced story in Hindi.
Chunauti-2018: In 2018, Delhi-Government launchedChunauti 2018initiative to bridge the learning gaps of students of grade 6-8 and to ensure zero dropouts in grade 9. Students were divided into three groups based on their learning levels. Differentiated teaching-learning approach was employed in schools, and a specialised curriculum was designed for each of the three groups. According to Delhi-Government the exam results for students of grades 6, 7 and 8 increased to 66 percent, 69 percent and 73 percent, respectively.
In 2019, the grade XII students from the DoE schools outperformed their private school-counterparts and the national average, in terms of the number of students passing the CBSE.[84]Delhi-Government’s education reforms are being pitched as a model for other state governments.[85]By substantially increasing the funding for education and by implementing target policy initiatives to improve the learning levels, the Delhi-Government has pushed improving public education up on the agenda of other states as well. The perception of Delhi’s successful education reforms is also backed by this paper’s analysis (Table 3), where the NCT of Delhi scores better than all other Indian states on SDG 4 index.
The education reforms, improvement in school infrastructure and a road map to further improvement in quality of education, were a prominent part of AAP’s election manifesto for the 2019 general elections and 2017 MCD elections.[86]Surveys conducted in 2017 and 2018, showed that parents of students from DoE schools were more satisfied with the quality of education than the parents of those attending MCD schools.[87]Despite speculations on the educational reforms in Delhi, the AAP failed to win enough seats to control the MCDs in the 2017 MCD elections and was unable to win any seat, including the East Delhi with Atishi Marlena[viii]as a candidate, in the 2019 general elections. These observations raise interesting questions about public education as an election agenda and voter consideration. They also raise questions about voter awareness of the importance and urgency of public education reforms.
2.4. Comparing the three education systems
The three education systems in Delhi—MCD, DoE and Central schools—run independently of each other. They vary in parameters like the number of teachers, Student to Teacher Ratio (STR), per capita expenditure on a student, school fees, and students’ learning outcomes.
This paper uses data collated by the Praja Foundations in its annual reports, to compare the three education systems and outline the similarities and differences (operational and educational outcomes) between these systems. According to the most recent report by the Praja Foundation, “Although the Delhi Government claims education as its success story, it is clear that public schools that cater to students from economically disadvantaged sections are unable to ensure their students, the quality of education that would enable them to complete their schooling and seek better opportunities.”[88]The Delhi government has dismissed these conclusions.[89]
2.4.1. Education Expenditure
Table 6: Per child Education Expenditure
(Source: Status of Education Report, Praja Foundation, 2019 & Kendriya Vidyalaya Sangathan, MHRD)
MCD
DoE
KV
Education Expenditure per child (2017-18)
INR 31,414*
INR 51,773**
INR 39,752***
*Average per child expenditure in 2017-18.
**Per child budget allocated for DoE in 2017-18.
***Estimated using the budget grants from the GoI to KVS in 2017-18.[90]
The increase in education budget by the Delhi-government and MCDs is reflected in the increasing per child expenditure in the DoE and MCD schools.[91]In the year 2016-17, the per child expenditure increased 12 percent for the MCD schools and 9 percent for the DoE schools, from a year earlier. For 2019-20, the per child allocated budget for DoE schools is INR 75,056 and is INR 45,916 for MCD schools.
The Kendriya Vidyalaya Sangathan schools charge monthly fees. This sets them apart from two other Public schooling systems (MCD and DoE) which provide free education. The fee charged by KVS, however, is not enough to cover the annual operational cost and the KVS depends on the Government of India’s grants for the rest of the expenditure. In 2017-18, the GoI spent INR 39,750 in grants for every child (average) studying in the Kendriya Vidyalaya.[92]The expenditure per child in KV has decreased by around four percent in the academic year 2018-19 than the expenditure in the year 2017-18.[ix]The per child expenditure in DoE and MCD schools has been increasing for the past four years, and with the yearly increase in the education budget, this trend is likely to continue. The KVS schools, as of now, is an outlier—the per child expenditure done by the GoI has marginally decreased in the last few years.
According to the government of the NCT of Delhi, the public education system has suffered years of neglect.[93]A lot of financial investment in education is being made towards reducing the deficit in the required schooling infrastructure. KVS, on the other hand, has consistently had better schooling infrastructure than DoE and MCD schools.[94]From the trends on spending in DoE and KVS, it can be inferred that once the initial investment to improve schooling infrastructure in DOE schools is completed, the per child expenditure of the DoE schools should decline, as the decreasing cost advantages would come into play.
2.4.2. Enrolment trends
Table 7: Enrolment in three Delhi systems
(Source: Status of Education Report, Praja Foundation, 2019 & Kendriya-Vidyalaya Sangathan, MHRD)
Year
2015-16
2016-17
2017-18
Students enrolled in MCD*
8,18,707
7,73,096
7,24,627
% change in enrolment
-5.5%
-6.2%
Students enrolled in DoE*
14,92,132
15,09,514
14,60,775
% change in enrolment
1%
-3%
Students enrolled in KV
107368
114148
% change in enrolment
6%
*Numbers for MCD and DoE are calculated in the source using a time series regression analysis.
Despite the increase in the absolute and the per child expenditure by MCD and DOE in their schools, the total numbers of students enrolled in these schools have been decreasing over the years. As shown in Table 7, the decrease in the enrolment is much more profound for MCD than for DoE. The Kendriya-Vidyalayas have witnessed an increase in the total number of enrolments from 2016-17 to 2017-18. However, it is difficult to infer from the data if some students have moved from DoE and MCD schools to Kendriya-Vidyalayas.
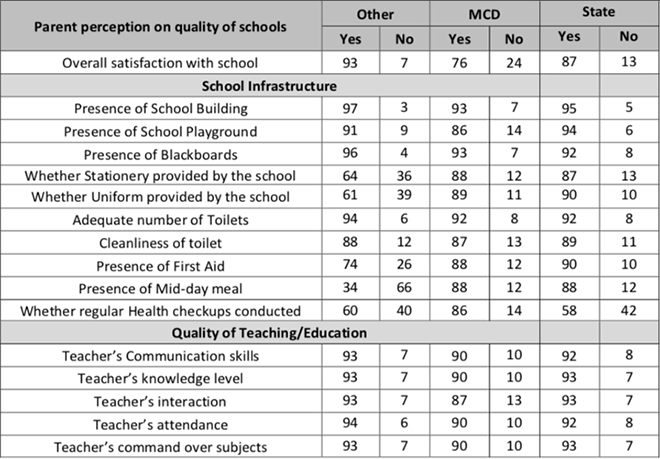
A survey done by the Praja foundation in April-June of 2018 may indicate one of the factors contributing to the trend of decreasing enrolments in the DoE and MCD schools. Over 2600 households with children in the age group 6-14 years from various areas of the NCT of Delhi, were surveyed for the education questionnaire. The sample had 905 households with children attending MCD schools, 550 households with children attending DoE schools, and the rest were attending other kinds of schools (including Kendriya-Vidyalayas).[95]The sample set of the survey, with households from all three main public education systems in Delhi, can be viewed as widely representative of the perception of the parents towards public schools that their children attend. The results from the survey are presented in Table 8.
The results of the survey indicate a greater dissatisfaction with the quality of education and the schooling facilities in parents of students attending MCD and DoE schools than the parents of students from other schools. The survey results also point towards a correlation between the dissatisfaction and a drop in the student enrolment in the schools (MCD schools have the lowest parent satisfaction rate among the three systems, and they have experienced the highest dip in the number of enrolled students).
It is noteworthy that the scores from the survey for Quality of Teaching/Education between the Other schools, DoE (state schools), and MCD schools are not highly different. Also, the DoE and MCD schools scored much higher than the Other schools, in parameters of School Infrastructure like providing of free stationary and uniform. However, despite the schooling quality being almost similar in Public schools and other schools, and the availability of free stationeries and uniforms in Public schools, the private schools are still more preferred by parents. One possible explanation for this pattern comes from the analogy of “Spider Vs Starfish schooling System” described by Lant Pritchett in his book, “The Rebirth of Education.”[96]Public schooling education system, like spiders, is centralised in the control of curriculum, examinations, and other aspects of schooling. The centralised control can make it difficult for public schools to contextualise their practices according to the local needs of students and communities. It may also slow down the speed of transformation after investment in these systems. This may have led to the perception that Public Schooling systems are not effective in catering to students’ needs.
Kendriya Vidyalayas, however, which are part of Other Schools in the Praja survey, are as centralised as the MCD and DoE schools. Although the survey does not provide results specific to KVS, based on the rising enrolment in KVS, it can be inferred that KVs still have much better satisfaction rating that the other two public schooling systems in Delhi. Despite recent reforms and improvements in public schools of Delhi, the survey clearly demonstrates parents’ preference for private schools and KVs. A large section of parents who can afford to send their child to a private school and KVs, are choosing to send their child to these schools. This raises pertinent questions regarding the management of allocated budgets on public education.
Table 8: Parent perceptions on school quality in Delhi (% of respondents)
(Source: Status of Education Report, Praja Foundation, 2019)
2.4.3. Pupil-to-Teacher Ratio (PTR)
The RTE had laid down specific provisions of mandating 1 teacher per 30 students in Primary and 1 teacher per 35 students in Secondary classes. PTR forms an important aspect of human facilitation of physical infrastructure in education (See Table 9).
Table 9: PTR in the Public Schools of Delhi
(Source: Status of Education Report, Praja Foundation, 2019)
The MCD schools have consistently been in violation of RTE provision of maintaining a healthy PTR of 30:1. The extremely poor PTR in the MCD schools is of grave concern in the sense that these schools provide the first stages of education to the youngest generation of the society. It is not wrong to say that this age group of students requires relatively more teachers and attention than the students at higher grades. However, data shows that this is the segment of public education with the least number of teachers to cater to student groups in contrast to DoE and the KVs.
The average PTR of 38:1 in the three MCDs is also much higher than the PTR of 29:1 in DoE schools and 34:1 in KVS. Although the above data shows DoE schools with a PTR of 30:1 or less since 2001, the Delhi governments own reports deny this perception of healthy PTR. According to the DoE, the PTR in 2015-16 was as high as 62:1.[97]The disparity between the data in Table 9 and the data presented by DoE are due to factors such as teachers being pulled out for administrative duties, teachers on leaves or teachers’ absenteeism, thus driving the PTR higher in DoE figures. According to recent reports by DoE, the PTR in their schools has been reduced from 61:1 in 2015-16 to 33:1 in 2018-19.[98]The improvement in DoE schools PTR can be attributed to the investment in building more schools and classrooms. MCD schools, on the other hand, need immediate investments and measures to reduce the PTR and be in compliance of the RTE rules.
2.4.4 Dropout Rates
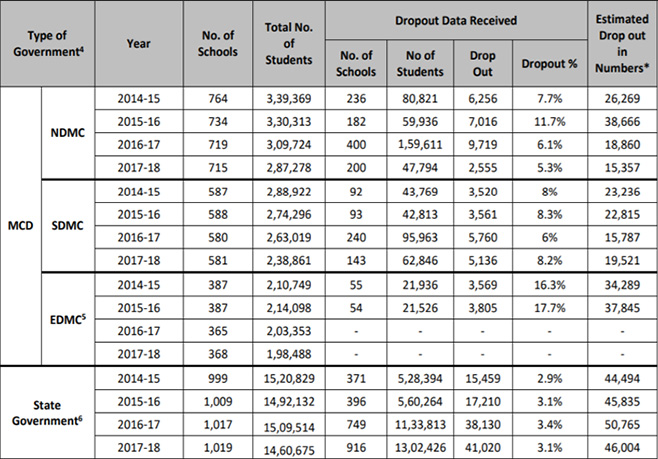
Table 10:Student Dropout Rates (Delhi)
(Source: Status of Education Report, Praja Foundation, 2019)
Table 10 presents an estimated dropout rate, as analysed by the Praja foundation in their Annual Status of School Education report. The rate is estimated, because the RTI information did not reveal dropout rates for all students.[99]The estimated analysis reveals that the dropout rate is much higher in the MCD schools than in DoE schools, despite the fact that all MCD schools are dealing only with primary classes and DoE schools have both primary and secondary classes. There are data constraints in inferring that the MCD dropout students moved to other schools. Although no comparable data was found for KVS, based on the enrolment trends presented in section 2.4.2, it can be inferred that the dropout rate will be lower in KVS than in DoE and MCD. The high dropout rate of students from MCD schools is a worrying trend, as it indicates that a proportion of students in Delhi may not complete even the primary schooling.
2.4.5. The Mid-Day Meal Scheme
The Mid-Day Meal Scheme was launched in August 1995 to enhance enrolments, retentions, attendance, and to improve the nutritional levels of the students in public schools. The scheme is supported under the GoI’s flagship Sarva Siksha Abhiyan (SSA) and provides healthy meals with a minimum nutrition value to all the primary (grade 1- V) and upper primary (grade V-VIII) students of public schools.[100]All students of MCD and DoE schools are provided lunch under the Mid-Day Meal Scheme. The DoE has taken many steps to ensure hygiene and nutritional quality of the food provided to the students.[101]
The KV schools, however, are exempted from the Mid-Day Meal Scheme. By not providing Mid-Day Meals, the KV schools make it more difficult for students from economically weaker sections, to consider and apply for admissions to KVS where they would get access to better educational infrastructure. Apart from the existence of fees in KVS, the lack of Mid-Day Meals can be considered as an impediment in ameliorating inequality in terms of access to quality education facilities.
2.4.6. Exam Results
Table 11: Grade X and grade XII CBSE board pass %
(Source: Status of Education Report, Praja Foundation, 2019)
Year
Grade X pass %
Grade XII pass %
DoE
KVS
Other schools
DoE
KVS
Other schools
2014
98.81
99.58
99.04
88.67
98.02
92.09
2015
95.81
99.59
97.05
88.11
95.94
89.75
2016
89.25
99.52
95.43
88.91
95.71
86.67
2017
92.44
99.83
92.85
88.36
95.96
84.02
2018
68.90
97.03
89.45
90.65
98.06
88.38
Students of grade X and grade XII from both Kendriya-Vidyalayas and DoE schools, appear in Central Board of Secondary Education’s (CBSE) board exams. Table 11 presents the outcome of the students from DoE, KVS, and other schools (private schools) in terms of the pass percentage of students in that year. The MCD schools cannot be compared in the purview of board results since they provide education at only pre-primary and primary levels.
Students from Kendriya-Vidyalayas have been consistently performing much better in X and XII board exams than the students from DoE and other schools. Since 2016, grade XII students from DoE schools have performed better than the grade XII students from other (private) schools. Grade X results of the DoE students, however, took a sharp dip in 2018. The Delhi-government attributed this drop to the revision and reintroduction of the CBSE board exams in grade X. In 2019, the pass percentage of the grade X students of DoE schools marginally increased to 71.97 percent.[102]Also important is that the students who are able to afford the KVs generally come from a higher financial background than the ones enrolled at the DoE schools that charge nominal fees. This gives an added advantage to the former in terms of access to financial and academic resources, allowing them a better chance at scoring higher in the exams. This inherent privilege in the system can be made more inclusive by drastic infrastructural enhancement of the DoE schools.
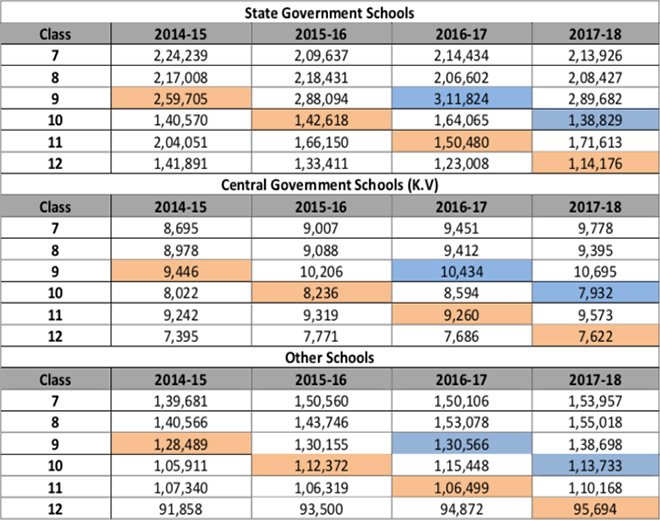
The grade X and XII results do not present an accurate picture of the performance of students. According to Delhi-government’s assessments, the number of students passing grade IX is around 50 percent in the DoE schools. This means that only half of the students enrolled in grade IX, sit in the grade X board exams, due to the low quality of training in the previous grades. This can also be observed in the low transition rate of the grade IX students to grade X in the DoE schools (see Table 12). No comparable data for the pass percentage of grade IX students from Kendriya-Vidyalayas in Delhi is available in the public domain. From the number of students enrolled in grade IX and then grade X in the subsequent year, it is observed that the transition rate for the students in KVs (87 percent in 2014-15 to 2015-16, 75 percent in 2016-17 to 2017-18) is much higher than the DoE schools (54 percent in 2014-15 to 2015-16, 45 percent in 2016-17 to 2017-18). From the high transition rate of the students from grade IX to X, we can infer that a majority of grade IX students in Kendriya-Vidyalayas pass their end-of-year exams and proceed to grade X.
Table 12: Enrolments in State Government, Central Government (KV) & Others Schools – Class 7 to Class 12.
(Source: Status of Education Report, Praja Foundation, 2019)
The grade XII, X and IX results make it clear that the improvement in grade X and XII results of the DoE Schools, has been achieved after failing more than half of the students in grade IX. It can be indicated that initiatives like the Patrachar scheme[x]and Chaunati 2018, aimed at improving the percentage of students able to clear grade IX exams have met with limited success. Although the government reforms have improved the basic literacy in the students, there is little to indicate if the students are learning grade-appropriate skills.
3. Conclusion
For a developing country like India, education is an essential tool for creating human capital required for sustaining development in the 21stcentury. While India has made substantial progress in getting children enrolled in schools, this has not led to children getting quality education. There is a growing acknowledgment by public authorities and governments across India that there is a learning crisis in the country’s public schools. At the same time, there is more willingness on the part of authorities to invest substantial human and financial resources in improving the quality of education. In a country as big and diverse as India, it is essential to identify contextualised best role models of public education, before more resources are invested to achieve the goals of SDG 4 (Quality Education). At a time when budget outlays are scarce in implementing the SDGs, optimising the financial resources towards educational infrastructure is of utmost importance.
This study made an assessment of the sub-national level state of public education in India while examining the educational policy space in the country. The analysis found the NCT of Delhi to be the top performer in the metric scale of quality education in India. Delhi-government’s focus on improving school infrastructure, investing in bridging the learning gap of the students, improving teacher training and quality, and allocating more resources to education, is a commendable approach to tackle the crisis of learning levels in the public schools.[103]The public schools in Delhi, however, still face a lot of challenges. Initiatives like Chunauti-2018 and the reading programs are still teaching basic Hindi literacy. Even after the success of these initiatives, the students are not at par with their grade levels. The transition rates of students from grade IX to X remains low, and more than 170,000 students dropped out of the DoE schools in 2018.[104]
A significant challenge for Delhi is the politically divided governance structure that impedes cooperation between MCD and DoE schools. The public schooling systems in Delhi still face a lot of governance and operational challenges in providing quality education to their students. Given the work yet to be done in the public schools in Delhi, it is too soon to pitch the public education in the NCT of Delhi, as a perfect role model for the rest of the states.
Within Delhi, the most crucial lessons can be taken from the Kendriya Vidyalayas. As this paper has outlined in its analysis of the three main public education systems in the NCT of Delhi, the input parameters and the learning outcomes of the Kendriya Vidyalayas have been following a different trajectory than those of DoE and MCD. Operationally, the Kendriya-Vidyalayas also differ from the other two systems. Still, in certain respects, the three public education systems of Delhi are similar. All of them operate under a public authority and have a centralised operational model. Like DoE, KVs rely on the Central Board of Secondary Education’s (CBSE) board exams for assessing their students in Grade X and Grade XII. Given this, it can be inferred that the three public schools have similar learning objectives on a broad scale.
It can be argued that many of the best practices of the Kendriya-Vidyalayas will have strong external validity for other public education systems in the city. This paper proposes to start a discussion on those aspects. This study proposes for further detailed research on the governance flexibility, school-level decision-making powers, operational structures, books used, teacher trainings, pedagogical approaches, teaching methodologies, and other enabling factors of the Kendriya-Vidyalaya Sangathan. Kendriya-Vidyalaya is a unique model of public education with a history of delivering learning outcomes. The lessons and the best practices from the KVs can serve as crucial lessons not only for the policymakers of Delhi but also for every other region from where Government schools operate.
Authors’ Note: We thank the two anonymous reviewers for their valuable comments on an early draft of this paper. The authors would also like to thank the ORF Kolkata team for their guidance and useful inputs on this project. Roshan Saha, Research Assistant, and Anirban Mitra, Research Intern, both at ORF Kolkata, provided research assistance for this study.
APPENDICES
Appendix 1.(Complement of) People per Education Institute (2015 – 16)
Rank
States
Score
1.
Himachal Pradesh
1.000
2.
Uttarakhand
0.985
3.
Jammu And Kashmir
0.980
4.
Assam
0.977
5.
Chhattisgarh
0.963
6.
Madhya Pradesh
0.960
7.
Odisha
0.915
8.
Rajasthan
0.901
9.
Jharkhand
0.882
10.
Uttar Pradesh
0.842
11.
Karnataka
0.831
12.
Telengana
0.826
13.
Goa
0.780
14.
West Bengal
0.774
15.
Punjab
0.773
16.
Maharashtra
0.738
17.
Haryana
0.702
18.
Gujarat
0.696
19.
Bihar
0.663
20.
Tamil Nadu
0.653
21.
Andhra Pradesh
0.618
22.
Kerala
0.381
23.
Delhi
0.000
Appendix 2. Literacy Rate (2011)
Rank
States
Score
1.
Kerala
1.000
2.
Goa
0.835
3.
Delhi
0.758
4.
Himachal Pradesh
0.652
5.
Maharashtra
0.638
6.
Tamil Nadu
0.568
7.
Uttarakhand
0.529
8.
Gujarat
0.504
9.
West Bengal
0.449
10.
Punjab
0.436
11.
Haryana
0.427
12.
Karnataka
0.421
13.
Odisha
0.344
14.
Assam
0.323
15.
Chhattisgarh
0.263
16.
Madhya Pradesh
0.234
17.
Uttar Pradesh
0.183
18.
Jammu and Kashmir
0.166
19.
Andhra Pradesh
0.162
20.
Telengana
0.162
21.
Jharkhand
0.143
22.
Rajasthan
0.134
23.
Bihar
0.000
Appendix 3.Gross Enrollment Ratio (2015-16) – Primary Education
Rank
States
Score
1.
Delhi
1.000
2.
Jharkhand
0.943
3.
Bihar
0.884
4.
Assam
0.825
5.
Tamil Nadu
0.740
6.
Odisha
0.734
7.
West Bengal
0.732
8.
Telengana
0.707
9.
Karnataka
0.705
10.
Goa
0.690
11.
Punjab
0.657
12.
Rajasthan
0.608
13.
Chhattisgarh
0.592
14.
Uttarakhand
0.565
15.
Himachal Pradesh
0.546
16.
Maharashtra
0.506
17.
Gujarat
0.486
18.
Kerala
0.418
19.
Madhya Pradesh
0.381
20.
Uttar Pradesh
0.292
21.
Haryana
0.264
22.
Jammu and Kashmir
0.057
23.
Andhra Pradesh
0.000
Appendix 4.Gross Enrollment Ratio (2015-16) – Secondary Education
Rank
States
Score
1.
Delhi
1.000
2.
Himachal Pradesh
0.993
3.
Goa
0.926
4.
Kerala
0.881
5.
Tamil Nadu
0.673
6.
Chhattisgarh
0.622
7.
Maharashtra
0.569
8.
Punjab
0.501
9.
Uttarakhand
0.468
10.
Haryana
0.431
11.
West Bengal
0.420
12.
Karnataka
0.408
13.
Telengana
0.391
14.
Madhya Pradesh
0.337
15.
Odisha
0.317
16.
Bihar
0.300
17.
Assam
0.272
18.
Rajasthan
0.219
19.
Andhra Pradesh
0.217
20.
Jharkhand
0.174
21.
Gujarat
0.167
22.
Uttar Pradesh
0.024
23.
Jammu and Kashmir
0.000
Appendix 5.Gross Enrollment Ratio (2015-16) – Higher Education
Appendix 8.Ratio of NAAC Accredited Universities (2018)
Rank
States
Score
1.
Goa
1.000
2.
Tamil Nadu
0.744
3.
Delhi
0.615
4.
Odisha
0.526
5.
Maharashtra
0.507
6.
Telengana
0.481
7.
Andhra Pradesh
0.419
8.
Kerala
0.359
9.
Karnataka
0.340
10.
Jammu and Kashmir
0.294
11.
Uttar Pradesh
0.287
12.
Haryana
0.203
13.
Bihar
0.193
14.
Uttarakhand
0.178
15.
Himachal Pradesh
0.175
16.
West Bengal
0.149
17.
Gujarat
0.141
18.
Madhya Pradesh
0.135
19.
Assam
0.108
20.
Rajasthan
0.060
21.
Jharkhand
0.058
22.
Punjab
0.058
23.
Chhattisgarh
0.000
Appendix 9. Estimated Weights for the Indicators
INDICATORS
Original Indicator Weights (By PCA)
Scaled Up To 1
(Complement of) People Per Education Institute (2015 – 16)
0.02
0.04
Literacy Rate (2011)
0.09
0.20
Gross Enrollment Ratio (2015-16) – Primary Education
0.02
0.04
Gross Enrollment Ratio (2015-16) – Secondary Education
0.09
0.20
Gross Enrollment Ratio (2015-16) – Higher Education
0.08
0.17
Student to Teacher Ratio (2015-16)
0.05
0.11
(Complement of) Student Dropout (2014-15)
0.06
0.13
Ratio of NAAC Accredited Universities (2018)
0.05
0.11
Endnotes
[i]Article was substituted by the 86thamendment of the constitution in year 2002. The 86thamendment provided Right to Education as a fundamental right in the part-III of the constitution.
[ii]Number of students enrolled in a given level of education, regardless of age, expressed as a percentage of the official school-age population corresponding to the same level of education.
[iii]Established in 1994 in Mumbai, Pratham is one of the largest Non-Governmental Organizations in India with a mission to ensure “Every Child in School and Learning Well”. ASER surveys by NGO Pratham is India’s largest NGO-run annual survey.
[iv]It is a mathematical method which transforms a group of correlated variables into uncorrelated variables, known as principal components. These components are further used to calculate the weights by their explanatory powers in the data set.
[v]This was after the Delhi state government implemented programmes to promote literacy skills in the schools.
[vi]DoE schools with classes from Grade I to Grade XII.
[vii]No Detention policy of RTE led to mandatory promotion of students from one grade to next, till grade IX.
[viii]Atishi Marlena worked as senior adviser to the deputy chief minister of Delhi, Manish Sisodia, from 2015 to 2018. She is often credited with designing and implementing many reforms to improve the education infrastructure and the learning outcomes of the students in DoE schools.
[ix]GoI grant expenditure for per child was calculated using the Kendriya Vidyalaya Sangathan’s budget statements and facts about enrolments for those years.
[x]DoE’s correspondence education scheme “Patrachar” where students who have failed in 8th or 9th class can apply for giving the 10th exam through correspondence.
[8]This study focuses on the emergence and adoption of the human capital idea as a framework for thinking about education and education policy. However, Schultz also included health care, on-the-job training, and migration for better job opportunities as forms of human capital investment, and the analysis of these activities was part of the human capital research program in economics from its inception.
[9]Theodore Schultz, “Investment in Human Capital,”The American Economic Review(1961): 1.
[10]B. F. Kiker, “The Historical Roots of the Concept of Human Capital,”Journal of Political Economy(1966).
[11]Alfred Marshall,Principles of Economics(1920).
[12]Gary S. Becker, “Human Capital: A Theoretical and Empirical Analysis, with Special Reference to Education”.University of Illinois at Urbana-Champaign’s Academy for Entrepreneurial Leadership Historical Research Reference in Entrepreneurship(1964).
[13]Jacob Mincer, “Human Capital and Economic Growth,”Economics of Education Review(1984).
[14]Jacob Mincer, “Schooling, Experience and Earnings,”National Bureau of Economic Research(1974).
[15]N. Gregory Mankiw, David Romer and David N. Weil, “A Contribution to the Emperics of Economic Growth,”The Quarterly Journal of Economics(May 1992).
[16]Robert E. Lucas Jr., “On the Mechanics of Economic Development,”Journal of Monetary Economics(1988).
[17]Sajitha Bashir, “Public versus Private in Primary Education: Comparisons of School Effectiveness and Costs in Tamil Nadu” (Unpublished Ph.D. thesis, London School of Economics, 1994).
[18]R. Govinda and N.V. Varghese, “Quality of Primary Schooling in India: A Case Study of Madhya Pradesh,”Paris: International Institute for Educational Planning, and New Delhi: National Institute of Educational Planning and Administration (NIEPA)(1993).
[19]Geeta G. Kingdon, “An Economic Evaluation of School Management-types in India: A Case Study of Uttar Pradesh” (Unpublished D.Phil. thesis, Economics Department, Oxford University, 1994).
[20]Geeta G. Kingdon, “Private Schooling in India: Size, Nature and Equity Effects,”Economic and Political Weekly31, no. 51 (1996).
[21]James Tooley and Pauline Dixon “Private Schools for the Poor: A Case Study from India,”CfBT Report, CfBT Reading(2003).
[22]Amartya Sen and Jean Dreze,An Uncertain Glory: India and It’s Contradiction(Princeton University Press: 2013).
[24]Martha C. Nussbaum, “Education and Democratic Citizenship: Capabilities and Quality Education,” Journal of Human Development7, no. 3 (2006): 385-395.
[25] J. Sachs et. al., “GlobalResponsibilities: Implementing the Goals – SDG Index and Dashboard Report 2018” (New York: Bertelsmann Stiftung and Sustainable Development Solutions Network, 2018).
[28]Nilanjan Ghosh, Soumya Bhowmick and Roshan Saha, “SDG Index and Ease of Doing Business in India: A Sub-National Study,”Observer Research Foundation Occasional Paper, no. 199(June 2019).
[29]“Resolution adopted by the General Assembly on 25 September 2015 -Transforming our world: the 2030 Agenda for Sustainable Development,”United Nations(2015): 23 – 25.
[30]“The directive principle of state policy,” Ministry of External Affairs, Government of India.
[31]“Right to Education,” Ministry of Human Resource Development, Government of India.
[42]R. Banerji, S. Bhattacharjea and W. Wadhwa, W, “The Annual Status of Education Report (ASER)’” Research in Comparative and International Education8, no. 3, (2013): 387–396.
[44]“Sustainable Development Goals – National Indicator Framework,”Social Statistics Division, Central Statistics Office, Ministry of Statistics and Programme Implementation, Government of India(2016): 11 – 14.
[46]Original figures are in absolute number of educational institutions which is used to divide the total population (as per Census 2011) in order to get the number of people that each institution caters to. The values have been normalized to range from 0 to 1. The normalised values have been subtracted from 1 to convert into its complement.
[47]The literacy rates relate to sample population aged 7 years and above. Originally expressed as percentage (converted to decimal), the values have been normalized to range from 0 to 1. In 2011, Telengana was still a part of Andhra Pradesh and so the literacy rate of Telengana (missing in the original dataset) is taken as the same as that of Andhra Pradesh.
[48]Original figures were expressed as a ratio. We have used the total Gross Enrolment figures for each state and then normalised these values to range from 0 to 1.
[49]Original figures were expressed as a ratio. The original data set consisted of individual values for Boys and Girls. A simple average of the data has been taken. We have then normalised these values to range from 0 to 1.
[50]Original figures were expressed as a ratio. We have used the total Gross Enrolment figures for each state and then normalised these values to range from 0 to 1.
[51]Original figures were expressed in number of students per teacher. The average of the values for Primary, Upper Primary, Secondary and Higher Secondary were taken. The values have been normalized to range from 0 to 1. The normalised values have been subtracted from 1 to convert into its complement.
[52]Original figures were expressed in percentage. The average of the values for Upper Primary and Secondary were taken. The values have been normalized to range from 0 to 1. The normalised values have been subtracted from 1 to convert into its complement.
[53]The total number of NAAC accredited universities in each state has been divided by the total number of universities (sum total of Central Universities, State Universities, Deemed Universities and Private Universities for each state has been taken) to get a ratio. This ratio indicates the number of universities in each state that have successfully met the different NAAC criteria. We have then normalised these values to range from 0 to 1.
[54]The data collected across 23 Indian states, owing to either the population size or geographical area in most cases, has inherent scale biases. The variables have been converted into per unit format (to remove the relevant scale bias). Further, all the data points have been normalized by the following formula to range from 0 to 1 (unit free). Now, for the negative indicators, the complement of 1 for their respective normalized values has been taken, so as to convert them into a positive indicator. This has been done so as form a uniform, unit and direction free, composite SDG 4 index/score.
Where,denotes the value of the component indicatorkof SDG 4for statej;denotes normalised value of the component indicatorkof SDG 4for statej;denotes the minimum value of the row vector ofykjvalues across the states; denotes the maximum value of the row vector ofykjvalues across the states. With ‘k’denoting an indicator, it is defined by the closed set k = [1, 8] and‘j’denoting a state, it is defined by the closed set j = [1, 23]
[55]Principal Component Analysis is conducted on 8 component indicators. However, some of these component indicators are constructed using more than one indicator. For example, Student to Teacher Ratio (2015-16) is computed with four parameters where the average of the values for Primary, Upper Primary, Secondary and Higher Secondary were taken.
[73]“Kendriya Vidyalaya Sangathan,” Ministry of Human Resource Development,Government of India.
[74]“Guidelines for Admissions in Kendriya Vidyalayas ( 2019-20 and onwards),” Kendriya Vidyalaya Sangathan, Ministry of Human Resource Development,Government of India.
[90]The KVs charge a small fee from their students. The GoI provides grants to KVS for the expenditure exceeding the revenue collected by the fees. The per child expenditure for Kendriya Vidyalayas mentioned in this paper is the grant that the central government spends per child on a student in KV. This does not include the fee revenue of the KVS in that academic year. Calculation: Total Grant received by KVS in 2017-18 is 4,997.25 crores; Total students enrolled in Nov 2017 is 1,257,099; Per child grant expenditure = (Total Grant received by KVS in 2017-18 ) / (Total students enrolled in Nov 2017).
[90] “Annual Budget,” Kendriya Vidyalaya Sangathan, Ministry of Human Resource Development,Government of India.
The views expressed above belong to the author(s). ORF research and analyses now available on Telegram! Click here to access our curated content — blogs, longforms and interviews.
Soumya Bhowmick is an Associate Fellow at the Centre for New Economic Diplomacy at the Observer Research Foundation. His research focuses on sustainable development and ...

 PDF Download