How fares India in healthcare? A sub-national analysis
Kriti Kapur
India’s geographical landscape is vast, cultural differences can be sharp, and income disparities are stark in certain regions. Access to healthcare, therefore, is varied and the on-ground gaps and challenges are complex. The NITI Aayog Health Index is an attempt by the current government to formulate a mechanism to monitor at the sub-national level the country’s performance in improving healthcare. This paper uses the findings of the Health Index to analyse the key trends in the most essential health outcomes across States and Union Territories. Using multiple data points from the health index reports, this paper explores the shortcomings of the health systems and processes with the aim of findings ways to address the problems.
Attribution:
Kriti Kapur, “How Fares India in Healthcare? A Sub-National Analysis,”ORF Occasional Paper No. 237, February 2020, Observer Research Foundation.
I. Introduction
India has seen immense progress across different socio-economic indicators over the past 70 years since independence. This development, however, has been highly uneven: while some sectors have shown remarkable progress, others are experiencing marginal development. Today, India is the world’s largest democracy, with a population of over 1.37 billion people[1]in 2019. Given current trends, India is expected to overtake China’s population by 2027.[2]The country’s literacy rates have risen to 69.1 percent, with male literacy at 75.7 percent and that for females, 62 percent.[3]
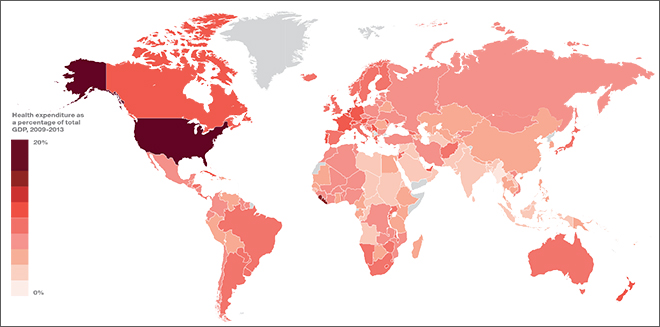
At the same time, India continues to face stubborn challenges in many social and development sectors. The country’s burden of disease, for one, specifically non-communicable diseases, has risen in recent years.[4]Yet, India’s expenditure on health remains stagnant at approximately 2.25 percent[5]of total central budgetary expenditure. This figure comes to just over one percent[6]of Gross Domestic Product (GDP), well below the 2.5-percent goal set by the National Health Policy of 2017.[7](See Map 1 for a visual representation of the proportion of GDP allocated to healthcare across the globe.) Indeed, the country’s contribution to the global healthcare infrastructure is highly inadequate, despite the highest-ever budgetary allocation of INR 690 billion[8]to health for 2020-21, a six-percent rise from 2019-20.[9]
Map 1. Health expenditure as percentage of Total GDP, 2009-13
Source:Francis S. Collins, World Economic Forum, ‘Growing importance of health in the economy’.
NITI Aayog Report: ‘Healthy States, Progressive India’
The NITI Aayog report, ‘Healthy States, Progressive India’outlines India’s performance in health and highlights the varied complexities and challenges therein, as well as the scope for improvement. The report aims to catalyse reforms at the sub-national level and help fulfill the country’s goals towards cooperative and competitive federalism.[10] To begin with, healthcare access across the country is varied, owing to different factors like the vast geographical landscape, deep cultural peculiarities, and wide income disparities. Recognising the complexities in understanding the problems of healthcare access at the federal level, the NITI Aayog uses a Health Index as a pillar for tracking health goals. The report, ‘Healthy States, Progressive India’, tracks the progress made by states and UTs in the index, highlighting the areas that each State should focus on to facilitate improvement in their overall health system.
The Health Index
The NITI Aayog Health Index consists of a set of relevant indicators (See Appendix 1), divided into three key domains:
Health Outcomes – including mortality rates, sex ratios, and immunisation levels;
Governance and Information – the status of the governance structures and information systems within states; and
Key Inputs & Processes – areas such as healthcare quality and availability, staff shortages and birth registration level
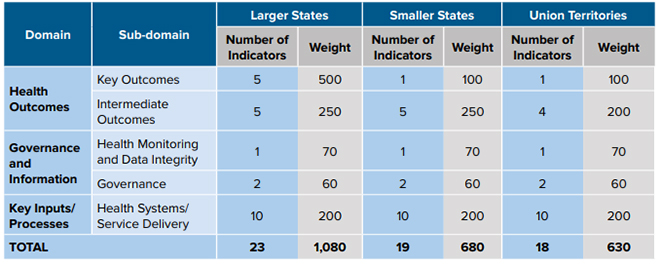
Each domain was assigned weights based on importance (See Appendix 2): the highest weightage was given to the Health Outcomes, primarily because they comprise most of the measures in SDG Goal 3. Within a domain, the weights have been equally distributed amongst each indicator. The data for the indicators under each domain was taken from existing annual and reliable data sources such as the Sample Registration Survey (SRS), Civil Registration Survey (CVS), and Health Management Information Systems (HMIS), along with online submissions by the states using the Web portal. The data was validated and analysed by an external agency. A composite index was calculated as a weighted average of the various indicators to measure the health performance of each state and UT in each period (2014-15, 2015-16, and 2017-18). It provides the overall performance, as well as across domains.
This paper explores the key trends in the health indicators across States and Union Territories, highlighting the challenges they face in their health systems and processes. The paper identifies the domains and indicators where each state and UT is lacking. This analysis paves the way for further research across health domains, sub-domains, key indicators, and regions.
II. Overall Health Index Analysis
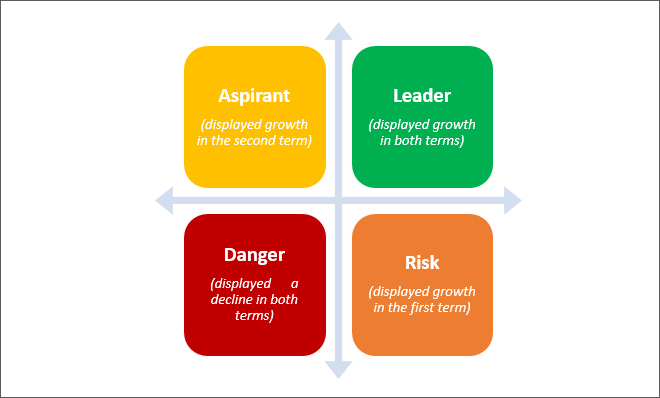
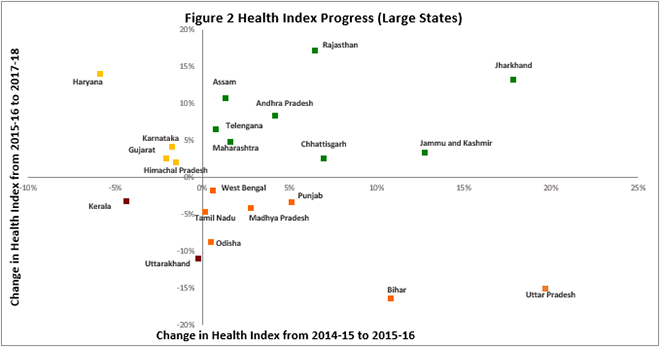
In the following analysis, each State and UT has been divided into four categories: Leader, Aspirant,[a]Risk, and Danger. ‘Leader’ signifies States or UTs that have seen an incremental rise in the health index in the first term (2014-15 to 2015-16) and second term (2015-16 to 2017-18). ‘Aspirants’ are those that experienced a decline in the health index in the first term but a rise in the health index in the second term. ‘Risk’ signifies States or UTs that climbed in the health index in the first term but dropped in the second term. ‘Danger’ signifies States or UTs that have seen a decline in the health index in both first term and second term.
Larger States
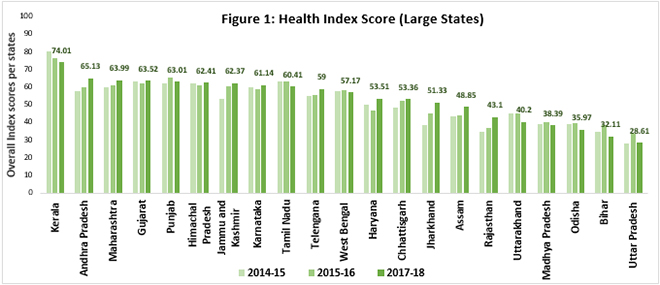
In terms of absolute numbers, 38 percent of India’s larger states have seen a positive trend across both the reports (See Figure 1). For Jharkhand, Rajasthan, J&K[b], Chhattisgarh, Andhra Pradesh, Telangana, Maharashtra and Assam, the health index has improved for both the periods 2014-15 to 2015-16, and 2015-16 to 2017-2018. These states are ‘Leaders’(See Figure 2), even though the absolute index has remained on the lower side. Almost all states in this category saw an improvement in more than 50 percent of the indicators in the health index, with Andhra Pradesh and Jharkhand leading the group with an improvement in 19 and 18 indicators (out of 30), respectively.
(Author’s own. Data Source: NITI Aayog Health Index 2015-16, NITI Aayog Health Index 2017-18)(Author’s own. Data Source: NITI Aayog Health Index 2015-16, NITI Aayog Health Index 2017-18)
States such as Haryana, Karnataka, Gujarat and Himachal Pradesh are categorised as ‘Aspirants’, having seen a declining trend in the first term (2014-15 to 2015-16) and then rising in overall performance during the second term (2015-16 to 2017-18). Haryana, while being a mid-level performer in absolute terms, has seen one of the highest growths from 2015-16 to 2017-18, while Himachal Pradesh saw minimal rise in the second term. While the absolute performance remains low, Haryana’s incremental progress was attributed by NITI Aayog’s report to the development of key processes[c]and human resource infrastructure: there was a decrease in vacancies of staff nurses (SN) and medical officers (MO), and a rise in functional cardiac care units (CCUs) in Haryana’s different districts. The districts also saw an overall positive development of health infrastructure with 43 percent[11]of the districts considered ‘developed’ and 33 percent,[12]‘moderately developed’.
While most larger states have shown an increasing trend in the overall health index, some dropped over the last few years. States such as Uttar Pradesh, Bihar, Punjab, West Bengal, Madhya Pradesh, Tamil Nadu and Odisha are categorised as ‘Risks’: they rose in the health index from 2014-15 to 2015-16, but dropped from 2015-16 to 2017-18. States such as Uttar Pradesh and Bihar, which were among the high runners in the first term (2014-15 to 2015-16), were among the lowest performers in the second term (2015-16 to 2017-18) with a decrease of 17 percent and nine percent, respectively in the overall scores.
The category ‘Danger’ comprises Kerala and Uttarakhand, which slid down the index in both the first and second terms covered in the report. Both cases are peculiar: There is Kerala, which maintained its top position in the overall health index for both the terms. The pillars of its healthcare system include a robust statewide private, as well as, public health infrastructure and an acute focus on social development. Considering the remarkable health system in Kerala, the drop in the health index across both the terms, as reported in the NITI Aayog report, is unexpected. Over the course of the two time periods, Kerala saw a drop of seven percent in the health index primarily due to the declining sex ratio at birth (SRS) and total case notification rate of Tuberculosis (TB). The second case is Uttarakhand, which has historically been one of the lowest performing states in health outcomes. Uttarakhand’s performance deteriorated in 14 indicators, and showed no significant change in four others. Both the state’s key health outcomes and the key processes were found to be in a bad state.
Smaller States & Union Territories
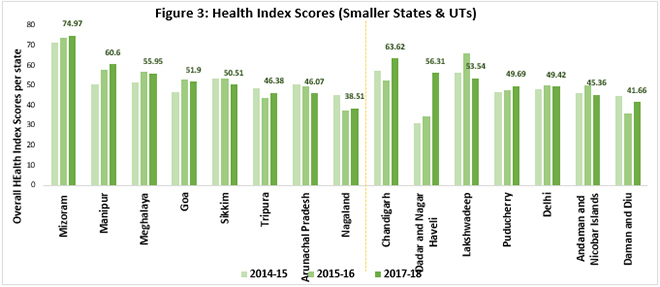
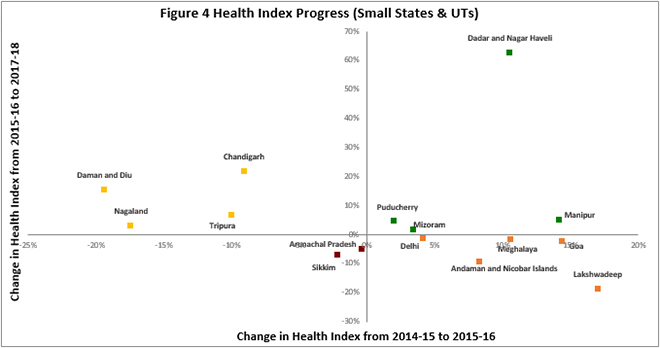
Amongst the smaller States and Union Territories (UTs), Mizoram saw the best performance for smaller states and Chandigarh for UTs. As per figure 4, Mizoram, Manipur, Puducherry and Dadra and Nagar Haveli were under the ‘Leader’category due to its consecutive rise in the health index in both the terms.
(Author’s own. Data Source: NITI Aayog Health Index 2015-16, NITI Aayog Health Index 2017-18)
Tripura and Nagaland comprised the ‘Aspirants’ category for the smaller states, while Chandigarh along with Daman and Diu were considered the‘Aspirants’amongst the UTs. Chandigarh was one of the top performers in UTs and fared better than most small states, with a rise of 22 percent from 2015-16 to 2017-18, and an improvement in 60 percent of the indicators. This achievement can be attributed to the 13-percent[13]increase in health spending by the state government. Chandigarh saw an enhancement of health facilities with a rise in the number of hospital beds[14]and an increase of 58 percent[15]in allopathic and homeopathic dispensaries in the UT. Furthermore, there was an increased effort on the development of the overall health system, with enhanced focus on boosting the technical and educational elements of health.[16]
Categorised in the ‘Risk’ category are Meghalaya and Goa from the smaller states, and from the UTs, Delhi, Andaman and Nicobar Islands and Lakshadweep. Out of all the states and UTs in this category, Lakshadweep saw the sharpest decline: from an increase of 17 percent from 2014-15 to 2015-16, to a drop of 19 percent from 2015-16 to 2017-18. While most indicators (eight out of 18) remained stagnant, there was a steep decline in key health outcomes such as full immunisation coverage and proportion of institutional deliveries, leading to an overall decline in the index. For its part, Delhi saw a fall of one percent on the index, despite multiple initiatives such as the Mohalla Clinic Scheme along with increased spending by the government.[17]
(Author’s own. Data Source: NITI Aayog Health Index 2015-16, NITI Aayog Health Index 2017-18)
There was no UT in the ‘Danger’ category but small states like Arunachal Pradesh and Sikkim saw a decreasing trend during both the terms covered in the report. While Arunachal Pradesh showed a stagnant trend in terms of key health outcomes, Key Processes and inputs saw a substantial decline since 2014-15. The worsening trend could be attributed to the decline in the proportion of functional facilities as 24×7 primary health care units (PHCs), which is the first step in preventive and preemptive healthcare for India. According to a research conducted by the International Institute of Population Sciences (popularly called IPHS), only 34 percent[18]of them were following the IPHS human resource norms and only 60 percent[19]of the PHCs were accessible throughout the year. Similarly, Sikkim saw a negative trend in measures such as proportion of institutional deliveries, level of birth registration, and proportion of low birthweight among newborns.
III. Deriving Meaning from the NITI Data
1. Health Outcomes
While calculating the health index, NITI Aayog has given the highest weightage to the Health Outcomes, primarily because they constitute most of the measures in SDG Goal 3, and therefore, show the progress of the country in healthcare. The Health Outcomes are divided into two categories: Key Outcomes (consisting of measures of mortality and birth) and Intermediate Outcomes (consisting of measures of immunisation and TB).
Larger States
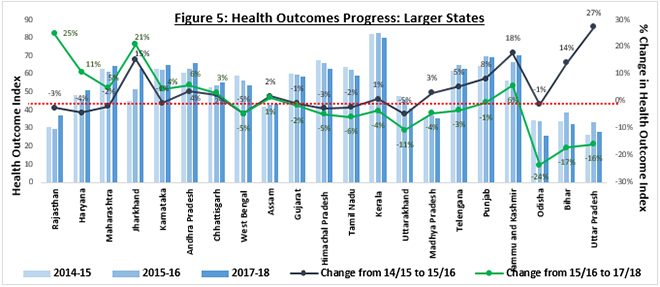
Fourteen out of 21 larger states (67 percent) saw a fall in their Health Outcomes index from 2015-16 to 2017-18. In absolute terms, the highest performing states were Kerala, Jammu and Kashmir, and Punjab; the lowest were Madhya Pradesh, Bihar, Uttar Pradesh, and Odisha. In terms of growth, Rajasthan, Haryana and Maharashtra saw the highest growth of 25 percent, 11 percent, and five percent, respectively from 2015-16 to 2017-18. As part of the Empowered Action Group (EAG),[d]Rajasthan has remained on the lower side of health system growth; it also has low literacy levels,[20]specifically for women. The NITI Aayog report, however, found Rajasthan to have climbed the health index, at least with respect to key outcomes.
While states like Rajasthan and Haryana showed an overall positive trend, Odisha, Bihar and Uttar Pradesh saw a steep decline in their Health Outcomes. Figure 5 shows the increase by Odisha, Bihar and Uttar Pradesh in the first term (2014-15 to 2015-16) and the sharp drop in the same indicators in the second term (2015-16 to 2017-18). During the second term of the health index (2015-16 to 2017-18), Bihar experienced declining trends in the total fertility rate, sex ratio at birth, and proportion of low birthweight; Orissa saw a drop in its full immunisation coverage; and Uttar Pradesh recorded an increase in the proportion of low birthweight among newborns from 2014-15 to 2017-18: leading to an overall decline in the Health Outcome Index. The three states also saw an alarming decrease in the indicator ‘Treatment success rate of new microbiologically confirmed TB cases’. In 2017, the TB Central Division (MoHFW) along with the NGO Reach started a TB Call to Action project[21]with special focus on Bihar, Orissa and Uttar Pradesh, with the aim of increasing awareness amongst the citizens.
(Author’s own. Data Source[e]: NITI Aayog Health Index 2015-16, NITI Aayog Health Index 2017-18)
Smaller States
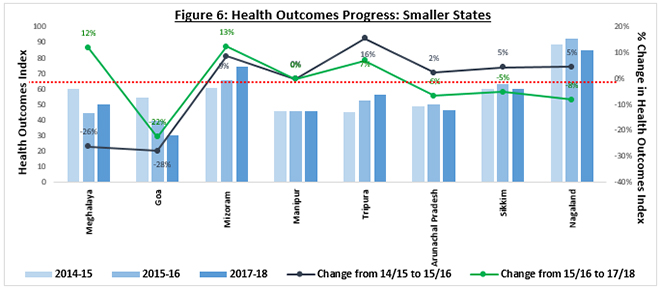
Figure 6 shows the progress of the smaller states on the overall health outcome index. In the second term of the NITI Aayog Health Index (2015-16 to 2017-18), 50 percent of the states saw a fall in the health outcome index. Mizoram fared the highest when looking at the growth of the health index from 2015-16 to 2017-18, but in absolute terms Nagaland saw the highest value, even though there was a decrease of eight percent from the first term (2014-15 to 2015-16). The NFHS 4 noted that the poor performance in Nagaland was attributed to the dismal state of maternal and child healthcare.[22]Furthermore, the enduring difficulties due to terrain, lack of private investments, internal conflict and misappropriation of funds have made it increasing difficult to improve health systems and indicators.[23]
Meghalaya was one of the best performers, recording a sharp rise of 12 percent in the health outcome index, despite the sharp fall of 50 percent in 2014-15 to 2015-16. The worst performer amongst the smaller states was Goa with a fall of 22 percent in the second term and 28 percent in the first term of the index. While Immunisation Coverage saw an increase in Goa, there was a fall in the Proportion of Institutional Deliveries as well as the Total Case Notification Rate of TB and Treatment Success Rate of New Microbiologically Confirmed TB Cases.
(Author’s own. Data Source[f]: NITI Aayog Health Index 2015-16, NITI Aayog Health Index 2017-18)
Union Territories
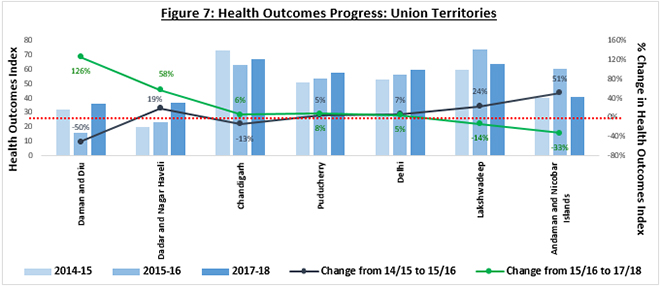
Daman and Diu, and Dadra and Nagar Haveli saw a rise in the Health Outcome index from 2015-16 to 2017-18. The steep rise in Daman and Diu can be attributed to the big fall in 2015-16, leading to an increase in 2017-18 to a steady value, while comparing the Health Outcome scores for 2015-15 with 2017-18, there was only an increase of 12 percent. On the other hand, Dadra and Nagar Haveli, while starting low, climbed up with an improvement in four out of five Health Outcome indicators. Andaman and Nicobar Islands, as well as Lakshadweep islands exhibited the case of ‘Risk’states in Health Outcomes, similar to their status at the level of the overall Health Index. Both territories saw a deterioration in at least three key outcomes, thereby pulling down their overall scores. As of 2018, Andaman and Nicobar Islands and Lakshadweep have been ranked 58[24]and 62,[25]respectively, on the Sustainable Development Index. The NITI Aayog plans to implement a transformation plan for the islands, including giving focus to improving the Human development index and the Sustainable development index.[26]Puducherry, Delhi and Chandigarh continued to show a slowly increasing trend in the Health Outcome Index.
(Author’s own. Data Source[g]: NITI Aayog Health Index 2015-16, NITI Aayog Health Index 2017-18)
1.1 Key Outcomes
Within the Health Outcomes, the Key Outcomes have the highest weightage and therefore, drive the Health Outcome Index as well as the Overall Health Index for each state. (The data for the Key Outcomes is only available for Larger states in the NITI Aayog report, except for ‘Proportion of Low Birth Weight (LBW) among Newborns’ index.)
1.1.1 Neonatal Mortality Rate (NMR)
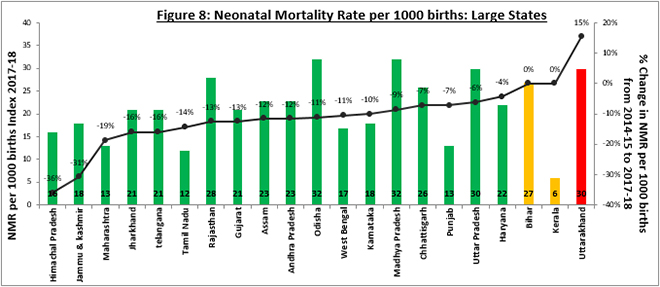
One of the most important indicators of child health, the Neonatal Mortality rate, measures the number of infant deaths in less than 29 days per thousand live births during a specific year. Deaths occurring during this period is of great concern because it reflects the availability and quality of the prenatal, intrapartum, and neonatal care services. At present, India has the highest number of neonatal deaths in the world. In 2017, almost 25 percent[27]of global neonatal deaths occurred in India. Over 60 percent[28]of India’s under-5 deaths occur during the neonatal period. Only Kerala and Tamil Nadu have achieved the SDG30 target for NMR 12 per 1000 live births; Punjab is close. Out of 640 districts in India, only 56 (nine percent) have achieved the SDG30 goal, while 315 districts (52 percent) are not likely to achieve the target.[29]
Odisha, Uttar Pradesh, and Uttarakhand had the highest NMR of 32, 30, and 30, respectively. While Odisha and Uttar Pradesh saw a declining trend in the NMR, Uttarakhand saw an increase in neonatal deaths per 1000 at an alarming rate of 15 percent from 2014-15 to 2017-18. According to the NFHS 4 Uttarakhand report, only 31 percent[30]of pregnant women received at least four antenatal care visits for their last birth, a number that saw an increase with higher literacy of the women. Furthermore, only 69 percent of children born in Uttarakhand in the past five years were born in a health facility.[31]While the government has launched schemes such as Janani-Shishu Suraksha Karyakaram (JSSK, June 2011)[32]and Mother and Child Tracking (MCTs, December 2019)[33]to promote antenatal care, neonatal and infant care, there has been an increase in the NMR, exhibiting the lack of quality care and focus.
(Author’s own. Data Source: NITI Aayog Health Index 2015-16, NITI Aayog Health Index 2017-18)
1.1.2 Under-5 Mortality Rate (U5MR)
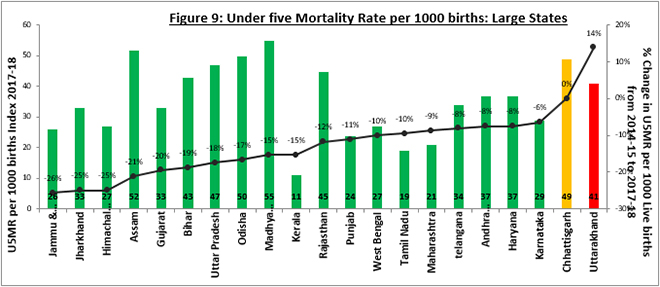
The U5MR is a key indicator of child survival that reflects a range of health and non-health factors, including nutritional status of women and children, maternal education, and availability of basic public health interventions like immunisation. According to 2017 estimates by the World Health Organization, India had the highest Under-5 Mortality Rate (39.4 per 1000 live births[34]) in the world and contributed to 18 percent of the world’s Under 5 Mortality that year.[35]
NITI Aayog’s report found that the States with the highest U5MR were Madhya Pradesh, Assam and Orissa (See Figure 9). While these states have seen progress in terms of reducing the U5MR over the years, they still have a long road ahead. Research has found that Madhya Pradesh has the highest number of districts (58 percent) that are not likely to achieve the SDG30 target for U5MR (25 per 1000 live births), whereas most of the districts in Odisha and Assam are likely to do so.[36]The analysis further indicates that discrimination against girl children in behavioural factors such as nutrition and healthcare in their early years of life, may be leading to higher U5MR levels across the states.
While most states have seen progress in their efforts to bring down U5MR, Uttarakhand poses a serious problem for the country due to the high levels of both NMR and U5MR. The U5MR saw an increase of 14 percent from 2014-15 to 2017-18. Inadequate vaccination and micronutrient deficiency have been major contributors to child morbidity and mortality in India. According to NFHS 4, only 58 percent of children in Uttarakhand received basic vaccination and more than one-fourth of the children were found to be suffering from acute and chronic malnutrition.[37]
(Author’s own. Data Source: NITI Aayog Health Index 2015-16, NITI Aayog Health Index 2017-18)
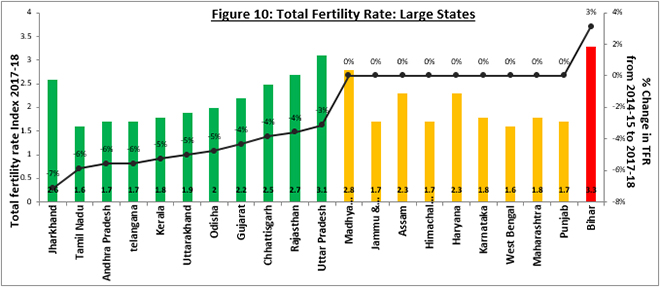
1.1.3 Total Fertility Rate (TFR)
According to the NITI Aayog report, most of India’s EAG states such as Uttar Pradesh, Jharkhand, Madhya Pradesh and Bihar recorded a high fertility rate in 2017-18, higher than the India average of 2.2.[38]Low fertility is achievable through gains in human development, improved health, higher levels of education and decreased fertility; factors that have seen slow progress in the EAG states. These states also saw higher levels of “unwanted fertility”; as access to contraception increases, unwanted fertility will drop, thereby reducing the total fertility rate. While all EAG states showed high levels of fertility, there was also incremental progress in most cases, except Bihar.
Bihar saw a rise in the fertility levels by three percent, reaching 3.3, the highest in India. The high rate of fertility can be broadly attributed to low women education level, lack of contraception, and low-income levels. Only 12 percent of the women in age group 15-49 have completed 12 or more years of schooling. Bihar has also seen a higher number of unplanned pregnancies; as per NFHS 4, if women in Bihar were to only have the number of children they wanted, the total fertility rate in Bihar would be 2.5 children per woman, instead of the current 3.4.[39]
(Author’s own. Data Source: NITI Aayog Health Index 2015-16, NITI Aayog Health Index 2017-18)
1.1.4 Proportion of Low Birth Weight (LBW) among Newborns
Low Birth Weight is used to describe newborns weighing less than 2,500 grams, resulting from either preterm birth or of restricted fetal growth. LBW is associated with fetal and neonatal deaths and illnesses, and long-term consequences such as impaired cognitive development and chronic diseases later in life. In India, for 78 percent of births, a written record of birth weight was available or the mother was able to recall the birth weight, out of which, 18 percent of the infants had a low birth weight of less than 2500 grams.[40]Low birth weight saw a decrease with an increase in the mother’s schooling and household wealth status. Only 15 percent of births to mothers having 12 or more years of schooling had a low birth weight, compared with 20 percent of births to mothers having no schooling.[41]Similarly, 15 percent of births to mothers in households in the highest wealth quintile have a low birth weight, compared with 20 percent of births to mothers in the lowest wealth quintile households.[42]
A caveat is in order: While calculating the index in the NITI Aayog report, the denominator used may be inappropriate. For example, in measuring low birth weight, the denominator is the number of babies weighed instead of all live births, leading to inconspicuous index scores. The system’s low efficiency in terms of quality and higher inequity in access are bound to misconstrue the Low Birth Weight among babies.[43]
(This data is available for all States and UTs.)
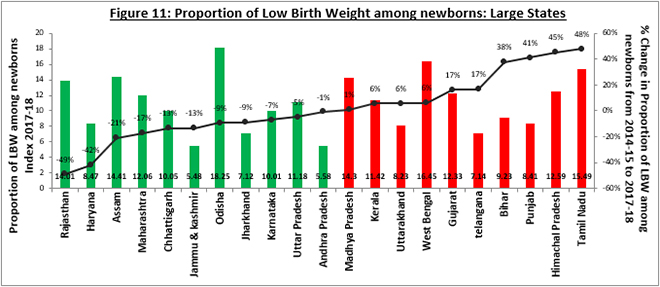
Larger States
Nearly half (48 percent) of the larger states saw a deteriorating trend in the Low Birth Weight. Odisha saw the highest proportion of newborns with LBW (18.25), followed by West Bengal (16.45) and Tamil Nadu (15.49). Between 2014-15 and 2017-18, Tamil Nadu saw a rise in the proportion of newborns with LBW by almost 50 percent, raising a red flag regarding the status of prenatal and antenatal care in the state. In a research[44]conducted in rural areas of Tamil Nadu, it was found that women below the age of 19, illiterate women, women belonging to low socio-economic classes, and women with inter-pregnancy level of less than two years, had the highest association with LBW. With the second highest proportion of Low Birth Weights among newborns, West Bengal saw a further rise in the indicator, prompting a need for an immediate remedy. Women in both West Bengal[45]and Tamil Nadu,[46]saw high levels of severe anaemia (49 percent and 40 percent, respectively) as well as low levels of literacy in the age 15-49 (71 percent and 79 percent, respectively). On the other hand, Rajasthan and Haryana saw large improvement, with over 40 percent decline in the proportion of LBW newborns. Rajasthan and Haryana attributed this decline to measures such as early registration of pregnancies, early detection and management of high-risk pregnancies, and regular monitoring of data.[47]
(Author’s own. Data Source: NITI Aayog Health Index 2015-16, NITI Aayog Health Index 2017-18)
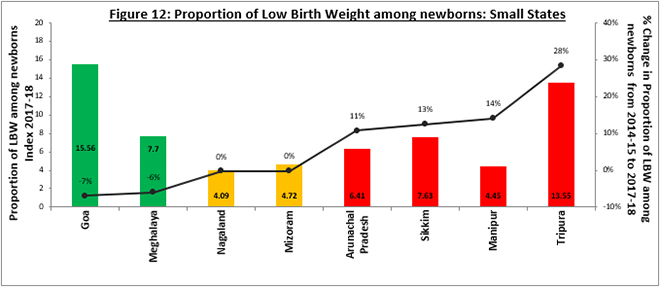
Smaller States
Four out of the eight small states saw a downward trend in the Low Birth Weight. Almost all northeastern states saw a higher proportion of LBW, with Tripura and Manipur showing a disturbing trend of rise in proportion of newborns with LBW. In the last few years, there has been a spike in the focus on development of northeastern region of India. The National Rural Health Mission (NRHM) was launched with the aim of providing effective healthcare to rural populations throughout India with special emphasis on 18 states, including all the eight northeastern states.[48]Even as significant achievements have been made under the NRHM, there is a lot to be done in the northeastern states, where large-scale rural-urban variations exist, such as in access to healthcare services.
(Author’s own. Data Source: NITI Aayog Health Index 2015-16, NITI Aayog Health Index 2017-18)
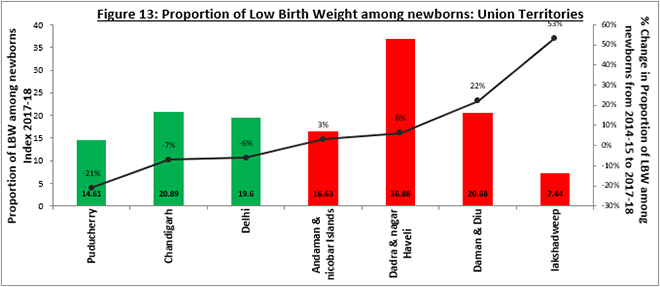
Union Territories
Dadra and Nagar Haveli had the highest proportion of LBW newborns amongst the UTs, whereas Lakshadweep saw a steep rise in the proportion of LBW newborns. Possible reasons for high LBW in Dadra and Nagar Haveli could be the higher number of cases of sickle cell anaemia,[49]a genetic disorder causing serious infections, chronic anaemia, and damage to body organs. As per the NFHS-4, 67.9 percent[50]of pregnant women (aged 15-49) were anaemic, while only 33 percent[51]of mothers received full antenatal care during their pregnancy. Meanwhile, Lakshadweep, due to a lack of facilities and doctors owing to the UT’s geographic isolation caused by difficulties in transportation and communication, has seen slow developments in health services.
(Author’s own. Data Source: NITI Aayog Health Index 2015-16, NITI Aayog Health Index 2017-18)
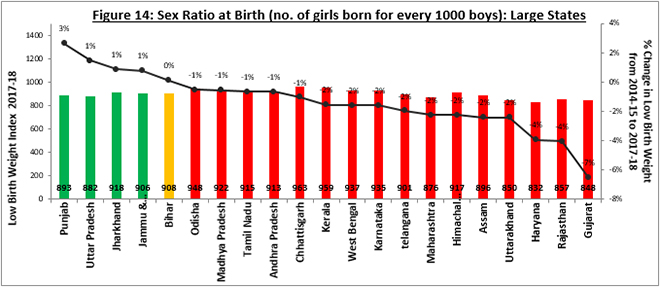
1.1.5 Sex Ratio at Birth (SRB)
Sex Ratio at Birth (SRB) measures the number of girls born for every 1,000 boys born. It reflects the extent to which gender discrimination leads to sex-selective abortion. As per the NITI Aayog Health Index report, the sex ratio at birth has been declining for 76 percent of the states from 2014-15 to 2017-18. Uttar Pradesh, Punjab, Jharkhand and Jammu & Kashmir have shown slow growth, and all other states have declined in performance. One of the root causes for the skewed sex ratio is a strong traditional preference for sons; women have a low status and are considered a financial burden in highly patriarchal cultures.[52]While the government has launched several initiatives to address these regressive norms, the latest of which is the ‘Beti Bachao, Beti Padhao’Initiative,[53]they have met with little success. Sex-selective abortions and excessive post-natal female mortality are still observed in different regions, mostly in the northwestern and northern parts of India.[54]Prenatal sex selection has accelerated the change in sex ratio along with excess female mortality; large-scale post-natal neglect of unwanted girls, leading to death, continues to contribute to the female deficit. The impact of excess female mortality remains considerable and is equivalent to the impact of prenatal sex selection.[55]The annual economic survey of India published in January 2018 estimates the number of unwanted girls in India to be 21 million.[56]
Gujarat, Rajasthan, and Haryana had the lowest decline in the sex ratio (basis figure 14) of seven percent, four percent, and four percent, respectively. South Indian states such as Tamil Nadu, Andhra Pradesh and Karnataka, historically better performers in terms of SRB, also witnessed a worsening pattern.
(Author’s own. Data Source: NITI Aayog Health Index 2015-16, NITI Aayog Health Index 2017-18)
1.2 Intermediate Outcomes
The second part of Health Outcomes focuses on measures such as Immunisation and TB notification and success rate. While the intermediate outcomes are not weighed as highly as the key outcomes in the calculation of the report, they are equally important since they reflect the level of basic healthcare available to people.
1.2.1 Immunisation Coverage
Full coverage has been the aim of India’s successive immunisation programmes, given that it is one of the most cost-effective interventions to reduce preventable child mortality. An infant is fully immunised if they have received BCG (Bacillus Calmette–Guérin vaccine), three doses of DPT (Diphtheria, Pertussis, and Tetanus), three doses of Oral Polio vaccine, and measles.
For larger states, 62 percent of them saw an incremental increase in Immunisation Coverage from 2014-15 to 2017-18. Jharkhand saw the highest incremental gain and reached 100 percent in 2017-18. Apart from Jharkhand, Kerala and Jammu & Kashmir also reached 100 percent. On the other hand, Odisha and Himachal Pradesh, with the lowest Immunisation scores, saw an alarming decline of 32 percent and 16 percent, respectively, from 2014-15 to 2017-18. West Bengal and Telangana, while having immunisation levels of 96 percent and 90 percent, respectively in 2017-18, saw a fall from 100 percent in 2014-15.
More than half (63 percent) of the smaller states and 71 percent of the UTs saw a decline in immunisation levels. Manipur led the smaller states with 99.9 percent immunisation, whereas Mizoram and Meghalaya lagged behind with nine percent and 20 percent, respectively. Delhi, with 99.8 percent immunisation, led the UTs while Lakshadweep and Daman and Diu saw a disturbing fall of 23 percent and 38 percent in immunisation coverage.
1.2.2 Proportion of institutional deliveries
In developing countries like India, home delivery is a strong predictor of infant and maternal deaths. Therefore, the percentage of deliveries in public or private healthcare facilities is amongst the most crucial indicators that need to be closely monitored.
Andhra Pradesh and Telangana led the larger states with a remarkable rise of 62 percent and 55 percent, whereas Odisha, Kerala and Tamil Nadu saw a drop of five percent, five percent, and six percent, respectively. Overall, only 29 percent of the larger states saw a decline in the proportion of institutional deliveries. On the other hand, 50 percent of the smaller states and 57 percent of the UTs saw a declining trend in proportion of Institutional deliveries. Tripura and Arunachal Pradesh saw a positive trend amongst the smaller states, while only Delhi saw an increasing trend amongst the UTs. As in the case of immunisation, Lakshadweep and Daman and Diu saw a disturbing fall of 15 percent and 37 percent in immunisation coverage, with Daman and Diu finishing last amongst all the states and UTs, at an immunisation coverage of a meagre 47 percent.
1.2.3 Total Case Notification rate of Tuberculosis (TB)
India has the highest disease burden of tuberculosis (TB) globally, with 26 percent[57]of all the worldwide TB cases attributed to India. Total case notification rate is defined as the number of new and relapsed TB cases notified in both public and private facilities per 1,00,000 population in a specific year. It reflects the progress—or lack of it—in detecting and reporting TB cases.
While Kerala had the lowest TB notification rate (possibly due to lower number of cases), Orissa saw an impressive improvement in the TB notification rate (50 percent) from 2014-15 to 2017-18. Haryana, Telangana and Assam showed a decreasing trend in the TB case notification rate, hinting at an urgent need of improving their TB management infrastructure. While 50 percent of the smaller states saw a fall in the TB notification rate, only one UT saw a fall from 2014-15 to 2017-18. Tripura saw an alarming fall of 77 percent (down to 44 case notifications in 2017-18 from 195 in 2014-15) and Andaman and Nicobar Islands saw a fall of 52 percent (down to 76 case notifications in 2017-18 from 157 in 2014-15). Difficulty in access to healthcare due to distant location with less transport and communication could be the possible reasons for this trend.
1.2.4 Treatment success rate of new microbiologically confirmed Tuberculosis cases
The treatment success rate of new microbiologically confirmed TB cases is the proportion of new microbiologically confirmed cases that have successfully completed treatment against the total number of new microbiologically confirmed TB cases registered in a given period. The Government of India established a target of ≥ 85 percent success rate for TB treatment.
Jharkhand saw the highest levels of TB Treatment success rate at 92 percent. Half (57 percent) of the larger states were below the government established target of 85 percent and 81 percent of the larger states saw a decline since 2014-15. Uttar Pradesh saw the lowest scores and the highest incremental fall since 2014-15. On the other hand, all smaller states saw an incremental fall since 2014-15, and only Goa had a TB success rate of more than 85 percent. Arunachal Pradesh and Nagaland also experienced incremental fall in the TB success rate. Most UTs were above the government target of TB success rate, with Daman and Diu and Lakshadweep leading the group.
1.2.5 Proportion of People Living with HIV (PLHIV) on Antiretroviral Therapy (ART)
Data for this indicator was only available for the Larger and Smaller States, and not for UTs. Due to the change in the program guidelines related to treatment, the data for 2017-18 is not comparable to the 2014-15 or 2015-16 data. The National Health Policy 2017 set a specific goal to ensure that 90 percent of all people tested positive for HIV receive sustained ART by 2020. Out of 29 States, three (Jammu & Kashmir, Meghalaya and Mizoram) have achieved this target while five have 80 to 90 percent of PLHIV on ART in the 2015-16 (when compared to 2014-15). Eight states have less than 50 percent of the PLHIV on ART (in 2015-16 when compared to 2014-15), namely Bihar, Jharkhand, Odisha, Rajasthan, West Bengal, Arunachal Pradesh, Sikkim, and Tripura. Significant improvements are needed to achieve 90 percent coverage.[58]
2. Governance and Information: Analysis
While difficult to achieve, good governance in a health system promotes efficient decision-making and effective implementation. It is measured by how institutions conduct public affairs, manage resources, and respond to the citizens’ needs. The Governance and Information domain in the NITI Aayog Health Index covers indicators such as data integrity and average occupancy on a district and state level.
2.1.1 Data Integrity Measure: (a) Institutional Deliveries; (b) ANC registered within the First Trimester
‘Digital health’ is now considered highly relevant to the future of healthcare. The delivery of quality healthcare relies not only on the accurate input of data, but also on the ability to access and derive meaning from such data to generate evidence, inform decision-making and improve health outcomes. This indicator captures the percentage deviation of HMIS (Health Management Information System) reported data from the NFHS-4 (National Family Health survey 4) data in order to assess the quality and integrity of reported data. Specifically, data from HMIS for the last five years (2011-12 to 2015-16) on the proportion of institutional deliveries and ANC registered within the first trimester is compared with NFHS-4 (2015-16).
The NITI Aayog report found high discrepancies in Institutional Deliveries in Uttar Pradesh, Andhra Pradesh, and Madhya Pradesh. Similarly, for smaller states and UTs, Nagaland, Puducherry and Chandigarh saw high disparity, hinting at inaccuracy of health records. In case of ANC registered within first trimester, Jharkhand and West Bengal had steep deviation in larger states, while Puducherry and Nagaland saw high deviation from NFHS data amongst smaller states and UTs. Overall, in terms of data integrity for both institutional deliveries and ANC registrations, Gujarat and Maharashtra were high performers with very little deviation in data.
2.2.1 Average Occupancy of an Officer (in months), for three key posts at State level for last three years
A stable tenure for key administrative positions is critical to ensure the effectiveness and sustainability of public health programmes. Based on the data from States from 2014-15 to 2017-18, the average occupancy of Principal Secretary, Mission Director (NHM), and Director (Health Services) or equivalent positions was highest in West Bengal (28 months), and lowest in Nagaland (5.8 months). Out of the 36 States and UTs, 56 percent had an average occupancy of 12 months or more per officer. From 2014-15 to 2017-18, among the Larger States, Tamil Nadu, Assam, Madhya Pradesh, and Telangana reported significant increases of about eight months or more in the average occupancy per officer. However, large declines of over six months were observed in some of the States such as Punjab, and Uttar Pradesh. Among the Smaller States and UTs, Goa, Manipur, Meghalaya, Lakshadweep and Daman and Diu reported significant decreases above six months in the average occupancy.
2.2.2 Average occupancy of a District Chief Medical Officer (CMO) or equivalent post (heading District Health Services full-time) (in months) in last three years
Short average occupancy of district CMO hinders effective implementation of key public health programmes. Out of the 36 States and UTs, a staggering 78 percent had an average occupancy of 12 months or more for CMOs (or equivalent). Tamil Nadu, Punjab, Chandigarh, Andhra Pradesh, Jharkhand, Uttarakhand and Uttar Pradesh were the only states with average occupancy of less than 12 months. On the other hand, States such as Chhattisgarh, Arunachal Pradesh, Daman & Diu, Puducherry and Sikkim reported an average occupancy of more than 18 months, with a declining trend across the time periods covered in the report.
3. Key Processes and Inputs: Analysis
The aspect of ‘Key inputs and processes’ focuses on areas such as healthcare quality, accessibility and availability, as well as the lack of qualified health personnel. While the key processes are not as highly scored while calculating the index, they are just as vital for the healthcare system to work since they directly impact the key outcomes.
Larger States
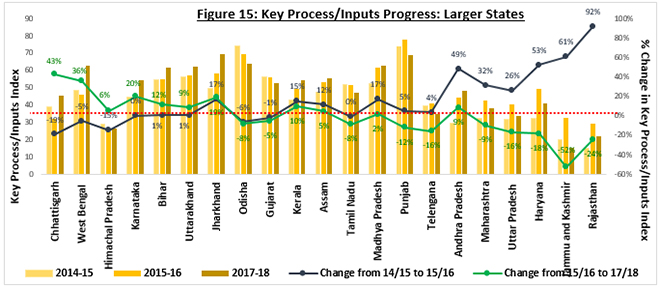
Seven out of 21 larger states (33 percent) saw a fall in the Key Processes index from 2015-16 to 2017-18. In absolute terms, the highest performing states were Andhra Pradesh, Tamil Nadu and Kerala, while the least performing states were Bihar, Jharkhand and Uttar Pradesh. In terms of growth, Chhattisgarh, Jharkhand and Andhra Pradesh saw the highest growth of 62 percent, 46 percent, and 40 percent, respectively from 2015-16 to 2017-18. While most of the EAG states lagged behind in terms of absolute value, there was considerable rise in the performance of five out of the eight EAG states.
While Chhattisgarh and Andhra Pradesh saw a positive trend across both the terms, Jharkhand saw a fall of 24 percent from 2015-16 to 2017-18 but overall, recorded a rise from 2015-15 to 2015-16. On the other hand, Haryana, Jammu & Kashmir, and Rajasthan saw a steep decline in the Key Processes. Figure 15 depicts the increase by Haryana, Jammu & Kashmir, and Rajasthan in the first term (2014-15 to 2015-16) and the sharp drop in the same indicators in the second term (2015-16 to 2017-18).
(Author’s own. Data Source[h]: NITI Aayog Health Index 2015-16, NITI Aayog Health Index 2017-18)
During the second period of the NITI Aayog Health Index (2015-16 to 2017-18), Rajasthan saw a decline in the number of functional PHCs and functional Cardiac Care Units (CCUs), along with increased vacancies of auxiliary nurses at Sub-Centre (SC) and staff nurses at PHCs; Jammu & Kashmir experienced a drop in the number of functional PHCs and an increase in the vacancies of specialists at district hospitals; and Haryana saw a decrease in Integrated Disease Surveillance Program (IDSP) reporting of P & L forms along with lower number of functional PHCs, leading to an overall decline in the Key Processes Index. All three states saw a decrease in the proportion of functional PHCs, increasing the burden on secondary and tertiary healthcare facilities.
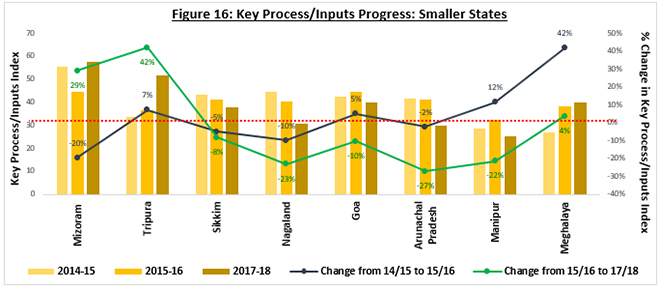
Smaller States
Figure 16 shows the progress of the smaller states on the overall health outcome index. In the second term of the Health Index (2015-16 to 2017-18), 63 percent of the states saw a fall in the Key Processes index. Tripura fared best, as seen in the growth of the index from 2015-16 to 2017-18, though in absolute terms, Mizoram saw the highest value, with an increase of four percent from the first term (2014-15 to 2015-16). Both Mizoram and Tripura witnessed an increase in functional first referral units (FRUs), along with reduced vacancies of medical officers at PHCs, possibly reducing patient load in hospitals along with providing preventive care.
One of the worst performers amongst the smaller states was Arunachal Pradesh, which suffered a fall of 27 percent in the second term and two percent in the first term of the index. Manipur also saw a diminishing performance in the Key Processes Index with a rise of 12 percent in the first term but a fall of 22 percent in the second term. Both the states saw a decline in the number of functional PHCs and first-trimester ANCs. Furthermore, there was a delay of more than 100 days in the transfer of Central NHM funds from state to implementation agencies.
(Author’s own. Data Source[i]: NITI Aayog Health Index 2015-16, NITI Aayog Health Index 2017-18)
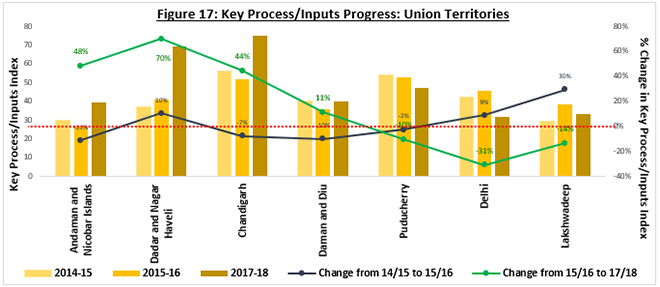
Union Territories
Andaman and Nicobar Islands, and Dadra and Nagar Haveli saw a remarkable rise in the Key Processes index form 2015-16 to 2017-18. While both territories were performing well, there was a fall in the number of functional PHCs, which can impact the healthcare system in the future. Delhi and Puducherry exhibited the case of ‘Risk’states in Key Processes; both territories saw a deterioration in Key Processes in 2015-16 to 2017-18, even though there was a positive growth in 2014-15 to 2015-16. There was decline in 63 percent of the Key Processes indicators for Delhi, while 38 percent of the indicators for Puducherry fell from 2015-16 to 2017-18. The fall in Delhi’s index was attributed to an increase in the vacancies of medical officers and staff nurses at PHCs, coupled with increasing non-functional PHCs and CCUs.
(Author’s own. Data Source[j]: NITI Aayog Health Index 2015-16, NITI Aayog Health Index 2017-18)
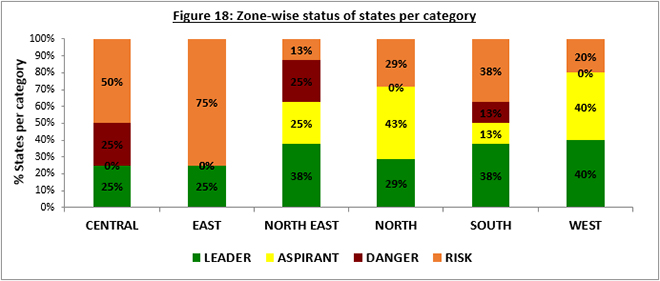
IV. An Analysis of India’s Zones
While India has made substantial progress in delivering health outcomes in recent years, further progress is imperative for the country to reach its targets. This report further breaks down NITI Aayog’s findings according to zones.[k]
The North Zone (which covers Chandigarh, Delhi, Haryana, Himachal Pradesh, Jammu & Kashmir, Punjab and Rajasthan) has seen a positive trend, overall: 72 percent of the States/UTs saw an increasing trend in the health index. Less than a third (29 percent) of the States/UTs were ‘Leaders’while 43 percent were ‘Aspirants’. The North zone witnessed a broadly positive trend in Neonatal Mortality Rate, Under-5 Mortality Rate and TB Notification Rate, but at the same time, there was a decline in the functional first referral units and primary healthcare units. Moreover, there was increased vacancy of auxiliary nurses, staff nurses and medical officers, and this lack of personnel handicapped the system.
The South Zone (Andhra Pradesh, Karnataka, Kerala, Puducherry, Tamil Nadu and Telangana along with Andaman & Nicobar Islands, along with Lakshadweep) saw a mixed trend over the period 2014-15 to 2017-18: 38 percent of the States/UTs were categorised as ‘Leaders’, while 38 percent were in the ‘Risk’ category. In the South zone, measures of health personnel availability saw a positive trend but lesser primary healthcare units were functional. States such as Kerala and Tamil Nadu—which already have relatively stronger healthcare systems compared to the rest of the country—did not witness any incremental gain but were able to stand their ground. NITI Aayog found a decreasing sex ratio at birth in this region; higher levels of literacy and better availability of technology for sex determination may have led to increased sex selective abortions, as explored at length in ‘Disappearing Daughters: The Tragedy of Female Feticide’ by Gita Aravamudan.[59]
The Central Zone (including Chhattisgarh, Uttar Pradesh, Madhya Pradesh and Uttarakhand) mainly consists of EAG (Empower Action Group) states and therefore, was mostly in the ‘Risk’category. Except for Chhattisgarh, where a positive trend was seen across both the terms of the report, the three other states saw a deteriorating trend in both health outcomes and key processes. There was a staggering decline in TB treatment success rate and an increased incidence of births with low birth weight. Coupled with increased vacancies of staff nurses and medical officers, as well as lower proportion of women receiving antenatal care, all these factors led to the overall deterioration in the zone.
The North-Eastern Zone (comprising Assam, Arunachal Pradesh, Manipur, Meghalaya, Mizoram, Nagaland, Sikkim and Tripura) also saw a positive trend in the health systems with 63 percent of the States showing an accelerating trend. – with three out of eight states in the ‘Leader’ category. There was a decline in immunisation, as well as TB notification and treatment success rates. While the North-Eastern area shows a healthy population of healthcare personnel, there was a lack in the number of functional primary health care units that will likely lead to limited access to healthcare and, consequently, worsening of the overall performance in health.
The Eastern states (Bihar, Jharkhand, Orissa and West Bengal) are all EAG areas with historically stunted healthcare systems. While Jharkhand was one of the ‘Leader’category and saw impressive growth in most health indicators, owing to an inherently low absolute index, it remained amongst the lower ranked states. Bihar, Orissa and West Bengal were all under the ‘Risk’ category, specifically due to the poor performance on Health Outcomes (i.e., sex ratio, institutional deliveries, and TB treatment success rate). Performance on Key Outcomes was stagnant in these states, and there was a decline in the number of functional primary healthcare units.
Lastly, the Western states (comprising of Maharashtra, Goa and Gujarat and UTs Dadra and Nagar Haveli, and Daman and Diu) saw the highest number of states in the ‘Leader’category. Combined with the ‘Aspirants’, 80 percent of the western states saw a rising trend in the health index. While the western states witnessed an overall positive trend, a closer examination revealed poor performance in neonatal measures like low birth weight, sex ratio at birth, and proportion of institutional deliveries. Health infrastructure measures saw an encouraging trend except for the prevalence of non-functional primary healthcare units.
V. Conclusion
Access to healthcare in India varies across geographical and income differentials, often sharply. Therefore, each region’s unique context determines to a large extent the potential for success of any intervention that aims to improve the various aspects of healthcare. A deeper understanding of the ground challenges is essential to ensure efficient and effective delivery of health services, especially in areas where rapid service delivery is crucial.
While India has made substantial progress in delivering sustainable health outcomes in recent years, these achievements are inadequate if the country were to aim to achieve the Sustainable Development Goals (SDGs) in health. There is a growing acknowledgment by public authorities and governments across India that there are tremendous challenges in healthcare. At the same time, there is greater willingness on the part of authorities to invest substantial human and financial resources in improving the quality of healthcare. In a country as big and diverse as India, it is essential to identify contextualised best models of public health, before more resources are invested to achieve the goals of SDG 3 (Good Health). It is possible to make healthcare affordable and accessible if policymakers make a collaborative effort. In addition to formulating measures to address existing issues, it is important to implement them in a holistic way.
Although there is a diverse trend across regions and health measures, there are certain similarities in their shortcomings. The functional primary health care units have seen a declining trend on an all-India level. Almost 60 percent of the states saw a decline in the functional PHUs, whereas states that saw a higher number of PHUs were performing well on most indicators. This shows the impact of easily accessible healthcare units. With the emergence of non-communicable diseases, preventive healthcare has become more important than ever due to the highly efficient and effective model that has multiple benefits ranging from early diagnosis and reduced liability on the poor, to lower burden on secondary and tertiary healthcare providers. Efficient primary healthcare infrastructure mitigates current health risks as well as improves the handling of future healthcare challenges.
The NITI Aayog report has helped provide a better understanding of the dynamics of the multifaceted health sector. It should serve as a catalyst for reforms in the different states to improve health and, consequently, help achieve larger development goals.
Appendix
• Appendix 1
The table below explains the domain-wise indicators, which have been chosen by NITI Aayog for analysis. The data sources and technical definitions of each indicator are also given.
Indicator
Definition
Data Source
Remarks
DOMAIN 1 – HEALTH OUTCOMES
SUB-DOMAIN 1.1 – KEY OUTCOMES (Weight – Larger States – 500, Smaller States & UTs – 100)
1.1.1
Neonatal Mortality Rate (NMR)
Number of infant deaths of less than 29 days per thousand live births during a specific year.
Sample Registration System [Pre-filled]
Indicators 1.1.1, 1.1.2, 1.1.3, and 1.1.5 are not applicable for category of Smaller States and UTs
1.1.2
Under-five Mortality Rate (U5MR)
Number of child deaths of less than 5 years per thousand live births during a specific year.
Sample Registration System [Pre-filled]
1.1.3
Total Fertility Rate (TFR)
Average number of children that would be born to a woman if she experiences the current fertility pattern throughout her reproductive span (15-49 years), during a specific year.
Sample Registration System [Pre-filled]
1.1.4
Proportion of Low Birth Weight among newborns (LBW among births)
Proportion of low birth weight (<=2.5 kg) newborns out of the total number of newborns weighed during a specific year born in a public health facility.
Health Management Information Systems (HMIS)
1.1.5
Sex Ratio at Birth (SRB)
The number of girls born for every 1,000 boys born during a specific year.
Proportion of infants 9-11 months old who have received BCG, 3 doses of DPT, 3 doses of OPV and one dose of measles against estimated number of infants during a specific year.
HMIS
1.2.2
Proportion of institutional deliveries
Proportion of deliveries conducted in public and private health facilities against the number of estimated deliveries during a specific year.
HMIS
1.2.3
Total Case Notification Rate of TB
Number of new and relapsed TB cases notified (public + private) per 100,000 population during a specific year.
Revised National Tuberculosis Control Programme (RNTCP) MIS, MoHFW (prefilled)
1.2.4
Treatment success rate of new microbiologically confirmed tuberculosis (TB) cases
Proportion of new cured and their treatment completed against the total number of new microbiologically confirmed tuberculosis cases registered during a specific year.
RNTCP MIS, MoHFW (prefilled)
1.2.5
Proportion of people living with HIV (PLHIV) on antiretroviral therapy (ART)
Proportion of PLHIVs receiving ART treatment against the number of estimated PLHIVs who needed ART treatment for the specific year
Central MoHFW Data (prefilled)
Indicator not applicable for category of UTs.
1.2.6
Out of pocket expenditure per delivery in public health facility (in INR).
Average out of pocket expenditure per delivery in public health facility (in Rupees).
NFHS – 4 (prefilled)
Indicator applicable only for 2017-18 Not considered for incremental ranking.
DOMAIN 2 – GOVERNANCE AND INFORMATION
SUB-DOMAIN 2.1 – HEALTH MONITORING AND DATA INTEGRITY (Weight: 70)
2.1.1
Data Integrity Measure: a. Institutional deliveries b. ANC registered within first trimester
Percentage deviation of reported data from standard survey data to assess the quality/integrity of reported data for a specific period.
HMIS and NFHS-4
The NFHS data were available only for 2017-18 and the data was repeated for the Base Year and Reference Year.
SUB-DOMAIN 2.2 – GOVERNANCE (Weight – 60)
2.2.1
Average occupancy of an officer (in months), combined for following three posts at State level for last three years 1. Principal Secretary 2. Mission Director (NHM) 3. Director- Health Services
Average occupancy of an officer (in months), combined for following posts in last three years:
1. Principal Secretary 2. Mission Director (NHM) 3. Director- Health Services
State report
2.2.2
Average occupancy of a full-time officer (in months) in last three years for all Districts- District Chief Medical Officers (CMOs) or equivalent post (Heading District Health Services)
Average occupancy (in months) of a CMO in last three years for all the Districts
State report
DOMAIN 3 – KEY INPUTS / PROCESSES
SUB DOMAIN 3.1 – HEALTH SYSTEMS / SERVICE DELIVERY (Weight – 200)
3.1.1
Proportion of vacant health care provider positions (Regular + Contractual) in public health facilities
Vacant healthcare provider positions in public health facilities against total sanctioned health care provider positions for following cadres (Separately for each cadre) during a specific year: a. ANMs at Sub-Centres (SCs) b. Staff nurse at Primary Health Centres and Community Health Centres (PHCs & CHCs) c. MOs at PHCs d. Specialists at DH (Medicine, Surgery, Obstetric and Gynae, Pediatrics, Anesthesia, Ophthalmology, Radiology, Pathology, ENT, Dental, Psychiatry)
State report
3.1.2
Proportion of total staff (regular + contractual) for whom an e-pay slip can be generated in the IT enabled Human Resource Management Information System (HRMIS).
Availability of a functional IT enabled HRMIS measured by the Proportion of staff (Regular + Contractual) for whom an e-pay slip can be generated in the IT enabled HRMIS against total number of staff (Regular + Contractual) during a specific year.
State Report
3.1.3
a. Proportion of specified type of facilities functioning as First Referral Units (FRUs)
Proportion of public sector facilities conducting specified number of C-sections* per year (FRUs) against the norm of 1 FRU per 500,000 population during a specific year
HMIS
Indicator definition modified
3.1.3
b. Proportion of functional 24×7 PHCs
Proportion of PHCs providing all stipulated healthcare services** round the clock against the norm of one 24×7 PHC per 100,000 population during a specific year
State Report
3.1.4
Proportion of Districts with Functional Cardiac Care Units (CCU)
Proportion of Districts with functional CCU [with desired equipment (ventilator, monitor, defibrillator, CCUs bed, portable ECG machine, pulse oxymeter etc.), drugs, diagnostics and desired staff as per programme guidelines] against total number of districts
State Report
3.1.5
Proportion of ANC registered within first trimester against total registrations
Proportion of pregnant women registered for ANC within 12 weeks of pregnancy during a specific year.
HMIS
3.1.6
Level of registration of births (%)
Proportion of births registered under Civil Registration System (CRS) against the estimated number of births during a specific year.
Civil Registration System (CRS) [Pre-filled]
3.1.7
Completeness of IDSP reporting of P and L form (%)
Proportion of Reporting Units (RU) reporting in stipulated time period against total Reporting Units, for P and L forms during a specific year.
Central IDSP, MoHFW Data [Pre-filled]
3.1.8
Proportion of CHCs with grading above 3 points
Proportion of CHCs that are graded above 3 points against total number of CHCs during a specific year.
HMIS
3.1.9
Proportion of public health facilities with accreditation certificates by a standard quality assurance programme (NQAS /NABH/ISO/AHPI)
Proportion of specified type of public health facilities with accreditation certificates by a standard quality assurance programme against the total number of following specified type of facilities during a specific year. 1. DH-SDH 2. CHC-Block PHC
State Report
3.1.10
Average number of days for transfer of Central NHM fund from State Treasury to implementation agency (Department/Society) based on all tranches of the last financial year
Average time taken (in number of days) by the State Treasury to transfer funds to implementation agencies during a specific year.
Centre NHM Finance Data# [Pre-filled]
• Appendix 2
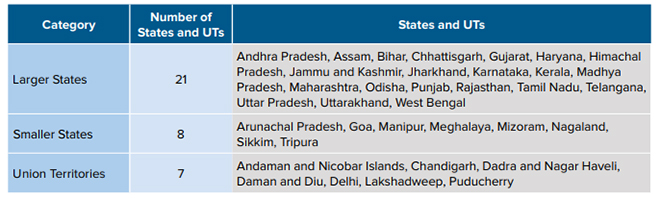
• Appendix 3
For the purpose of analysis on the NITI Aayog ‘Healthy States, Progressive India’, the states were divided into 3 categories
Endnotes
[a]Definition of ‘Aspirants’ States/UTs in the NITI Aayog health Index Report is different and is based on the incremental gain in the health index from 2015-2016 to 2017-18, but this report utilizes a separate definition based on the incremental growth in both the terms of the report
[b]Since Jammu & Kashmir was split into UTs in August 2019 and the NITI report was launched in July 2019, this paper considers Jammu & Kashmir a state in its analysis
[c]‘Key Inputs & Processes’ imply measures such as healthcare quality and availability, staff shortages and birth registration level
[d]EAG States – Empowered Action Group States, with a lag in demographic transition and higher infant mortality rates, include Bihar, Chhattisgarh, Jharkhand, Madhya Pradesh, Rajasthan, Uttarakhand, Uttar Pradesh, and Odisha.
[e]Figure 5 represents the state wise absolute values of the ‘Health Outcomes’ Index along with the growth in the first term (2014-15 to 2015-16) and second term (2015-16 to 2017-18). In the graph, the states have beensortedbasis the difference in the growth rate from the first term to the second term. This shows the positive or negative performance of the states in the second term vis-à-vis the first term.
[f]Figure 6 represents the state wise absolute values of the ‘Health Outcomes’ Index along with the growth in the first term (2014-15 to 2015-16) and second term (2015-16 to 2017-18). In the graph, the states have beensortedbasis the difference in the growth rate from the first term to the second term. This shows the positive or negative performance of the states in the second term vis-à-vis the first term
[g]Figure 7 represents the absolute values of the ‘Health Outcomes’ Index along with the growth in the first term (2014-15 to 2015-16) and second term (2015-16 to 2017-18). In the graph, the UTs have beensortedbasis the difference in the growth rate from the first term to the second term. This shows the positive or negative performance of the UTs in the second term vis-à-vis the first term
[h]Figure 15 represents the state wise absolute values of the ‘Key Processes / Inputs’ Index along with the growth in the first term (2014-15 to 2015-16) and second term (2015-16 to 2017-18). In the graph, the states have beensortedbasis the difference in the growth rate from the first term to the second term. This shows the positive or negative performance of the states in the second term vis-à-vis the first term
[i]Figure 16 represents the state wise absolute values of the ‘Key Processes / Inputs’ Index along with the growth in the first term (2014-15 to 2015-16) and second term (2015-16 to 2017-18). In the graph, the states have beensortedbasis the difference in the growth rate from the first term to the second term. This shows the positive or negative performance of the states in the second term vis-à-vis the first term.
[j]Figure 17 represents the absolute values of the ‘Key Processes / Inputs’ Index along with the growth in the first term (2014-15 to 2015-16) and second term (2015-16 to 2017-18). In the graph, the UTs have beensortedbasis the difference in the growth rate from the first term to the second term. This shows the positive or negative performance of the UTs in the second term vis-à-vis the first term.
[k]Zonal Classification basis the Administrative Divisions of India
North Eastern Council: Assam, Arunachal Pradesh, Manipur, Meghalaya, Mizoram, Nagaland and Tripura and Sikkim
Central Zonal Council: the States of Chhattisgarh, Madhya Pradesh, Uttarakhand and Uttar Pradesh;
Eastern Zonal Council: Bihar, Jharkhand, Odisha, and West Bengal;
Western Zonal Council: Dadra and Nagar Haveli and Daman and Diu, Goa, Gujarat, and Maharashtra;
Southern Zonal Council: Andhra Pradesh, Karnataka, Kerala, Puducherry, Tamil Nadu, and Telangana (Andaman and Nicobar Islands & Lakshadweep are special invitees to the southern zonal council)
[2]United Nations, Department of Economic and Social Affairs, Population Division (2019),World Population Prospects 2019: Highlights, 2019.
[3]Ministry of Statistics and Programme Implementation, Central Statistics office, Government of India,India is Figures, 2018, 2018,
[4]Perianayagam Arokiasamy, The Lancet,India’s escalating burden of non-communicable diseases,October 2018.
[5]Ibid
[6]Business Today,Healthcare allocation in Budget 2020 5.7% lower than last budget,Feb 2020.
[7]Ministry of Health and Family welfare,National Health Policy 2017, 2017.
[8]Business Today,Healthcare allocation in Budget 2020 5.7% lower than last budget,Feb 2020.
[9]Oommen C Kurian, Observer Research Foundation,Does budget 2020 provide material support for the ongoing health reforms?,Feb 2020.
[10]Niti Aayog, Ministry of Health & Family Welfare,Healthy States Progressive India, June 2019.
[11]Naveen, Department of Humanities and Social Sciences, IIT Kharagpur (India),Health infrastructure development: A district wise analysis of Haryana,March 2019.
[12]Ibid
[13] National Health Accounts Cell Ministry of Health & Family Welfare Government of India, Health SectorFinancing By Centre And States/Uts In India [2015-16 To 2017-18].
[14]Directorate of Economics and Statistics, Union Territory, Chandigarh,Statistical Abstract Of Chandigarh – 2018,June 2019.
[15]Ibid
[16]The official website of Chandigarh Administration.
[17]National Health Accounts Cell Ministry of Health & Family Welfare Government of India,Health Sector Financing By Centre And States/Uts In India [2015-16 To 2017-18].
[18]Khan P.K. et al,Primary Healthcare Infrastructure and Reproductive Healthcare in Rural India: A District Level Analysis,September 2019.
[19]Ibid
[20]International Institute for Population Sciences (IIPS) and ICF,National Family Health Survey (NFHS-4), India, 2015-16: Rajasthan,2017.
[21]Central TB Division, Directorate General of Health Services,TB India 2017, March 2017.
[22]International Institute for Population Sciences (IIPS) and ICF,National Family Health Survey (NFHS-4),India,2015-16: Nagaland, March 2018.
[23] Shallini Rudra, Observer Research Foundation,Nagaland has poorest maternal and child healthcare indicators in Northeast India,Feb 2018.
[24]Jitendra Kumar, Niti Aayog,Transforming the Islands through Creativity and Innovation, May 2019.
[25]Ibid
[26]Ibid
[27]Global Health Observatory data repository, WHO,Mortality and Global Health Estimates,Accessed September 2019.
[28]Ibid
[29]Bora JK, Saikia N (2018),Neonatal and under-five mortality rate in Indian districts with reference to Sustainable Development Goal 3: An analysis of the National Family Health Survey of India (NFHS), 2015–2016.
[30]International Institute for Population Sciences (IIPS) and ICF,National Family Health Survey (NFHS-4), India, 2015-16: Uttarakhand. March 2018.
[31]Ibid
[32] Uttarakhand Health and Family Welfare society,Janani Shishu Suraksha Karyakaram (JSSK), Accessed September 2019.
[33]Uttarakhand Health and Family Welfare society,Mother and Child Tracking (MCTs), Accessed September 2019.
[34]UNICEF Data and Analytics,India Country Profile,2017.
[35]Global Health Observatory data repository, WHO,Mortality and Global Health Estimates,Accessed September 2019.
[36]Bora JK, Saikia N (2018),Neonatal and under-five mortality rate in Indian districts with reference to Sustainable Development Goal 3: An analysis of the National Family Health Survey of India (NFHS), 2015–2016.
[37]International Institute for Population Sciences (IIPS) and ICF,National Family Health Survey (NFHS-4), India, 2015-16: Uttarakhand. March 2018.
[38]International Institute for Population Sciences (IIPS) and ICF,National Family Health Survey (NFHS-4), 2015-16: India,December 2017.
[39]International Institute for Population Sciences (IIPS) and ICF,National Family Health Survey (NFHS-4), India, 2015-16: Bihar, September 2017.
[40]International Institute for Population Sciences (IIPS) and ICF,National Family Health Survey (NFHS-4), 2015-16: India,December 2017.
[41]Ibid
[42]Ibid
[43]T Sundararaman, The Times of India,The fault is in the measure: Niti Aayog’s health index is less helpful for state governments, than it should have been,June 2019.
[44]Kandhasamy K, Singh Z,Determinants of low birth weight in a rural area of Tamil Nadu, India: a case– control study, November 2014.
[45]International Institute for Population Sciences (IIPS) and ICF,National Family Health Survey (NFHS-4), India, 2015-16: West Bengal,October 2017.
[46]International Institute for Population Sciences (IIPS) and ICF,National Family Health Survey (NFHS-4), India, 2015-16: Tamil Nadu,December 2017,http://rchiips.org/nfhs/NFHS-4Reports/TamilNadu.pdf
[47]Niti Aayog,Healthy States Progressive India Health Index, June 2019,http://social.niti.gov.in/uploads/sample/health_index_report.pdf
[48]Ministry of Health and Family Welfare, Govt. of India,Activities in North East region,Annual Report 2016-17.
[49]Directorate Medical and Health Service, Dadra and Nagar Haveli,Sickle Cell Anemia Health Program.
[50]International Institute for Population Sciences (IIPS) and ICF,National Family Health Survey (NFHS-4), India, 2015-16, State Fact Sheet: Dadra and Nagar Haveli,Mumbai 2017.
[51]Ibid
[52]Kamlesh Madan, Leiden University Medical Centre,Skewed sex ratio in India, an overview of the present state of affairs, December 2018.
[53]Ministry of Women and Child Development Government of India,Beti Bachao Beti Padhao.
[54]Guilmoto, C.Z., Saikia N., Tamrakar V., & Bora J.K. (2018),Excess under-5 female mortality across India: a spatial analysis using 2011 census data, June 2018.
[55]Bongaarts, J., & Guilmoto, C.Z. (2015),How Many More Missing Women? Excess Female Mortality and Prenatal Sex Selection 1970–2050, June 2015.
[56]Department of Economic Affairs, Government of India,Economic Survey 2017-18 Volume 1: Gender and Son Meta Preference, January 2018.
[57]World Health Organization,Global tuberculosis Report 2018, Geneva 2018.
[58]Niti Aayog,Healthy States, Progressive India Health Index, June 2019.
[59]Anna Isaac,The missing girls of South India: Why drastic drop of sex ratio at birth is unsurprising, January 2019.
The views expressed above belong to the author(s). ORF research and analyses now available on Telegram! Click here to access our curated content — blogs, longforms and interviews.
Kriti Kapur was a Junior Fellow with ORFs Health Initiative in the Sustainable Development programme. Her research focuses on issues pertaining to sustainable development with ...

 PDF Download