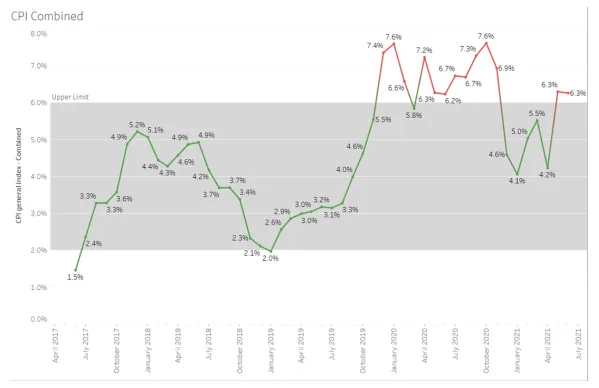
For a second consecutive month the headline inflation rate, CPI (Consumer Price Index-Combined), has been above the 6 percent range of the central bank. The year-on-year percentage change (YoY%) print for June 2021 has marginally eased to 6.26 percent from 6.30 percent in May 2021. This is mainly due to easing off the sequential momentum to 0.6 percent month-on-month (MoM) in June 2021 versus 1.6 percent MoM in May 2021.
This rising inflation has now stirred a debate about whether it is sticky or transient. Policy prescription to tame this curve depends on which side of this debate one takes.
With inflation peaking above the acceptable barometre for the second month, the average CPI inflation in Q1 FY21-22 stands at 5.6 percent. This is above the RBI projection of 5.2 percent in the last Monetary Policy Committee (MPC) meeting. This rising inflation has now stirred a debate about whether it is sticky or transient. Policy prescription to tame this curve depends on which side of this debate one takes. A subterranean analysis of CPI can give us some indication of its nature.
Figure 1: Year on Year % Change in CPI General Index
 Source: MoSPI
Category-wise inflation analysis
-
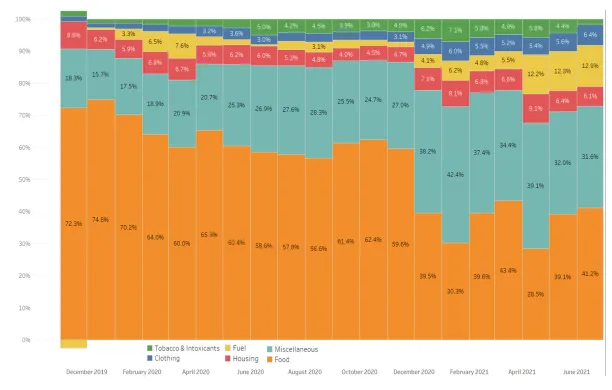
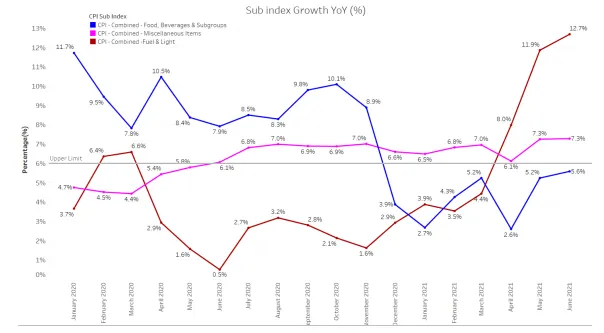
Food and Beverage Index, which has the highest weight of 45.86 percent in CPI, rose to 5.58 percent YoY in June 2021 versus 5.24 percent YoY in May 2021. This uptick was driven mainly by sequential price rise in items like oils and fats, eggs, fruits, and pulses. This rise in food prices contributes to 41 percent of CPI inflation for June 2021.
-
Miscellaneous Items Index, which has a weight of 28.32 percent in CPI, remained flat on a YoY basis. However, the index has been consistently above the 6 percent threshold for the last 12 months. The two subcategories fuelling this index have been expenditure on health and transport. Perhaps, the impact of COVID-19 on rising out-of-pocket expenditure is reflected here. It is because of the increasing price trends in health and transport that the contribution of miscellaneous items to CPI has been rising in the post-pandemic period. In June 2021, it contributed 31.6 percent to CPI inflation.
-
Inflation in Fuel and Light Index, which has a weight of 6.84 percent in CPI, hardened to 12.68 percent YoY in June 2021 versus 11.86 percent YoY in May 2021. Increased petrol and diesel prices seem to be at play here. Consistent increase in the international crude oil prices has translated into petrol prices breaching INR 100 per litre mark in many cities. This remains to be a systemic risk for the future as it becomes difficult for the government to balance the need for extra revenue from high excise duties and rising inflationary pressures. The contribution of Fuel and Light Index in CPI has been rising for the last three months and in June 2021 print, it contributed 12.9 percent to CPI inflation.
-
Clothing and Footwear Price Index, which has a weight of 6.53 percent in CPI, rose to 6.21 percent YoY in June 2021 versus 5.3 percent YoY in May 2021 and remained flat on a sequential basis. The contribution of Clothing and Footwear Index in CPI has been in the range of 5-6 percent during the last six months and in June 2021 print, it contributed 6.4 percent to CPI inflation.
-
Housing Price Index, which has a weight of 10.07 percent in CPI, eased to 3.75 percent YoY in June 2021 versus 3.86 percent YoY in May 2021. The contribution of the Housing Price Index in CPI has been declining for the last three months and in June 2021, it contributed 6.1 percent to CPI inflation.
-
Pan, Tobacco and Intoxicant Price, which has a weight of 2.38 percent in CPI, eased to 3.75 percent YoY in June 2021 versus 3.86 percent YoY in May 2021.
Figure 2: Individual Percentage Contribution of Sub-Indices in Explaining CPI
 Source: MoSPI
Figure 3: Year-on-Year Percentage Growth in CPI Sub-Indices
 Source: MoSPI
Spatial aspect of CPI numbers
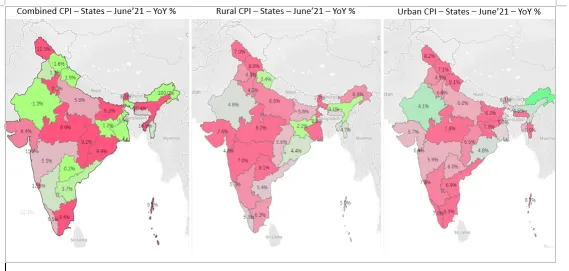
For spatial CPI analysis, we have also computed the state-wise June 2021 YoY inflation rate for the 33 States and Union Territories. The disaggregated CPI YoY numbers show that the rural CPI has eased to 6.2 percent in June 2021 from 6.5 percent in May 2021 while the urban CPI increased to 6.4 percent from 5.9 percent for the same period.
Notwithstanding the decline in rural CPI print for June 2021, our analysis reaffirms that rural inflation is still a matter of concern. A cross-country spatial map analysis shows that for populous states like Uttar Pradesh, Madhya Pradesh, Maharashtra, and Gujarat, rural inflation is not just above the 6 percent mark, it is also higher than its urban inflation counterpart.
Though the factors across Urban and Rural CPI Index remain similar, it disproportionately hits the rural sector more because they have more weights in the Rural CPI basket compared to the Urban.
Major factors resulting in the rise in Rural and Urban CPI are food (eggs, oils, and fats), fuel, healthcare, and transport. Though the factors across Urban and Rural CPI Index remain similar, it disproportionately hits the rural sector more because they have more weights in the Rural CPI basket compared to the Urban.
 Source: MoSPI
Inflation: Transient or durable?
It seems that inflation is a mix of transient as well as some durable factors. Supply-side pressures resulting in tightening of the food prices will ease with the coming of a normal southwest monsoon. Also, government intervention in maintaining buffer stocks can cool off the price of pulses. The increase in edible oil prices remains a worry as it is mostly a reflection of the international prices. Overall, the food price uptick seems to be transitory in nature.
Some downside risks are emanating from the rising trajectory of international commodity prices of crude and base metals. They pose a high systemic risk as India is highly dependent on imports of these items. While the persistent supply cuts have led to the rise in crude oil prices, the metal prices have majorly increased due to the rising demand as the world economy unlocks slowly. They together pose some durable risk to inflationary pressures. The oil market would remain volatile till there is some clarity on the OPEC+ production strategy, which makes it difficult for the MPC to predict the future domestic inflation trajectory.
While the persistent supply cuts have led to the rise in crude oil prices, the metal prices have majorly increased due to the rising demand as the world economy unlocks slowly.
A common factor across the landscape that is fuelling inflation is health expenditure. The nature of inflation of this sub-component seems to be quasi durable, whereby its stickiness would depend on the pace of COVID vaccination and growth in infection rate in the coming months. If the government is able to achieve its target of inoculating a significant percentage of our population by the end of the year, this sub-component should start to ease off in Q4 of 2021-22.
It remains a tough call for the upcoming RBI Monetary Policy Committee to navigate through the classic growth versus inflation dilemma. While economic growth remains the main focus, elevated inflation may ask for some attention. RBI has kept the policy rates low at 4 percent and maintained an accommodative stance to support the Indian economy recover from the pandemic. Going forward, RBI can choose to remain in an accommodative stance and try to anchor the inflation expectations of the household and wait to see the stickiness in the prices.
The views expressed above belong to the author(s). ORF research and analyses now available on Telegram! Click here to access our curated content — blogs, longforms and interviews.


 Source: MoSPI
 Source: MoSPI
 Source: MoSPI
 Source: MoSPI
 PREV
PREV

