-
CENTRES
Progammes & Centres
Location
A policy of carrot and sticks would need to be adopted with affluent and low-income families to decarbonise transport in India

This article is part of the series Comprehensive Energy Monitor: India and the World
Indians travel nearly 5,000 kilometres (km) each year, a threefold increase since 2000. Vehicle ownership per person has grown five‐fold since 2000, with particularly significant growth in the fleet of two and three‐wheelers (2Ws & 3Ws). 3Ws provide shared mobility and public transport, complementing a relatively low stock of 2 million buses that serve mass and public transport needs. 2Ws & 3Ws have grown faster than any other mode of personal transport in the last decade. The average daily distance travelled by 2Ws in Indian cities is about 27−33 km with a maximum of 86 km and the average annual distance travelled is about 8800 km with a maximum of 22,500 km. The high share of 2Ws & 3Ws in India’s vehicle fleet is the reason why personal vehicles account for only 18 percent of its overall transport emissions and 36 percent even if 2Ws & 3Ws are added. This is much lower than in many other countries; in the United States (US), passenger cars account for 57 percent of total transport emissions. Under the push for decarbonisation of transport, India is subsidising the purchase of electric 2Ws (e2W), e3Ws and e4Ws through financial incentives including rebates on the retail price and tax exemptions and non-financial incentives such as priority access to roads, parking and charging facilities. Most of the electric vehicle (EV) sales are accounted by e2Ws and e3Ws. In 2023, 96 percent of the vehicle stock was 2Ws & 3Ws. Even if 2Ws & 3Ws are electrified completely as envisaged by the government, it may be inadequate for decarbonising transport in India.
Emissions from Transport
About 60,000-75,000 vehicles of all types are sold daily, and there are now at least 42 cities and towns in India that have over a million vehicles each. Indian cities with more than 1 million inhabitants already account for nearly 30 percent of total registered vehicles in India, and the level of vehicle ownership in urban households is higher than in rural households. In 2019, the motorcycle ownership rate was 1.4 times higher in urban areas than in rural areas and the passenger car ownership rate was twice as high.
The transport sector is now the fastest‐growing energy end‐use sector in India. Energy use in India’s transport sector has increased fivefold over the past three decades, reaching more than 100 Mtoe (million tonnes of oil equivalent) in 2019. Transport is heavily reliant on oil, with 95 percent of demand met by petroleum products. Just under half of India’s oil demand is accounted for by transport. Oil demand has more than doubled since 2000 because of growing vehicle ownership and road transport use. The rapid growth of mobility was enabled by the expanding road network in India, which increased from 3.3 million km in 2000 to 6.3 million km in 2019. India’s total road network is now the second largest in the world, behind the United States.
Subsidising Electrification
In 2022, India had a stock of 2 million electric two and three‐wheelers (e2Ws & e3Ws) on the road. Driven by subsidies and other incentives, the number of e2Ws & e3Ws has grown by more than 60 percent each year on average since 2015. Lead acid battery‐powered e3Ws (also called e‐rickshaws) are serving the demands of over 60 million people per day, mostly in urban areas. Sales are modest in terms of the size of the overall market with around 982,885 e2Ws & e3Ws sold accounting for about 4.7 percent of total sales. Under current federal and state policies, subsidies are offered only for EVs with advanced battery chemistries, rather than lead‐acid variants that make up most e3Ws & e2Ws on the road today. High taxes on petrol and diesel (about 60 percent of retail prices), lowering of goods and services tax (GST) from 12 percent to 5 percent on EVs along with tax and other incentives offered to EV purchasers are expected to drive the growth of EVs.
Lifecycle Carbon Emissions of EVs
Cradle-to-grave assessments in the transportation sector model the environmental effects associated with the “complete” life cycle of a vehicle and its fuel. This consists of the vehicle’s raw material acquisition and processing, production, use, and end-of-life options, and the fuel’s acquisition, processing, transmission, and use. Life cycle assessments (LCA) of EVs, both in isolation and in comparison to ICE vehicle technology, is extensive and growing. However, as the literature grows, so does the range of results. The divergence is due to the different system parameters of each study, including the selected goals, scopes, models, scales, time horizons, and datasets.
One recent research concluded that EVs must be driven 200,000 km before their “whole of life” carbon emissions equal that of an ICE vehicle. The large quantity of energy (and by extension carbon-di-oxide
As in the case of most EVs, e2Ws face power and cost challenges. The rapidly falling price of batteries could reduce the total cost of the e2Ws; however, to achieve cost parity with ICE, 2Ws (motorbikes), the ratio of the battery pack cost to total vehicle cost also needs to be higher, in addition to a low battery pack price. A higher battery-to-vehicle cost implies a reduction in the cost of the rest of the vehicle.
The efficiency and emission parameters of ICE vehicles have substantially increased in the last decade and are likely to continue improving in the future. For example, Euro 6 diesel has emission levels comparable to EVs. In addition, lower acceleration and lighter weight of ICE vehicles create less road dust and tyre and road degradation which is an important source of urban pollution. Globally, an increase of EVs from the current level of about 5 million vehicles out of a billion to over 300 million out of 2 billion vehicles in 2040 is estimated to reduce oil demand only by less than 1 or 2 million barrels annually. However, the improvement in the efficiency of ICE vehicles is expected to reduce oil demand by over 20 million barrels per day which could substantially reduce pollution and CO2 emission levels.
Issues
Policies for decarbonisation of road transport through electrification without decarbonisation of power generation will merely shift pollution from the tail pipes of vehicles to smokestacks of thermal power generators. The huge prior investment must be made in developing charging infrastructure. Though power generation capacity is not likely to be a deterrent to EV adoption in India in the next five years, advances in anticipation of electricity demand patterns for EVs and grid management will remain challenges. Most importantly ways and means to recoup taxes on petroleum derivatives that make a significant contribution to public finances must be found. A wiser policy will move from picking technologies towards a technology-agnostic view with a focus on outcomes such as level of CO2 reduction.
It is not uncommon for policymakers to subsidise the adoption of new technologies. These subsidies will evolve over time according to developments in technology. But the extent to which India can subsidise the electrification of road transport and how this may affect other developmental and economic goals has not received the attention it deserves. Subsidies are increasing the adoption of EVs, but these subsidies also interact with other goals such as limiting public spending and spending on other more immediate and vital necessities such as education and health care. The government values cumulative adoption of EVs and the international prestige of achieving targets for decarbonisation but the government should also be concerned about spending scarce public funds on electrification. Potential adopters of e3Ws & e2Ws have heterogeneous, private values for EVs. Subsidies for EV adoption has a strong impact when there are a lot of inframarginal consumers who would adopt EVs even at low subsidy levels, but it is weak when most consumers are on the margin like 2W & 3W users in India. This means that without subsidies these users are unlikely to opt for EVs. The policy element missing in decarbonising transport in India are disincentives for investing in ICE vehicles by users who can do without subsidies. This will shift the burden of decarbonisation, at least partly, on the affluent population in India. In the total vehicle stock of just over 340 million in 2023, the share of 2Ws and 3Ws is 75 percent (five times more than that of passenger cars) but their share of fuel consumption is only 20 percent. Vehicles excluding 2Ws & 3Ws are responsible for 80 percent of CO2 emissions. A comprehensive policy that uses sticks or disincentives on the purchase of ICE 4Ws by affluent urban families while limiting the use of carrots or incentives such as subsidies for e2Ws and e3Ws that low-income users of two wheelers may be more appropriate for India.
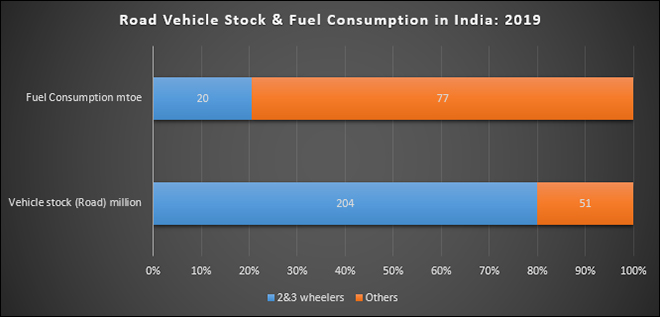 Source: India Energy Outlook 2020, International Energy Agency
The views expressed above belong to the author(s). ORF research and analyses now available on Telegram! Click here to access our curated content — blogs, longforms and interviews.

Akhilesh Sati is a Programme Manager working under ORFs Energy Initiative for more than fifteen years. With Statistics as academic background his core area of ...
Read More +
Ms Powell has been with the ORF Centre for Resources Management for over eight years working on policy issues in Energy and Climate Change. Her ...
Read More +
Vinod Kumar, Assistant Manager, Energy and Climate Change Content Development of the Energy News Monitor Energy and Climate Change. Member of the Energy News Monitor production ...
Read More +