-
CENTRES
Progammes & Centres
Location
 PDF Download
Nilanjan Ghosh and Soumya Bhowmick, “Water Valuation and Pricing in India: Imperatives for Sustainable Water Governance,” ORF Occasional Paper No. 422, November 2023, Observer Research Foundation.
Water scarcity is a harsh reality in India, especially during the dry season, but the situation has not been captured in terms of annual water availability. India’s projected water availability per capita was 1486 m3 in 2021, and is slated to decline to 1367 m3 by 2031.[1] In terms of the Falkenmark indicator,[2] this reflects water stress and not water scarcity.[a] This is lower than the global average of 5500 m3 per capita.[3],[4] If current trends continue, India is on the path to becoming a severely water-scarce country, especially since, while 16-17 percent of the world’s population resides in the country, the landmass possesses only 4 percent of global freshwater resources.[5]
The water demand-supply gap has three aspects, two temporal and one spatial. The first temporal aspect is the seasonality of annual water availability and demand, with dry season availability being substantially lower than the demand. Second, consistent population growth, urbanisation, and the diverse emerging needs for water are long-term demand drivers, with water availability and supply constraints being created by climate change and declining per-capita availability. The third aspect is the massive regional disparity in water availability in India, with some regions better endowed with water resources than others.[6]
Given India’s rapidly growing population, demand drivers will emerge amid the increased need for food, drinking water, sanitation, and development facilities. However, the constraints on water supply will be even more binding due to worsening water pollution, frequent droughts resulting from climate change, and poor water resource management systems causing the overuse and depletion of groundwater. Global warming further aggravates these problems, severely threatening future water availability in the region.
There is extensive use and wastage of water in agriculture,[7] even as many urban centres remain water stressed. Existing literature reveals that the ‘business-as-usual’ way of managing water is unsustainable and can lead to severe stress and conflicts.[8],[9], [10], [11] This necessitates a paradigm shift[b] in how water is viewed, i.e., from a free resource that is available to be stocked and used as per human needs to an integral component of the broader eco-hydrological cycle, as postulated by the principles of integrated water resources management (IWRM).
Over the past five decades, there has been a call for change in the existing management and governance of water resources. Continuous knowledge accrual from research by scholars and water professionals across disciplines has led to the emergence of a new paradigm of water governance that calls for the replacement of the reductionist and engineering-centred paradigm. This new paradigm is still developing, with the accrual of scientific knowledge on water governance at the frontier of the discipline and instrumental in synthesising knowledge of structural engineering with ecological, hydrological, and social sciences.[12]
India is the world’s second-largest producer in terms of farm output,[13] highlighting the crucial role of water in the country’s agricultural sector. Approximately 70 percent of India’s population is employed in agriculture, further intensifying the pressure on water resources.[14] Around 55 percent of India’s arable land relies heavily on the monsoons,[15] making water availability highly susceptible to droughts, which significantly impacts agricultural productivity and output. Droughts have increased in frequency over the past three decades, with projections indicating a worsening trend until 2049.[16] India has experienced 26 drought episodes between 1870 and 2018, with the most recent drought lasting from 2015 to 2018. Although less severe than previous droughts, it caused major damage to the agriculture sector and highlighted the threats to water security.[17] Groundwater resources are extensively relied upon to compensate for water shortages during droughts, which also strains these resources.
As agriculture is the primary consumer of water in the country, improving water management practices in this sector is essential to address the ongoing water crisis. Water-use efficiency in agriculture refers to the crop yield obtained per unit of water consumed or the financial returns generated from water supply infrastructure.[18] India’s water-use efficiency in agriculture is notably low. Therefore, attention must be directed towards the overexploitation of groundwater resources and inefficient irrigation systems. Unless water-use efficiency is effectively addressed in agriculture, other water management practices will fall short of alleviating water stress.
India’s irrigation sector consumes 80 percent of the total water utilised in the country.[19] Groundwater irrigation comprises 70 percent of the total irrigated area and agricultural production in India.[20] India has the highest number of irrigation wells, at approximately 30 million, and pumps out twice as much water as the US and six times that of the European Union.[21] However, these reserves are being used in an unsustainable manner. Perverse subsidies, such as free electricity for pumping groundwater, concessional pricing of water pumps, and input subsidies that encourage intensive cultivation, contribute to the overexploitation of groundwater resources.[22] Suboptimal water pricing also leads to excessive extraction, with India’s groundwater depleting at a rate of 0.3 metres annually.[23] Approximately one-sixth of India’s groundwater assessment units fall under the “over-exploited” category, while 15.2 percent are in a “semi-critical” state, and 3.9 percent are in a “critical” state.[24]
The perverse incentives created by the minimum support price (MSP) have resulted in the cultivation of water-intensive crops, even in highly water-stressed regions with 100 percent reliance on irrigation.[25] This puts immense strain on groundwater resources. For example, despite severe water stress, Punjab and Maharashtra continue cultivating rice and sugarcane, relying solely on irrigation. In Punjab, this has led to 166 percent groundwater extraction.[c] Despite the significant dependence on irrigation, these water-intensive crops are grown in areas with remarkably low water productivity.[26] The extent to which these crops are relied upon for food security in the context of climate change and changing dietary habits has implications for water-use efficiency and overall water productivity in crop cultivation.
The Indian government has recognised the urgency of addressing the overextraction and overuse of water and promoting sustainable water resource management through increased water-use efficiency and productivity. In May 2019, the Ministry of Jal Shakti was established to consolidate efforts towards sustainable water management. The ministry has since introduced several programmes to enhance irrigation efficiency, promote optimal utilisation of water resources, and implement innovative measures, including Pradhan Mantri Krishi Sinchayee Yojana,[27] Atal Bhujal Yojana,[28] Micro Irrigation Fund, NABARD,[29] Sahi Fasal Campaign, the National Water Mission,[30] and the Water Resources Information System.[31]
Water pricing is an important concern in the policy discourse around water governance as well as in the context of the existing programmes (mentioned above). A decline in the real prices of water have resulted in transboundary water conflicts in southern India.[32],[33] The importance of water valuation and pricing in water management cannot be stated merely in terms of user-cost coverage; there is also a need to understand that every drop of water that is diverted from its natural flow compromises the integrity of the flow regime and results in losses to ecosystem services. This is another opportunity cost of the economic use of water. Therefore, pricing needs to be holistic, taking into consideration all specific values (divided into instrumental, relational, and intrinsic values) along with their quantitative and qualitative indicators. Water pricing needs to be dependent on a comprehensive water valuation mechanism that not only covers capital expenditure, operations, and maintenance, but also the externality cost of the ecosystem service losses.
The problem of water allocation arises from the spatiotemporal differences in water availability. Managing water resources must contend with the conventional economic problem of “allocation of scarce resources among competing ends”.[34] Several studies have attempted to address the issue of efficient water allocation. However, institutional theory has been unsuccessful in positing a comprehensive solution to this problem and has failed to surpass theoretical bounds. Institutionalists have shed light on the interplay of legislature and markets in the current state of water management and disputes[35],[36] by incorporating the economics of property rights into the process. Institutional economists’ failure to introduce tangible instruments of water management has led to complete judicial control of water resources, resulting in the inefficient and prejudiced utilisation of water. As such—and especially amid a global crisis—it is critical to introduce an efficient valuation technique that considers the gamut of the social-ecological-economic system, so that even equity and sustainability concerns are addressed in the water management and allocation process. In this context, this paper discusses the need for a robust, unbiased, and inclusive[d] valuation technique,[37] both as a tool for water management and as a feasible instrument for settling water disputes.
Understanding the importance of valuing water will provide water resource managers and policymakers with an objective mechanism for achieving better water governance practices.
Therefore, it can be inferred that water valuation can offer a mechanism for extending distributive justice and setting conservation priorities within a limited budget. As such, the most important function is perhaps the correction of market failures, which has significant implications for sustainable water management.
Water provides crucial ecosystem services, particularly in aquatic ecosystems such as rivers, wetlands, estuaries, and near-coast marine ecosystems, which offer a wide range of benefits to people. These benefits can be categorised as goods and services. Goods include clean drinking water, fish, and fibre, while services encompass water purification, flood mitigation, and recreational opportunities. To ensure the health of these ecosystems and the provision of the benefits, rivers and other aquatic ecosystems require water and other inputs like debris and sediment. Environmental flows, which refer to water allocation to sustain ecosystems, are essential for the wellbeing of these ecosystems.[41] The absence of these flows harms aquatic ecosystems and negatively impacts the people and communities that depend on them. In the long term, the lack of environmental flows jeopardises dependent ecosystems, thereby affecting the lives and livelihoods as well as the security of dependent communities and industries.
However, there is a lack of detailed quantitative knowledge regarding changes in ecosystem structure and functions due to changes in temperature, precipitation, and flooding patterns. The systematic generation of research-based data and information, targeted widespread dissemination of knowledge, and the development of user-friendly methods to quantify ecosystem services are necessary for an interdisciplinary understanding of water systems and integrated water resources management. One of the aspects that have been quantitatively modelled is the self-purification potential of river flows. The increasing agricultural nutrient load on aquatic ecosystems puts additional pressure on river flows’ self-purification capacity.[42] Various methods have been proposed for defining water requirements to maintain ecological processes. Following a 2004 pilot study by Vladimir Smakhtin, Carmen Revenga, and Petra Döll[43] that summarised the results of a global assessment of the total volumes of water required for environmental flows in river basins worldwide (also known as environmental flow requirements), there have been various assessments of the delineation of environmental flows and its literature.[44],[45]
In recent years, there has been increased interest in the services provided by natural ecosystems, regardless of their traditional economic values. While ecologists and professionals in the field have continued to identify ecosystem services over the years, considerable work remains.[46] However, the value of water as an essential input in sustaining diverse natural ecosystems has not been adequately recognised as a valuation exercise. Consequently, identifying and acknowledging the contribution of water to ecosystem services is still an emerging research area.
Differences between the two areas often hinder the integration of environmental sciences and economics in collaborative research efforts in the structures and content of the two disciplines. However, evaluating ecosystem services can serve as a valuable tool for identifying and measuring trade-offs between society and nature to promote sustainable human welfare.[47] While there may exist win-win opportunities between human activities and the environment, such opportunities are becoming increasingly scarce in a global ecological-economic system that is reaching its limits or threshold.[48] In such a context, valuation becomes even more crucial for guiding future human activities.
Another crucial aspect that is often overlooked is the need to strike a balance between allocating water for direct human use (such as agriculture, power generation, domestic supplies, and industry) and indirect human use (the maintenance of ecosystem goods and services) when providing environmental water allocation or establishing environmental flow requirements. As water diversion from natural aquatic systems increases, achieving a balance between the needs of the aquatic environment and the demands for water diversion becomes critical in river basins worldwide.[49] The Millennium Ecosystem Assessment[50] has emphasised the importance of valuing ecosystem services related to water. This was echoed in The Economics of Ecosystems and Biodiversity assessment[51]and, more recently, in the Intergovernmental Platform on Biodiversity and Ecosystem Services report.[52] While reductionist policymaking approaches often overlook water’s ecosystem services, policymakers in developed countries are gradually recognising the extensive value of ecosystem services.[53]
Two primary factors are involved in determining water pricing: equity and efficiency. Efficiency focuses on optimising the allocation of water resources to generate the maximum net benefit using available technology and volumes.[54] It aims to equalise marginal benefits across sectors to maximise overall social welfare.[55],[56] Efficiency is affected by situations and time horizons and has the ultimate goal of maximising net benefits over variable costs—known as first-best efficiency[57]—without distortionary constraints. However, the allocation is the second-best efficient when constraints or distortions exist.[58]
On the other hand, equity in water allocation ensures fairness among economically diverse groups in society. Equity objectives often conflict with efficiency goals since it is challenging to measure fairness objectively.[59] Approaches like Rawlsian fairness,[60] which prioritises the welfare of the least advantaged individuals in society, are used to assess equity. While water pricing mechanisms may not be highly effective in income redistribution,[61] governments may still subsidise specific sectors, such as agriculture, to increase water availability, which could lead to potential inefficiencies. In this context, a distinction can be made between evaluating an irrigation system as a managerial concern and a policy matter.[62]
Equitable pricing can be valuable for promoting equity and efficiency under specific conditions. Differential pricing based on volume, referred to as volumetric methods, aims to achieve vertical equity. On the other hand, market-based pricing promotes efficiency by allowing water to find its value in the market, thus reflecting both the availability and scarcity of water. Higher market prices indicate greater effective demand for water and drive efficiency improvements.
In cases where variations from equity and efficiency are considered, non-volumetric prices, such as output pricing, may be applied. Output pricing assumes that higher output entails higher water usage but disregards notions of resource-use efficiency and factor productivity. This approach can result in undeserved penalties for individuals who use the resource less extensively.
India is in the midst of a severe water crisis resulting from enormous demand-supply gaps (see Table 1), inefficient management of water resources, and climate change. India is predicted to experience critical water shortages by 2050 (see Table 1). Further, there is a disparity in irrigation water pricing across states in India, which has led to low revenue collection under irrigation water charges. A 2021 study examining existing water pricing mechanisms in different states showed the main reasons for low revenue collection to be the low rate of water taxes, infrequent revision of charges, and flaws in the current revenue collection mechanism across states.[63] To address these issues, the study recommended establishing a water regulatory authority as a statutory body to oversee fair pricing and management of water usage.
Table 1: Projected Water Demand in India for Different Sectors
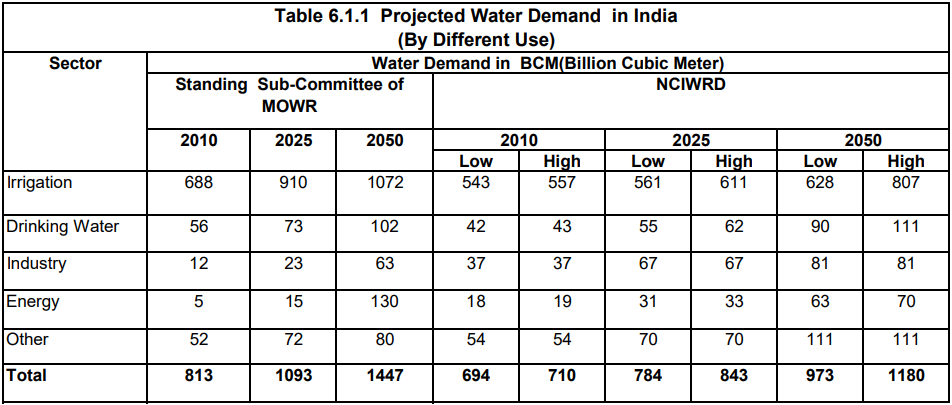
Source: Basin Planning Directorate, CWC, XI Plan Document[64]
Note: NCIWRD: National Commission on Integrated Water Resources Development; BCM: Billion Cubic Meters; MOWR: Ministry of Water Resources
In extension of those recommendations, this paper emphasises that a regulatory body will be effective only when a robust pricing mechanism has been established. A uniform and rigid water pricing system must be implemented to value water and sustainably and accurately utilise the drying resource. India’s tendency to address the deficit by tackling supply-side parameters, which results in the overutilisation of groundwater resources, has exacerbated the problem, necessitating the immediate imposition of a stringent water tariff system across the country. Table 2 shows the irrigation water prices in some states in India, while Table 3 shows the state-wise industrial water rates in India.
Table 2: Irrigation Water Prices in Major Indian States
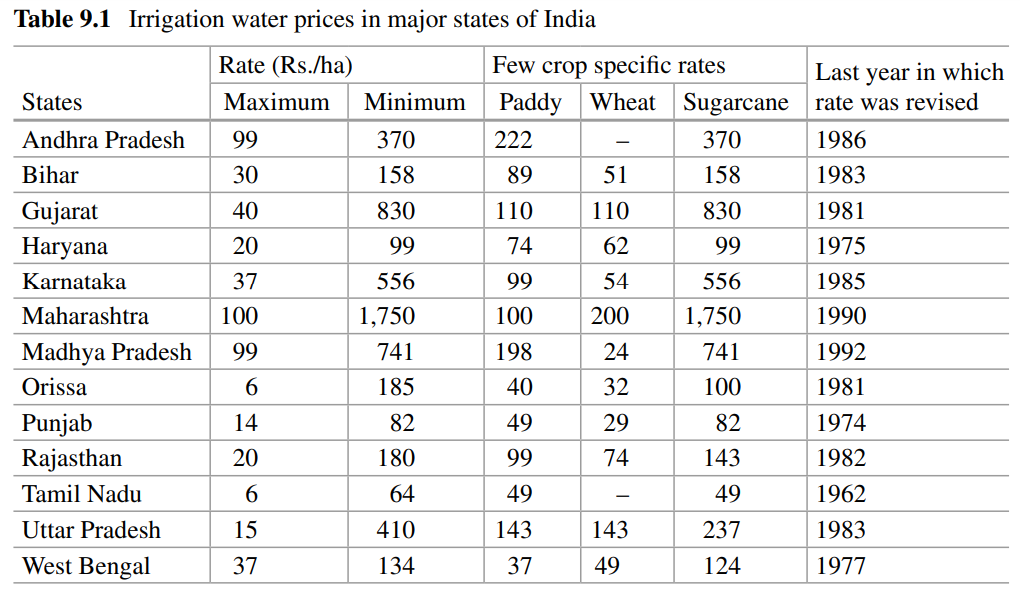
Source: Central Water Commission (2010)[65]
Table 3: State-Wise Industrial Water Rates in India
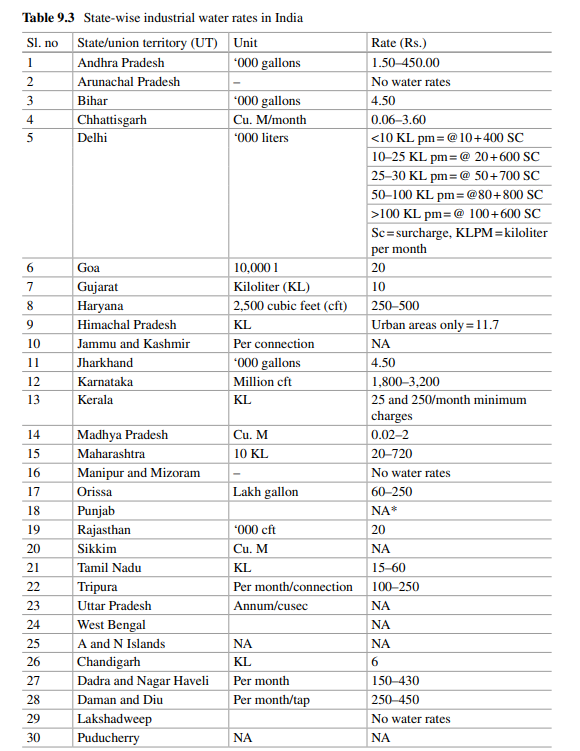
Source: Central Water Commission (2010)[66]
Groundwater depletion due to irrigation and urban and rural domestic water supply has put India in a perilous state. Water supply is heavily dependent on the monsoons, and the climate crisis exacerbates this issue. Tackling this problem requires immediate and momentous changes to the water supply system. The overutilisation of water sources for irrigation must be regulated to allow India to prevent a catastrophe. Table 4 shows the water tariff rates in major Indian metropolitan cities. There is no uniform tariff system, and the prices vary substantially across cities. An appropriate water pricing analysis is necessary to accurately value water and levy the requisite tariff structure to eliminate the worsening demand-supply gap.
Table 4: Water Tariff in Major Indian Cities
| City | Rate | ||
| Delhi[67] | Monthly Consumption (kilolitre) | Service Charge (INR) | Volumetric charge (per kilolitre) |
| 0-10 | 66.55 | 2.66 | |
| 10-20 | 133.1 | 3.99 | |
| 20-30 | 199.65 | 19.97 | |
| >30 | 266.2 | 33.28 | |
| Plus sewer maintenance charge: 60% of water volumetric charge | |||
| Ahmedabad[68] | INR 56.59 (INR 37.96 + INR 18.63) | ||
| Mumbai | INR 6.9/kilolitre | ||
| Kolkata[69] | INR 6.0/kilolitre | ||
| Chennai[70] | Quantity of water | Rate/kl (INR) | Minimum Rate Chargeable (including other charges) (INR) |
| Upto 10 kl | 5 | INR 84 per month per dwelling unit | |
| 11 to 15 kl | 17 | ||
| 16 to 25 kl | 26 | ||
| Above 25 kl | 42 | ||
| Bangalore[71] | Slab | Water Tariff | Sanitary |
| INR | INR | ||
| 0-8000 | 7 | 14 | |
| 8001-25000 | 11 | 25% | |
| 25001-50000 | 26 | ||
| Above 50000 | 45 | ||
| Hyderabad[72] | Slab (kilolitres) | Tariff | Sewerage Cess Charges |
| 0-15 | 7 | 35% | |
| 0-15 | 10 | ||
| 16-30 | 12 | ||
| 31-50 | 22 | ||
| 51-100 | 27 | ||
| 101-200 | 35 | ||
| >200 | 40 | ||
| Surat[73] | Carpet Area (in square metres) | Annual Water and Sewerage Charges Per Family (INR) | |
| 0-15 | 348 | ||
| 16-25 | 600 | ||
| 26-50 | 960 | ||
| 51-100 | 1440 | ||
| 101-200 | 2100 | ||
| 201 -500 | 3750 | ||
| 501 and above | 7500 | ||
Source: Authors’ own, data from various sources
In 1992, the Dublin Water Principles introduced the notion of “water as an economic good”.[74] Nevertheless, the economic value of water had already been acknowledged for centuries before this pivotal move. Across Europe and the US, private water supply companies flourished in diverse settings. The “sanitary revolution” of the 19th century prompted a growing demand for the public ownership and management of many of these companies. While this shift did not negate the importance of treating water as an economic commodity, it did emphasise the public-good nature of water and its disposal, leading to the development of heavily subsidised public systems. This approach was adopted by most countries globally, with the exception of France.[75]
However, in the late 1980s, the World Bank and other international organisations began to advocate for the benefits of privatisation in delivering public services. Privatisation introduced a range of challenges, including the complex task of setting tariffs and prices. Various strategies exist to promote fairness, efficiency, and sustainability within the water sector, and water pricing stands out as a conceptually straightforward yet politically challenging one. For instance, most countries’ conventional command-and-control approach for water management necessitates significant government involvement due to the need for detailed, hands-on monitoring and measurement. Conversely, implementing price policies still requires substantial government intervention to adequately address equity and public goods concerns. A 2021 study analysed the 500 largest community water systems in the US to determine the correlation between system ownership and the financial burden of water expenses on low-income households. The regression analysis revealed a significant association: privately-owned systems typically charge higher rates, leading to decreased affordability for economically disadvantaged families. This effect is exacerbated in states with regulatory environments favouring private entities. Furthermore, the study found that communities characterised by higher poverty rates and ageing infrastructure face more pronounced affordability challenges. These findings suggest an imperative for water policy reform, focusing on ownership structures and regulatory frameworks, to enhance water affordability for low-income residents.[76]
Economic theory has previously addressed the potential for enhancing economic efficiency through the accurate pricing of both private and public goods. Nevertheless, this body of literature has traditionally assumed that elevating prices, given the typical price and income elasticities for water and common income distributions, is regressive and thus undermines equity. However, it can be contended that conventional wisdom on this matter is flawed since raising prices can ameliorate equity concerns. Higher water tariffs empower utility providers to extend their services to presently underserved individuals as well as those who are compelled to purchase water from vendors at exorbitant rates.
Furthermore, a judicious pricing policy can play a pivotal role in safeguarding the sustainability of water resources, which encompass surface water, groundwater, and wastewater. When water prices accurately reflect their actual direct and indirect costs, the resource is more likely to be allocated to its most valuable uses.
Numerous cities and utility providers have traditionally supplied water to customers without significant charges. This practice stemmed from the perception[e] of water as an essential human need and the fact that water was once readily available and relatively inexpensive. However, with growing populations, implementing some form of water allocation is the only sustainable approach to ensure universal access. Assigning a value to water and developing appropriate tariff structures has become increasingly necessary to allocate and prioritise water resources for the most valuable and essential purposes. These structures must be tailored to meet various social, political, and economic objectives based on specific circumstances.
The configuration of a water tariff can assume various forms, each of which would serve a distinct purpose. An ‘optimal’ tariff design for a particular community and situation would strike a balance between the specific objectives that are deemed significant by the community.[77] Consumers and water suppliers harbour different expectations from water tariffs; consumers desire access to high-quality water at an affordable and stable price, while suppliers aim to cover all their costs while maintaining a steady revenue stream. The level and structure of charges for water and wastewater services have far-reaching implications even beyond these primary expectations. Fees related to water can be expected to accomplish several objectives, including generating revenue, enhancing the efficiency of water supply and providers, managing demand, promoting economic development, and improving public welfare and equity.[78] However, there is no single tariff structure that can simultaneously meet all these objectives. Instead, the utility or community needs to identify the objectives that are most pertinent to its unique circumstances.
In resource allocation, tariffs must be designed using a multifaceted approach. The primary objective should be optimising resource allocation to ensure efficiency. Equally significant is the perception of fairness among water users concerning these tariffs. Additionally, the equitable distribution of rates across various customer categories is crucial to maintain a just system. The financial aspect must not be overlooked, as tariffs need to generate sufficient revenue to sustain operations while providing stability in net revenue. Ensuring transparency is pivotal, as the public needs to clearly understand the rate-setting process. These tariffs should also actively promote resource conservation, aiming to balance sustainability and affordability. The tariff-setting process needs to be structured efficiently to prevent rate shocks. Forward-looking rates must be designed, considering environmental costs and alignment with broader government policies. Furthermore, water pricing should reflect supply characteristics, including water quality, reliability, and frequency, and be adaptable based on consumption measurability, accounting for daily peaks and seasonal variations in water demand.
Case Study 1: Climate-Resilient Drinking Water in the Sundarbans
The Sundarbans are a unique and ecologically critical region straddling India and Bangladesh and are particularly susceptible to climate risks. Here, climate risk refers to the potential adverse consequences of climate change on human and ecological systems, encompassing impacts on lives, livelihoods, health, economic assets, and infrastructure. Climate models are forecasting an escalation in climate-related hazards worldwide, anticipating acute climate events of heightened frequency and severity and the intensification of chronic risks.[79] The physical climate risk is projected to increase by 2030, with a potential socioeconomic impact surge of two to 20 times by 2050.[80]
The Sundarbans region confronts numerous challenges caused by climate change, including rising salinity, cyclones, and storm surges. These factors endanger coastal water and soil quality, making drinking water sources increasingly vulnerable. The existing groundwater-based drinking water supply system in the Sundarbans is one such system facing the risk of failure.
To address this imminent threat and create a climate-resilient drinking water system, WWF-India has implemented community-managed reverse osmosis (RO) water units in Rajatjubilee and Jamespur, situated on Satjelia Island in Gosaba Block. These RO units are powered by solar photovoltaic (PV) technology, ensuring uninterrupted operation even during cyclonic events. Each RO water filtration unit can provide 2,500 litres of purified water daily, serving approximately 500 individuals (around 100 households). These units require about 10 kWh of energy to produce purified water. An electric vehicle is employed for water delivery, promoting ecofriendly options. A National Accreditation Board for Testing and Calibration Laboratories accredited laboratory conducts periodic water testing to ensure water quality. Given the region’s vulnerability to cyclones, the solar PV system and module mounting structures are designed to withstand wind speeds of 150–180 km/h. Power is provided by a 15.5-kWp solar PV AC system, a 15-kVA inverter, and a 120-kWh battery. A 25,000-litre raw water tank and battery backup ensure three-day water supply during crises.
To ensure financial sustainability, the RO water units operate as community enterprises. Potable water is sold to paying subscribers on priority, with others charged based on consumption. These community enterprises adopt various forms, such as self-help groups (SHGs), cooperatives, and registered non-profit entities. During cyclone warnings, the RO units provide three 20-litre jars of water per household for free to subscribers and non-subscribers, guaranteeing three days of drinking water autonomy. The system’s levelised cost of water is estimated at INR 1.06 per litre over ten years of operation. With an installation cost of INR 5.3 million and an annual operational cost of INR 0.4 million lakhs, the system maintains a 48 percent operating margin without any land expenditure. The climate-resilient drinking water supply system of the Sundarbans effectively mitigates climate risks in vulnerable regions. By embracing solar-powered RO units, community management, and innovative revenue models, this project attempts to offer a sustainable solution that ensures access to safe drinking water and enhances resilience in the face of climate change. The three days of reserve water allows the community to sustain during this period without external aid in the aftermath of any high-intensity climate event. Therefore, this is a valuable model for similar climate-prone areas.
Case Study 2: Valuation of Flow Regimes of the Upper Ganges[f]
This study was originally conducted by the lead author of the current paper while advising WWF-India to understand the benefits offered by flow regimes, including environmental flows.[g] Every flow regime is associated with ecosystem structures, functions and consequent ecosystem services for the human community. While scientists and environmentalists have discussed ecosystem services implicitly for decades, the concept of ecosystem services was popularised by the Millennium Ecosystem Assessment (MA) of 2005.[81] The MA grouped ecosystem services into four broad categories: provisioning, such as the production of food and water; regulating, such as the control of climate and disease; supporting, such as nutrient cycling and crop pollination; and cultural, such as spiritual and recreational benefits. To help inform decision-makers, many ecosystem services are being assigned economic values.[h] India is one of the project countries implementing the Natural Capital Accounting and Valuation of Ecosystem Services project, piloting ecosystem accounting and valuation of ecosystem services.[82] Here, various flow regimes are associated with various services provided by the ecosystem and might entail changes in the target groups for the services. To understand trade-offs between two flow regimes, it is important to devise an objective mode of evaluating each scenario of the flow regimes. The monetary valuation of a flow regime is one of the ways to evaluate the scenarios, understand the trade-offs, and help in the allocation of water across sectors.
The following aspects can be considered while evaluating flow regimes:
Based on an initial pilot survey and possible availability of data, a list of ecosystem services were prepared for the study area for the community. However, the aquatic ecosystem (including the various supporting services for aquatic flora and fauna, and their regulating and provisioning services) could not be considered in this study due to a lack of adequate information and data. Some of the terrestrial ecosystem services, which serve as regulating services, are supported by the water body. The list of services considered in this study, along with the method by which they are going to be evaluated, is provided in Table A of the appendix.
The study considered data for the districts of Saharanpur, Muzaffarnagar, Meerut, Ghaziabad, Bulandshehar, Gautambudh Nagar, Aligarh, Hathras, Mathura, Agra, Etawah, Firozabad, Kanpur Dehat, Kanpur Shahar, Mainpuri, Fatehpur, Kannauj, Farrukhabad, Kausambhi, Auriya, and Etah in Uttar Pradesh; and Haridwar in Uttarakhand.
As part of the primary surveys, the team held meetings, one-on-one discussions, and deliberations on the irrigation command of the Upper Ganga Canal (UGC), from the Bhimgoda Barrage in Haridwar district, Uttarakhand, and the Lower Ganga Canal (LGC), from the Narora Barrage in Bulandshahar district, Uttar Pradesh. Broadly speaking, survey activities were held in select locations across western and central Uttar Pradesh (Muzaffarnagar, Meerut, Aligarh, Baghpat, Bijnor, Mathura, Hathras, Auriya, Etah, Mainpuri, Etawah, Kannauj, Kanpur, Farrukhabad, Firozabad, Agra, etc.) as well as in Haridwar district (Figure 1).
Figure 1: Locations of Farmers Surveys Conducted in the Irrigation Command of the UGC and the LGC
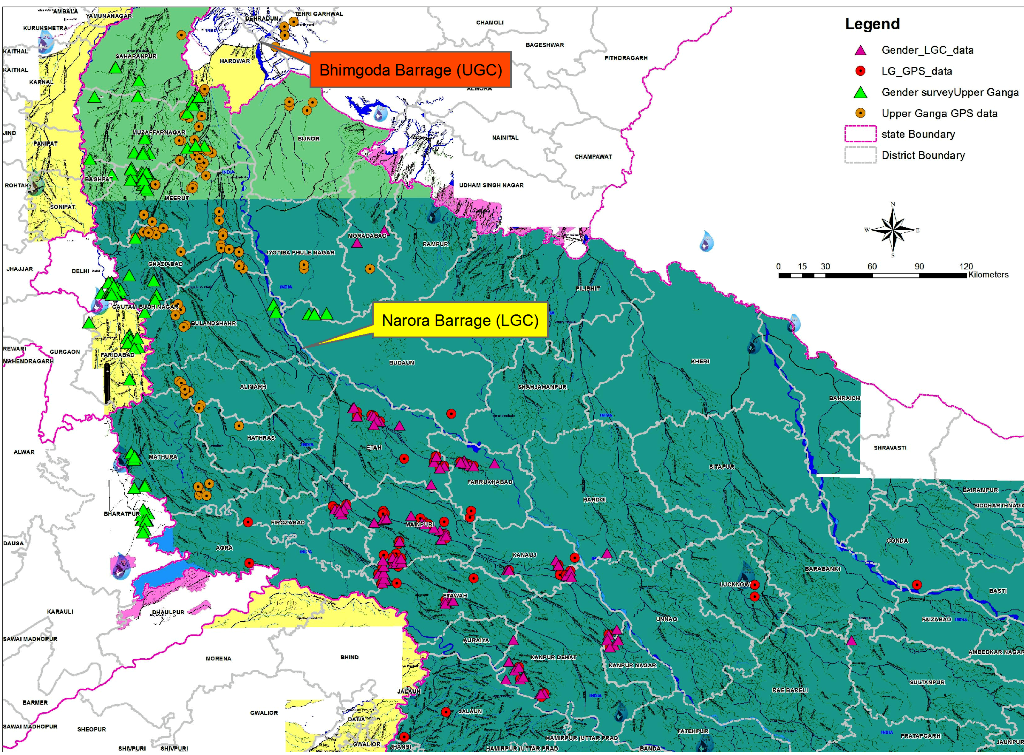
Source: Ghosh et al. (2018)[83] and Kaushal et al (2019)[84]
The total sample size was over 1,000, of which 50 percent were women. The tourism and livelihoods surveys were conducted in villages and towns located upstream and downstream of key intervention areas, i.e., Bhimgoda Barrage (Rajaji National Park, Haridwar, and adjoining villages) and Narora Barrage (including Karnvaas, Narora, and Balramghat). The sample size at these locations was over 200.
Besides this, discussions and stakeholder deliberations were held with officials and field functionaries from the Uttar Pradesh Irrigation Department in central locations (i.e., Lucknow) and field locations (i.e., offices in the irrigation command of the UGC and the LGC). The team interacted with over 100 officials and field functionaries.
The study took into consideration two flow regimes: the business-as-usual (BAU) regime of the current flow regime and the e-flow regime. Each flow regime has been represented by hydrographs. The BAU and the e-flow regimes downstream of the Narora Barrage are presented in Figure 3. It is clear from the figure that the e-flows are well met by the BAU flow regime, except in the drier months, when there is a deficit for meeting the e-flows. This is even more evident from the gap analysis, represented in Table 5, which makes it evident that there is gap towards achieving an e-flow regime in the months of December, January, February, and April.
On the other hand, while reviewing the Balwalli hydrograph downstream of the Bhimgoda Barrage, it is evident that there are deficits from e-flows during the months of May, June, July, August, and October. The BAU flow regime and its gaps compared to the e-flows, as well as the minimum ecological requirements for Balwalli are shown in Figure 4. The e-flows may be achieved during the wet months in the region through additional water releases from the Tehri dam.
However, such options might not be viable in the Narora barrage since there is clear deficit in the region during the dry months, from December to April. Therefore, the demand management is the only option. In this case, it is assumed that there cannot be a compromise on drinking water, but options of water saving may be sought from the agricultural sector, either through improvising irrigation practices for enhanced water-use-efficiency at the farm level or the repair of dilapidated irrigation system infrastructure at critical points for crop diversification. Further, there cannot be a reallocation of water across the year, as it is believed that every drop of water has an ecological function to perform, and any amount of water in any season is an integral component of the global eco-hydrological cycle. Througout the year, the water that needs to be released for achieving e-flows has to be from the irrigation sector, which amounts to 135.41 million cubic metres. Given that the total water abstraction at Narora is 6,145 million cubic metres, the combined e-flow deficit is barely 2.2 percent of the of the total abstraction. However, the deficit is to the tune of 18.5 percent in the month of December and around 17.6 percent in the month of April (see Table 5).
Table 5: The Gap of BAU from E-Flows
| Month | BAU (million cubic metres) | Gap from E-Flows (million cubic metres) | Water abstraction at Narora (million cubic metres) | E-Flow Gap as % of Abstraction |
| January | 35.02 | 14.23 | 508 | 2.801181102 |
| February | 20.14 | 29.11 | 440 | 6.615909091 |
| March | 74.35 | -1.16 | 316 | |
| April | 64.5 | 41.03 | 233 | 17.60944206 |
| May | 143.95 | -38.41 | 380 | |
| June | 1033.64 | -738.8 | 553 | |
| July | 4956.51 | -1493.55 | 920 | |
| August | 8173.65 | -2761.28 | 709 | |
| September | 1936.37 | -2411.43 | 709 | |
| October | 826.82 | -668.65 | 670 | |
| November | 165.01 | -59.48 | 431 | |
| December | 26.35 | 51.04 | 276 | 18.49275362 |
Source: Ghosh et al (2018)[85]
On the basis of the methodology (see Table A of the appendix), it is found that the present flow regime yields the values of the ecosystem services (see Table 6).
Table 6: The Values of the Ecosystem Services Associated with the BAU Flow Regime (2005–06)
| Ecosystem Service | Value (in INR billion) |
| Water in Agriculture | 74.79 |
| Religious tourism | 29.8 |
| Supporting forests for Carbon Sequestration | 221.88 |
| Micro-Climate Regulation | 21.75 |
| Water purification for domestic use | 14.28 |
| Forest Tourism (Rajaji Tiger Reserve) | 2.07 |
| River bed farming | 19.89 |
| Total | 384.46 |
Source: Authors’ estimation
By 2015–16 prices, these amount to INR 873.89 billion. These are highly conservative estimates, as only a few ecosystem services have been taken into consideration. INR 873.89 billion is the value of ecosystem services for one year. The entire investment for the Namami Ganga project is nearly INR 200 billion for five years. Therefore, the annual yields of even a small stretch of the river are four times the investment.
The values of the flows of benefits from 2015 to 2050 vary with the rates of the premium (see Table 7). As previously stated, the rate of the premium is intended to take care of inflationary pressures, the time value of money, and purchasing power.
Table 7: Values of Flows of Benefits from 2015 to 2050 in the BAU Flow Regime
| Rate of Premium (%) | Flow of Benefits in BAU (INR Billion) (2015–50) |
| 1 | 37644 |
| 2 | 45437 |
| 4 | 67812 |
| 6 | 104098 |
| 8 | 163507 |
| 10 | 261404 |
| 12 | 423367 |
| 14 | 691835 |
| 16 | 1136954 |
| 18 | 1874187 |
| 20 | 3092705 |
Source: Authors’ estimation
The value of the flow benefits from 2015 to 2050 vary from INR 37,644 billion to INR 3,092,705 billion, depending on the rate of the premium. If the rate of premium is accepted to prevail at an average of around 10 percent, as has been considered in other analyses,[i] the flows of benefits during the mentioned period will amount to INR 261,404 billion.
This paper will compare various scenarios under two demand-management cases with the prevailing condition under the BAU scenario.
Climate change is causing springs and water sources to dry up in the Himalayas. Deforestation, improper agricultural and road development, and native vegetation loss are worsening the situation. Earthquakes can also shift or dry up water sources; for example, the Nepal earthquake of April 2015 led to a critical water shortage in Nepal’s river basins. To prevent a water crisis, there is a need for an Integrated River Basin Governance[86] strategy and action plan with clear goals and actions.
Water-use efficiency means water-use efficiency of productivity (also called integrated water-use efficiency), which is typically defined as the ratio of biomass produced to the rate of transpiration. Enhancing water-use efficiency encompasses the response mechanism of plants when faced with moderate to severe soil water deficits. Effectively, these include practices that result in lower water consumption without compromising with crop production. One such example is the system of rice intensification. On the other hand, yield enhancement entails better soil management practices that will increase the average productivity of acreage. In this case, this paper presents four different scenarios (see Table 8) that, though merely indicative and certainly not exhaustive, are based on informed arbitrariness and stakeholder meetings. The water-use efficiency improvement and yield enhancement figures have been chosen in the range of 0.5 percent and 5 percent, acknowledging the limitations of the econometric framework. Although the authors have chosen for log-linearity, the existence of log-linearity might not be true for all ranges of values. Additionally, the authors have not examined the estimation of non-beneficial or beneficial evapo-transpiration, since that was out of the scope of this work. The authors acknowledge that water withdrawal reduction will result in a decline in non-beneficial evaporation and transpiration. On the other hand, irrigation modernisation process linked to increased yield can result in an increase in beneficial evapo-transpiration[87]
Table 8: Water-Use Efficiency and Yield Enhancement Scenarios
| Scenarios | Description |
| Scenario A | Water-use efficiency enhanced by 1 percent and 1 percent increase in yield |
| Scenario B | Water-use efficiency enhanced by 0.5 percent and 1 percent increase in yield |
| Scenario C | Water-use efficiency enhanced by 5 percent and 10 percent increase in yield |
| Scenario D | Water-use efficiency enhanced by 2 percent and 5 percent increase in yield |
The other mode of releasing water in-stream during the months of December to April is by shifting from a high water-consuming rabi wheat to a drier crop. Wheat is the most prominent irrigated crop from December to April and is dependent on canal irrigation. The other water-consuming staple, rice, is primarily dependent on groundwater for irrigation. Therefore, wheat is chosen as the crop from which water needs to be released as it occupies maximum acreage during rabi in the Upper Ganges district in Uttar Pradesh.
The authors also had to choose a substitute crop with a substantially lower crop-water requirement so that water may be released in-stream. After stakeholder consultations, sorghum (or jowar) was taken to be a representative substitute and has been considered in this analysis. There are other options like high-value vegetables; however, for the sake of exposition and to understand the trade-offs in a simplified framework, the authors are only considering sorghum The crop-water requirement of sorghum is almost one-fifth that of paddy, and, therefore, substantial water can be released in-stream. Table 9 presents crop diversification in various scenarios.
Table 9: Crop Diversification Scenarios
| Scenario | Description |
| E | 1 percent decline in area of wheat |
| F | 2 percent decline in area of wheat and replaced by sorghum |
| G | 5 percent decline in area of wheat and replaced by sorghum |
| H | 6 percent decline in area of wheat and replaced by sorghum |
| I | 20 percent decline in area of wheat and replaced by sorghum |
| J | 15 percent decline in area of wheat and replaced by sorghum |
| K | 12.5 percent decline in area of wheat and replaced by sorghum |
Since e-flows are not achieved with scenario E, the authors have not considered substitution with drier crops for this analysis.
The results of the scenario analyses are presented in Table 9, which provides a clearer picture of the associated trade-offs in moving from the present flow regime to the e-flow regime.
In this analysis, the value associated with each scenario is considered as the value of the flow regime. The monetary value of each flow regime thus obtained provides a clear picture of the trade-offs associated with moving from the current flow regime to the e-flows or other regimes through demand management. As can be observed from Table 9 scenario B is the most optimal regime, revealing the highest value of the flow regime and the highest value for the farmer, as well as meeting the e-flow requirements. In this situation, water-use efficiency increases by 0.5 percent and yield increases by 1 percent.
In the crop-diversification case, scenario F is the best option. In this case, there is a 2 percent decline in wheat, which is taken up by sorghum. Even in this case, there is the highest value of ecosystem services and highest increase in farm incomes, alongside e-flow requirements being met.
In scenarios H–K, which entail 6–20 percent of the area converted to sorghum from wheat, farm income declined, reflecting the role of the diminishing marginal product of area and water and the negative coordinates for sorghum production at the given area and water. These results are in consonance with paddy production functions estimated by Nilanjan Ghosh and Jayanta Bandyopadhyay,[88] as well as by other authors in the context of various crops.
Table 9: BAU, Water-Use Efficiency, and Yield Enhancement, and Crop Diversification Scenarios
| Water-Use Efficiency and Yield Enhancement Scenarios | Crop Diversification Scenarios | |||||||||||
| BAU | A | B | C | D | E | F | G | H | I | J | K | |
| Flows of values of ecosystem services (2015–50) or value of flow regime (INR billion at 10 percent premium) (1) | 261.40 | 266.53 | 271.51 | 268.74 | 266.53 | 261.69 | 261.69 | 261.47 | 261.40 | 260.37 | 260.74 | 260.92 |
| Annual value gain for farmer (INR billion) (2) | 0 | 16.63 | 32.80 | 23.82 | 16.63 | 0.92 | 0.93 | 0.22 | -0.02 | -3.34 | -2.15 | -1.56 |
| Water released in-stream annually (million cubic metre) (3) | 0 | 340.59 | 170.29 | 1702.93 | 681.17 | 131.24 | 167.04 | 417.59 | 501.11 | 1670.36 | 1252.77 | 1043.98 |
| Water released as percentage of abstraction at Narora Barrage (4) | 0 | 5.54 | 2.77 | 27.71 | 11.09 | 2.14 | 2.72 | 6.80 | 8.15 | 27.18 | 20.39 | 16.99 |
| Attainment of e-flows (5) | No | Yes | Yes | Yes | Yes | No | Yes | Yes | Yes | Yes | Yes | Yes |
Source: Ghosh et al (2018)[lxxxix]
Under these circumstances, if the two demand management cases—water-use efficiency and yield enhancement, and crop diversification—are combined, the most optimal situation will be arrived at by combining scenario B with scenario F. This implies that enhancing water-use efficiency by 0.5 percent, resulting in a 1 percent increase in yield, along with a 2 percent decline in the area of wheat, which is replaced by sorghum, can result in improved value of the flow regime, increase in farmers’ value, and the e-flow regime.
The two cases indicate the application and importance of the valuation and pricing of water. In the second case of the flow regime valuation, it is clear that ecosystem service valuation that employs integrated and holistic valuation methods can aid the understanding of the trade-offs and opportunities for creating synergies, as it is merely axiomatic to state that adoption of water savings practices will result in a decline in agricultural production and farm income. Therefore, there is a need to examine water-use efficiency, and the use of alternating crops to compensate for the loss. Further, the values associated with flow regimes act as objective instruments to prioritise which demand management option needs to be adopted for the best possible results.
Through a combination of approaches, it is possible to restore environmental flows in the Ganga. At the current rates and current state of health, the annual value of ecosystem services offered by the river is INR 873.89 billion.[j] The entire investment for the Namami Ganga project is nearly INR 200 billion for five years; therefore, the annual yields of even a small stretch of the river are four times the investment.
The first case of drinking water pricing in the Sundarbans is more related to the pricing. However, as revealed by the second case of flow regime valuation, prices are largely based on market forces and hardly reflect externalities. The discussion regarding valuation and pricing in the context of water management raises two key policy issues: execution and pricing strategy. These issues largely hinge on allocating property rights to water resources in different countries. In a scenario where water rights are entirely privatised, a laissez-faire approach would likely entail charging a price that closely aligns with the total economic cost of water. However, if there are concerns about environmental externalities, government intervention in command-and-control measures or taxation policies may be necessary. Additionally, if there is a significant population of economically disadvantaged individuals in need of access to water, the government may consider providing subsidies to assist the most vulnerable users. In cases where the government retains control over water rights, it may opt for a pricing structure that aims for full-cost recovery, including accounting for environmental externalities. Regardless of the specific approach adopted, it is crucial to ensure that the price of water does not fall below the full-supply cost.
Incorporating a water pricing regime is crucial, especially amid climate change and worsening water scarcity. India needs to undertake urgent measures to curb the exploitation of groundwater resources and levy water tariffs across the country to relieve the burden of the water crisis. Water availability has far-reaching implications in terms of sanitation and health, which cannot be overlooked and should be internalised in water pricing analysis. A fair pricing system that eliminates the divide between social and economic returns must be prioritised. Knowledge-sharing between the G20 nations and inputs from OECD countries can catalyse the process of efficient water valuation, thus increasing efficiency. A diverse array of policy options is available for implementing pricing strategies in the water sector. These options encompass direct pricing mechanisms, green taxes, effluent fees, and direct subsidies to utility providers or end users.
In India, water management has historically been focused on increasing supply and prioritising technical and socio-political measures to satisfy rising demand, often through uncoordinated and poorly managed projects in areas like irrigation, drinking water, sanitation, hydropower, and flood control. These projects are typically evaluated for economic viability, with limited consideration for environmental flows and often overlooking social and cultural implications. They are usually overseen by a single authority that employs top-down and non-transparent pricing and management, leading to conflicts and suboptimal water use across sectors, states, and communities, which results in a failure to meet efficiency, fairness, and environmental goals.
The IWRM approach seeks to change this by advocating for a comprehensive view of water resources that considers all competing demands—domestic, agricultural, hydropower, industrial, cultural, and environmental. It calls for a management approach that is aware of and responsive to the interplay between these demands, ensuring coordination within and between sectors, including those of ecosystems. The holistic and inclusive valuation proposed in this paper serves to augment the IWRM framework.
Appendix
Table A provides the ecosystem services considered in the study, the data discovery methods, and the methodology for valuation. The base period for analysis is 2005–06 as it was a normal year without the economic slump (that began in 2007) catching up to the carbon and the commodity markets. The figures are then converted to 2015-16 prices based on wholesale price index.
Table A: List of the Ecosystem Services, variables considered, and the Methodology for Flow Regime Valuation
| Provisioning Services | ||||
| Service | Description | Variables on which data is needed | Methodology | |
| Water for agriculture (Food) | Water flow by itself provides for agricultural food crops (by way of irrigation or otherwise). | 1. Five major food crops grown in the stretch 2. Their quantities 3. Corresponding acreage of the crops 4. Farm-gate price of the crops This needs to be crop-season data (Kharif/Rabi/Summer) 10 years’ data | Production function approach: Fitting an agricultural production function by estimating water use through crop-water requirement | |
| Sedimentation: River bed farming | This is another food aspect. | 1. Food crops grown 2. Their quantities 3. Corresponding acreage of the crops 4. Farm-gate price of the crops. | Benefit transfer approach | |
| Water for domestic use | A very important provisioning service stretched across a larger zone than that of the current study. We have considered only our study area here. | 1. Population in the study zone 2. Amount of water consumed for drinking purposes across various months | Total water used by the domestic sector multiplied by the cost borne, added with the consumer surplus | |
| Regulating Services | ||||
| Carbon sequestration | Sustenance of green cover that helps in carbon sequestration |
|
Market prices: Product of CER/VER prices and sequestered carbon | |
| Microclimate regulation | LULC in the catchment | Benefit transfer method: Product of the catchment area and the estimates of cost (sunk and O&M) per unit area of installing a climate-regulating unit, taken from past studies | ||
| Cultural Services | ||||
| Forest tourism | Water sustains forests, which results in tourism. Tourism leads to revenues for the local community as well as satisfaction for tourists. Hence, while there is a value obtained by the local community, there is also another component of the value that is obtained by tourists who come from beyond local areas (and even beyond national borders). |
|
Demand function and consumer surplus estimation: 1. Average amount spent per tourist 2. Estimation of consumer surplus through benefit transfer 3. Total value obtained by adding (1) and (2) | |
| Religious tourism | While it is recognised that the religious and spiritual satisfaction attached with the river Ganga and its flows cannot be monetised, we have confined ourselves to the revenue aspect of tourism. | 1. Select religious centres 2. Seasonal flow of tourists (last five years) from the tourism department 3. Survey of a random sample of 500 religious tourists on how much they are spending on religious purposes | Revenue approach: Product of the average amount spent by 500 tourists and the total number of tourists | |
In this analysis, the authors have consciously avoided considering any supporting services to avoid problems related to double counting. Further, the estimates are underestimates or conservative estimates as the authors consider only a few ecosystem services and not the entire range of ecosystem services that may exist.
[a] As per the Falkenmark indicator, annual per-capita water availability of less than 1,700 m3 is considered to be a water-stressed condition, while annual per-capita water availability below 1,000 m3 is considered to be a water-scarcity condition.
[b] This paper uses the term ‘paradigm’ in the way referred to by Kuhn (1969) while explaining changes in the structure of scientific knowledge in general.
[c] Of the 7,089 assessment units in the country, 1,006 have been categorised as over-exploited, 260 as critical, and 885 as semi-critical, while the rest have been recognised as safe (see Ministry of Jal Shakti, Government of India, "Dynamic Ground Water Resources of India, 2022.)
[d] Valuation processes that are tailored to equitably and inclusively take into account the multiple conceptualisation of values of ecosystem goods and services from the perspectives of diverse stakeholders in the different decision-making contexts of India’s water regime (see Intergovernmental Platform on Biodiversity and Ecosystem Services (2022)).
[e] For example, in many countries (such as Nepal and Bhutan), clean drinking water is constitutionally considered to be a fundamental right. Additionally, certain international human rights treaties entail specific obligations related to access to safe drinking water and sanitation (see https://www.ohchr.org/sites/default/files/Documents/Publications/FactSheet35en.pdf; Article 14(2) of the Convention on the Elimination of All Forms of Discrimination against Women, 1979; Article 5 of the International Labour Organization (ILO) Convention No. 161 concerning Occupational Health Services, 1985; Articles 24 and 27(3) of the Convention on the Rights of the Child, 1989; and Article 28 of the Convention on the Rights of Persons with Disabilities,
2006).
[f] An earlier extended and unpublished version of this case has been written by Nilanjan Ghosh, Suresh Babu, Nitin Kaushal, and Arjit Mishra.
[g] The very recent Indian Institute of Technologies’ consortium definition acknowledges this multidimensionality of flow regime and Environmental Flows as, “…a regime of flow in a river or stream that describes the temporal and spatial variation in quantity and quality of water required for freshwater as well as estuarine systems to perform their natural ecological functions (including sediment transport) and support the spiritual, cultural and livelihood activities that depend on these ecosystems.”
[h] For example, the UN’s System of Environmental Economic Accounting.
[i] For example, Nilanjan Ghosh, Anamitra Anurag Danda, Jayanta Bandyopadhyay, and Sugata Hazra. “Away from the Devil and the Deep Blue Sea: Planned Retreat and Ecosystem Restoration as adaptation to Climate Change”, PRI Issue Brief No. 1, WWF India.
[j] These are highly conservative estimates, as only a few ecosystem services have been taken into consideration.
[1] Department of Water Resources, River Development & Ganga Rejuvenation, Ministry of Jal Shakti, Government of India, “Per Capita Availability Of Water Rajya Sabha Unstarred Question No. 96. Answered On 03.02.2020”, https://sansad.in/getFile/annex/251/AU96.docx?source=pqars.
[2] Malin Falkenmark, “The Massive Water Scarcity now Threatening Africa: Why isn't it Being Addressed”, Ambio, (1989):18(2), 112-118.
[3] Hannah Ritchie and Max Roser, “Water Use and Stress: Renewable freshwater resources per capita”, Our World in Data.
[4] World Bank, “Renewable internal freshwater resources per capita (cubic meters)”.
[5] Mahesh Nathan, “India’s water crisis: The seen and unseen,” DownToEarth, March 19, 2021.
[6] Nilanjan Ghosh, “Economics of Hostile Hydropolitics over Transboundary Waters: Scarcity Values and Interstate Water Conflicts in India and US”, Saarbrucken, Germany: VDM Verlag, (2009).
[7] Nilanjan Ghosh and Jayanta Bandyopadhyay,“A Scarcity Value based Explanation of Trans-boundary Water Disputes: The case of the Cauvery Basin in India”, Water Policy, (2009): 11 (2), 141-67.
[8] William J. Cosgrove and Frank R. Rijsberman, World Water Vision: Making Water Everybody’s Business, (London: Earthscan, 2000).
[9] Peter H. Gleick, “The Changing Water Paradigm: A Look at Twenty-first Century Water Resources Development”, Water International, 25 (1) (2000): 127-38.
[10] Jayanta Bandyopadhyay, Water, Ecosystems and Society: A Confluence of Disciplines, (New Delhi: Sage Publications, 2000).
[11] Nilanjan Ghosh, “Water, Ecosystem Services, and Food Security: Avoiding the costs of ignoring the Linkage”, in Kathuria, R. (Eds.) Low Carbon Pathways for Growth in India, 161-76 (New Delhi: Springer, 2018).
[12] Nilanjan Ghosh. “From Reductionist to Holistic Paradigm: Combining Ecology, Economics, Engineering, and Social Sciences in a Transdisciplinary Framework for Water Governance”, Ecology, Economy and Society—the INSEE Journal, (2018) 1 (2): 69–72, https://doi.org/10.37773/ees.v1i2.36
[13] Dhawan, “Water and Agriculture in India”, background paper for the South Asia expert panel during the Global Forum for Food and Agriculture (GFFA) 2017.
[14] Guna Nand Shukla et al., “Creating an ecosystem for increasing water-use efficiency in agriculture, PricewaterhouseCoopers”, PWC, March 2021.
[15] Yen Nee Lee, “India may need major rainfalls to reverse its economic slowdown,” CNBC, July 10, 2019.
[16] Dhawan, “Water and Agriculture in India”
[17] Vimal Mishra, “Looking back into history to understand droughts,” India water portal, December 4, 2019.
[18] Bharat Sharma, David Molden and Simon Cook, “Water use efficiency in agriculture: Measurement, current situation and trends”, in P. Dreschel et al (eds.) Managing Water and Fertilizer for Sustainable Agricultural Intensification, International Fertilizer Industry Association (IFA), International Water Management Institute (IWMI), International Plant Nutrition Institute (IPNI), and International Potash Institute (IPI) Paris, France, January 2015.
[19] Government of India, Ministry of Water Resources, Performance Overview & Management Improvement Organization, Central Water Commission, “Guidelines for Improving Water Use Efficiency in Irrigation, Domestic & Industrial Sectors”, November 2014.
[20] Ram Fishman, Xavier Giné and Hanan G. Jacoby, “Does a drop per crop help groundwater extraction to stop?” , India water portal, October 4, 2021.
[21] MG Chandrakanth, “Farm subsidies account for 21% farm income per hectare with continuing patronage of governments,” The Times of India, February 27, 2021.
[22] Nilanjan Ghosh and Jayanta Bandyopadhyay, “A scarcity value based explanation of trans-boundary water disputes: the case of the Cauvery River Basin in India”, Water Policy, 11(2) (2009): 141-67.
[23] Shukla et al., “Creating an ecosystem for increasing water-use efficiency in agriculture”
[24] Vishwa Mohan, “1/6th of India’s ground water reserves over-exploited: Study,” The Times of India, July 11, 2021.
[25] Nilanjan Ghosh and Sayanangshu Modak, “Water Disputes in the Cauvery and the Teesta Basins: Conflictual Federalism, Food Security, and Reductionist Hydrology”, in P. Dasgupta et al (eds.) Sustainable Development Insights from India: Selected Essays in Honour of Ramprasad Sengupta (Singapore: Springer, 2021).
[26] Shukla et al., “Creating an ecosystem for increasing water-use efficiency in agriculture”
[27] Government of India, Ministry of Agriculture & Farmers Welfare, “About PMKSY,” Pradhan Mantri Krishi Sinchayee Yojana.
[28] Government of India, “Atul Bhujal Yojana,” Ministry of Jal Shakti.
[29] National Bank for Agricultural and Rural Development, “Micro Irrigation Fund".
[30] Government of India, Ministry of Jal Shakti, “Sahi Fasal Campaign”, National Water Mission.
[31] Government of India, Department of Water Resources, “River Development and Ganga Rejuvenation, DEVELOPMENT OF WATER RESOURCES INFORMATION SYSTEM (OTHER THAN RMIS)”, Jalshakti.
[32] Ghosh, “Economics of Hostile Hydropolitics over Transboundary Waters: Scarcity Values and Interstate Water Conflicts in India and US”
[33] Ghosh and Bandyopadhyay, “A Scarcity Value based Explanation of Trans-boundary Water Disputes: The case of the Cauvery Basin in India
[34] Lionel Robbins, “An Essay on the Nature and Significance of Economic Science”, Macmillan, London,(1932).
[35] Scott Barrett, ‘Conflict and Cooperation in Managing International Water Resources Policy’, World Bank, Research Working Paper No. 1303, Washington DC (1994).
[36] Peter Berck and Jonathan Lipow , ‘Real and Ideal Water Rights:The Prospects for Water-Rights Reform in Israel, Gaza, and the West Bank’, Resource and Energy Economics,(1994) Vol. 16, No. 4, pp. 287–301.
[37] IPBES, Summary for Policymakers of the Methodological Assessment Report on the Diverse Values and Valuation of Nature of the Intergovernmental Science-Policy Platform on Biodiversity and Ecosystem Services, IPBES secretariat, Bonn, Germany, 2022.
[38] Nilanjan Ghosh, “Water Scarce Economies and Scarcity Values: Can water futures trading combat water scarcity?”, Observer Research Foundation, ORF Occasional Paper No. 342, January, 2022.
[39] OECD, The Economic Appraisal of Environmental Projects and Policies: A Practical Guide, Paris: OECD, 1995.
[40] A. Nishat and M.F.K. Pasha, “A Review of the Ganges Treaty of 1996”, Paper presented in Globalisation and Water Resources Management: The Changing Value of Water, AWRA/IWLRI-University of Dundee International Speciality Conference, August 6-8, 2001.
[41] Megan Dyson, Ger Bergkamp, and John Scanlon (Eds). “Flow: The essentials of environmental flows. Cambridge”, IUCN, 2003.
[42] Solomon Oluwaseun Akinnawo, “Eutrophication: Causes, consequences, physical, chemical and biological techniques for mitigation strategies”, Environmental Challenges, Volume 12, 2023. https://doi.org/10.1016/j.envc.2023.100733.
[43] Vladimir Smakhtin, Carmen Revenga, and Petra Doll, “Taking into account environmental water requirements in global-scale water resources assessments”, Comprehensive Assessment Research Report 2, (Colombo, Sri Lanka: Comprehensive Assessment Secretariat, IWMI, 2004).
[44] Amandine V Pastor et al., “Accounting for environmental flow requirements in global water assessments”, Hydrology and Earth System Sciences, 18, 5041–5059, 2014, https://doi.org/10.5194/hess-18-5041-2014.
[45] Xingcai Liu et al. “Environmental flow requirements largely reshape global surface water scarcity assessment”, Environment Research Letters, 2021, 10.1088/1748-9326/ac27cb.
[46] John P. Holdren and Paul R. Ehrlich, “Human population and the global environment”, American Scientist (1974) 62: 282-292 Paul R. Ehrlich and Anne H. Ehrlich, “Extinction: The causes and consequences of the disappearance of species”. New York: Random House. (1981.)
[47] Nilanjan Ghosh, “Promoting a ‘GDP of the Poor’: The imperative of integrating ecosystems valuation in development policy”, Observer Research Foundation, Occasional Paper No. 239, March 2020.
[48] IPCC, “AR6 Synthesis Report: Climate Change 2023 — IPCC,” 2023.
[49] Paul R. Ehrlich et al “Extinction: The causes and consequences of the disappearance of species” Robert J Naimanet al, “Legitimizing fluvial ecosystems as users of water”, Environmental Management (2002) 30: 455-467.
[50] Millennium Ecosystem Assessment MA. Ecosystems and human well-being: Synthesis. Washington DC:Island Press. 2005.
[51] James Blignaut, Martin de Wit and Hugo van Zy, “The Economics of Ecosystems and Biodiversity”, TEEB manual for cities–Ecosystem services in urban management, 2011.
[52] Unai Pascual, Patricia Balvanera, Michael Christie, and Brigitte L. G. Baptiste, Summary for Policymakers of the Methodological Assessment Report on the Diverse Values and Valuation of Nature of the Intergovernmental Science-Policy Platform on Biodiversity and Ecosystem Services, IPBES, 2022
[53] Bruce Aylward, Jayanta Bandyopadhyay and Juan-Carlos Belausteguigotia, “Freshwater ecosystem services”, in Ecosystems and Human Wellbeing: Policy Responses 3, ed. K. Chopra, (New York: Island Press, 2005).
[54] William Easter, Nir Becker, and Yacov Tsur, Economic mechanisms for managing water resources: pricing, permits and markets In Asit Biswas, (Ed), Water resources: environmental planning, management and development. New York: McGraw-Hill. 1997.
[55] Ariel Dinar, Mark W Rosegrant and Ru Meinzen-Dick, “Water allocation mechanisms: Principles and examples”, World Bank, World Bank Policy Research Working Paper 1779, Washington, DC, 1997.
[56] Nilanjan Ghosh and Jayanta Bandyopadhyay, “Valuation of mountain and highland waters: an instrument for the promotion of hydro-solidarity”, in Proceedings of International Conference on Waters in Mountains, Megeve: Societe d'Economie Alpestre de la Haute-Savoie (2002).
[57] Robert Johansson et al. “Pricing irrigation water: A review of theory and practice”, Water Policy 4(2): 173-99. 2002; Yacov Tsur et al, “Pricing irrigation water: Principles and cases from developing countries”, Washington: Resources for the Future, 2004.
[58] Andreu Mas-Colell, Michael D. Whinston, and Jerry R. Green, Microeconomic Theory (New York: Oxford University Press, 1995).
Yacov Tsur. and Ariel Dinar, “On the relative efficiency of alternative methods for pricing irrigation water and their implementation”, World Bank Economic Review 11(2): 243-62, 1997.; Robert C Johansson, “Pricing irrigation water: A literature survey”, World Bank, World Bank Policy Research Working Paper 2449, Washington DC: 2000.
[59] James A. Seagraves, and K William Easter, “Pricing irrigation water in developing countries”, Water Resources Bulletin (1983) 4: 663-71
Ariel Dinar, Mark W. Rosegrant and Ruth Meinzen-Dick, “Water allocation mechanisms: Principles and examples”, World Bank, World Bank Policy Research Working Paper 1779. Washington, DC:1997.
Ariel Dinnar and Ashok Subramanian, “Water pricing experience: An international perspective”, World Bank, World Bank Technical Paper 386. Washington, DC:1997.
[60] Rajan Sampath, “Measures of inequity for distribution analysis of large public surface irrigation systems: A welfare theoretic approach”, In Sampath, R. and Robert Young, (Ed.) Social, economic, and institutional issues in Third World irrigation management, Boulder: Westview Press, 1990.
[61] Yacov Tsur and Ariel Dinar, “Efficiency and equity considerations in pricing and allocating irrigation water”, World Bank, World Bank Policy Research Working Paper 1460. Washington DC: 1995.
[62] David Seckler et al., “World water demand and supply, 1990 to 2025: Scenarios and issues”, Colombo: International Water Management Institute, Research Report 19 (1998).
[63] Fakeha Parween, Pratibha Kumari and Ajai Singh, “Irrigation water pricing policies and water resources management”, Water Policy 2021; 23 (1): 130–141.
[64] MOSPI, “Projected Water Demand in India”.
[65] Government of India, Central Water Commission, “Pricing of water in public system in India”,2010.
[66] Government of India, Central Water Commission, “Pricing of water in public system in India”.
[68] Gujarat Water Supply & Sewerage Board, Water Tariff.
[69] Kolkata Municipal Corporation, Schedule of Fees And Charges For The Year Of 2023- 2024.
[70] CHENNAI METROPOLITAN WATER SUPPLY AND SEWERAGE BOARD, Tariff.
[71] Bangalore Water Supply and Sewerage Board, Prorata and Water Tariff.
[72] Hyderabad Metropolitan Water Supply and Sewerage Board, Restructuring and Revision of Water & Sewerage Tariff.
[73] Surat Municipal Corporation, User Charges.
[74] P. Van Der Zaag and H.H.G. Savenije, “Water as an Economic Good: The Value of Pricing and the Failure of Markets”, UNESCO-IHE Institute of Water Education, Value of Water Research Report Series No. 19.. July 2006.
[75] Peter Rogers, Radhika de Silva and Ramesh Bhatia, “Water is an economic good: How to use prices to promote equity, efficiency, and sustainability”, Water Policy 4 (2002): 1-17.
[76] X. Zhang et al., “Water Pricing and Affordability in the US: Public vs. Private Ownership”
[77] John J. Boland, “Pricing urban water: Principles and compromises”, presented at the World Bank seminar on Pricing of Sanitation and Water Services, February 18–19, 1997.
[78] J. Potter, “Dilemmas in water and wastewater pricing: Case study of Bangkok, Thailand”, Department of Urban Studies and Planning, MIT, 1994.
[79] IPCC, “AR6 Synthesis Report: Climate Change 2023 — IPCC”
[80] IPCC, “AR6 Synthesis Report: Climate Change 2023 — IPCC”
[81] Walter Reid and Harold Mooney, “Millennium Ecosystem Assessment. Ecosystems and human well-being: Synthesis”, (Washington DC: Island Press, 2005).
[82] United Nations, NCAVES project countries progress in piloting ecosystem accounting and valuation of ecosystem services.
[83] Nilanjan Ghosh, Suresh Babu, Nitin Kaushal, and Arjit Mishra, “Valuation of Flow Regimes in the Upper Ganges: Understanding Trade-offs between Current Flows and E-Flows”, WWF India, 2018.
[84] Nitin Kaushal et al., “Towards a Healthy Ganga—Improving River Flows Through Understanding Trade-Offs”, Frontiers in Environmental Science, (2019) 7:83, 10.3389/fenvs.2019.00083
[85] Ghosh, Babu, Kaushal, and Mishra, “Valuation of Flow Regimes in the Upper Ganges”
[86] Jayanta Bandyopadhyay, Nilanjan Ghosh and Chandan Mahanta, “IRBM for Brahmaputra Sub-basin: Water Governance, Environmental Security, and Human Well-Being,” Observer Research Foundation, 2016.
[87] Songjun Han, Di Xu, and Zhiyong Yang, “Irrigation-Induced Changes in Evapotranspiration Demand of Awati Irrigation District, Northwest China: Weakening the Effects of Water Saving?”, Sustainability,2017, 9(9), 1531.
[88] Nilanjan Ghosh and Jayanta Bandyopadhyay, “A scarcity value based explanation of trans-boundary water disputes: the case of the Cauvery River Basin in India”
The views expressed above belong to the author(s). ORF research and analyses now available on Telegram! Click here to access our curated content — blogs, longforms and interviews.

Dr Nilanjan Ghosh heads Development Studies at the Observer Research Foundation (ORF) and is the operational head of ORF’s Kolkata Centre. His career spans over ...
Read More +
Soumya Bhowmick is a Fellow and Lead, World Economies and Sustainability at the Centre for New Economic Diplomacy (CNED) at Observer Research Foundation (ORF). He ...
Read More +