-
CENTRES
Progammes & Centres
Location
 PDF Download
Nilanjan Ghosh, “Promoting a ‘GDP of the Poor’: The Imperative of Integrating Ecosystems Valuation in Development Policy,” ORF Occasional Paper No. 239, March 2020, Observer Research Foundation.
1. Introduction
The “growth-fetishism” of the developing world, whose myopic development vision is oblivious to broader ecological concerns, has brought about an inextricable externality: the negative impacts on the ecosystem, its structure and functions, and consequently the services provided by them.[1],[2] These ecosystem services are free of cost, often have the nature of “public goods”[a] and are devoid of markets.[3],[4] Communities dwelling in and around a natural ecosystem tend to have a high degree of dependency on the various goods and services provided by the ecosystem. While such dependency diminishes with distance from the natural ecosystem, humanity has a fundamental reliance on these critical services provided by the ecosystem through various supply-chains.[5] This paper will argue that ecosystem issues should be considered in the broader developmental concerns as human well-being is intrinsically linked to the ecosystem services. The paper aims to understand the importance of the ecosystem in the broader development landscape of the Indian economy through the lens of valuation of ecosystem services.
The publication that first highlighted humans’ reliance on ecosystems services is Man’s Impact on the Global Environment,[6] which provided a list of “environmental services”. This list was later expanded by Holdren and Ehrlich (1974).[7] Even later, Ehrlich and Ehrlich (1981)[8] redelineated these services as “public services of the global ecosystem” and “nature’s services”, and finally coined the term “ecosystem services”.
In the 1990s and 2000s, strands of literature offered various definitions of ecosystem services, which have mostly been divergent particularly in relation to ecosystem processes and functions. For example, while Daily (1997: 3)[9] defined ecosystem services as “the conditions and processes through which natural ecosystems and the species that make them up, sustain and fulfil human life”, the definition offered by Costanza et al (1997: 254)[10] differs: ‘functions’ is “the habitat, biological or system properties or processes of ecosystems”, and services are the benefits derived by humans from these functions. Processes, therefore, are integral components of functions.[11],[12],[13] Scott et al (1998)[14] define processes as “interactions among elements of the ecosystem”, functions as “aspects of the processes that affect humans or key aspects of the ecosystem itself…the purposes of the processes” and services as “attributes of ecological functions that are valued by humans”. Therefore, functions occur biologically and chemically in ecosystems, regardless of human presence. Services, however, are based on human needs, uses, and preferences.[15]
Despite the repeated acknowledgement in scientific literature since the 1970s of the fundamental services rendered by nature to human society, the critical conceptual breakthrough came with the publication of the Millennium Ecosystem Assessment or MA (2005),[16] which classified ecosystem services into four major categories: provisioning (food, water and fishery); regulating (climate regulation and carbon sequestration);supporting (nutrient cycles and crop pollination); and cultural (spiritual and recreational benefits, tourism). The Economics of Ecology and Biodiversity or TEEB,[17] while synthesising work in this field, revised the MA definition and replaced “supporting services” with “habitat services”, and “ecosystem functions” that “are defined as a subset of the interactions between ecosystem structure and processes that underpin the capacity of an ecosystem to provide goods and services”.[18]
Both MA[19] and TEEB[20] helped create an understanding of the direct linkage between human society and biodiversity: for every bit of existence of human society, there is a critical need for the biodiversity as a “stock” to exist, to ensure the “flow” of these ecosystem services. TEEB[21] acknowledged that these ecosystem services constitute the “GDP of the poor”, as their incomes and survival are dependent on the ecosystem, reverberating the idea already expressed in Sukhdev’s 2009[22] paper in Nature.
The Club of Rome’s The Limits to Growth thesis reiterated the Malthusian creed of the “approaching doomsday” of human civilisation through mindless destruction of the natural resource base.[23] At the same time, there was an emphasis on the human response towards better understanding of ecosystems-society interactions by obtaining knowledge through extensive research, global assessments, and conventions. Over time, the accrual of scientific knowledge on human-nature interactions brought about two important recognitions: there is bi-directional causality between ecosystem and the economy;[24] and the conservation of the natural biodiversity is not against development.[25], [26]
At a conceptual level, Pearce and Turner (1989)[27] brought about their magnum opus, Circular Economy that marked a departure from the reductionist linear growth thinking of “take, make, dispose”, to a more holistic paradigm that conceives of the economy as being embedded in the ecosystem. This created a better recognition of the bi-directional causalities between the economy and ecosystem. Subsequently, the Earth Summit of 1992 adopted the Brundtland Commission Report’s definition of “sustainable development”,[b] and opened the Convention of Biological Diversity (CBD) for signature. With the CBD becoming effective from December 1993, international law acknowledged that conservation of biodiversity is a fundamental component of sustainable development.
The economy-ecosystem linkage seemed much clearer with the better delineation of ecosystem services that occurred through MA and TEEB. Referring to Fig. 1, social system creates economic forces and enforces economic actions due to the mismatch between needs and availability. “Actions” on the ecosystem are fundamentally meant to satisfy economic needs: Therefore, “Actions” are “Economic Activities”. “Economic Activities” emerge as interventions on the ecosystem structure and functions, and provide ecosystem services to human society.
Fig. 1: The Social-Ecological System
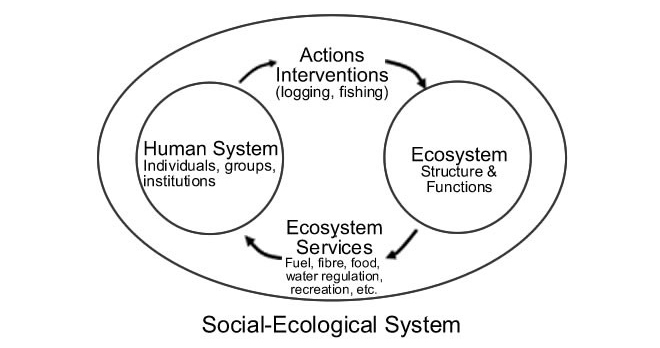
Conservation NGOs often justify their goals through an ecological argument, which tends to lose out in the face of the broad-based development and growth plans of an economy. Such ecological argument has largely moved asymptotically with the human interface of the biological system. Their other argument is largely from an ethical standpoint: as conscientious human beings, committed to value systems that teach us to respect life on earth, we should think of conservation.
Both the ecological and ethical arguments miss out on the most important dimension of conservation, i.e., its economic role. While recognising the importance of food-chain in the context of the ecological balance to protect the integrity of the ecosystem structure and functions in order to ensure the flow of ecosystem services, conservation goals become important. For sustainable management of natural resources like forests, wetlands, and rivers, one needs to set the right conservation goals for flora and fauna, which through their natural functioning, support and sustain these resources, and provide ecosystem services. Societies, economies and businesses therefore depend on biodiversity through a well-defined supply-chain, whose recognition is obscure in the public domain, especially in India and the developing world.[29],[30] This creates an important motivation for valuation of ecosystem services.
The importance of goods and services in an economy is often reflected in terms of their prices which, under efficient market conditions reflect the scarcity value of the good under consideration.[31],[32] Being perceived as “abundant” and accessible, ecosystem services do not have markets, and therefore do not fetch market prices. As a result, the conservation goals set for the natural ecosystem often do not seem to be the priority of human society, and are often subjected to excess exploitation, and eventual degradation and depletion as is the case with commons or common pool resources.[33] Monetary valuation of ecosystem services helps the community understand the importance of ecosystem conservation. On the other hand, valuation of ecosystem services provides a mechanism for optimising investments in biodiversity conservation and directing them to where they are most useful.[34] Given society’s increasing demands for employment, income and infrastructure, development decisions tend to maximise short-term economic gains, resulting in long-term irreversible costs. Valuing ecosystem services often tends to correct that.
A caveat is that values are highly context-specific, with hardly any opportunity for scalability or replication to other contexts or for generic policy prescriptions. Values of the ecosystem services also depend on the scale in which the benefits are obtained. The importance and rationale of valuation of ecosystem services are given below.
While the estimates of the values of the ecosystem services are important, one needs to interpret these values properly. It is not only that the scale effect needs to be kept in mind, but there may be strategic response biases from respondents in many cases. At times, information asymmetries come in the way and are prevalent even when markets are developed. This may be noticed in the case of carbon markets, when post-2009, prices of Certified Emission Reductions (CERs) declined drastically. This does not imply that the actual values of carbon sequestration benefits of ecosystems have declined. This is merely the imperfection of markets emerging from incomplete information.
Internalisation of the values of ecosystem services in policymaking is generally absent in India. While there have been studies on valuing ecosystem services in the country, they have hardly featured in the National Income Accounts. Despite former PM Manmohan Singh acknowledging the need to account for the “GDP of the poor” in a speech in October 2012,[37] there has been little progress. Even as the Ministry of Statistics and Programme Implementation (MoSPI) expert group led by Professor Partha Dasgupta was set up to work out a framework for green national accounts in India, the sensitisation on the economy-ecosystem linkage has hardly happened on the policy front.
This paper examines the various important policy dimensions of ecosystem valuation exercises. As such, valuation of ecosystem services is not an end in itself, but an objective instrument that can help decision-making and policy formulation in various ways. The paper brings in that dimension in the context of development policy. Section 2 presents a survey of literature on valuation of ecosystem services in India. The subsequent section describes cases of valuation of ecosystem services in three different contexts, and alludes of ecosystem dependency of communities’ livelihoods. Section 4 discusses the importance of the ecosystem service valuation exercise through two critical notions: “GDP of the poor” and the “Ecosystem Dependency Ratio/ Index”. The paper concludes by outlining the rationales on embedding valuation of ecosystem services in the development vision of a developing economy like India.
2. Valuation of Ecosystem Services in India
The very exercise of placing monetary values on the services provided by an ecosystem has often been criticised and contested on grounds that it leads to commodification of nature,[38] and that not everything can be expressed in monetary metrics.[39] Such arguments do not diminish the importance of valuation of non-marketed goods and services provided by the ecosystem. This became evident when Costanza et al (1997)[40] estimated the current economic value of 17 ecosystem services for 16 biomes in the range of US$16-54 trillion per year, with an average of US$33 trillion per year which exceeded the global GDP of US$18 trillion. Since then, there has been a replete of studies on valuation of ecosystem services[c] (e.g.). Costanza et al (2014)[41] used the same methods as in the 1997 paper but with updated data, and estimated the total global ecosystem services in 2011 as US$125 trillion per year (assuming updated unit values and changes to biome areas) and US$145 trillion per year (assuming only unit values changed), both in 2007 $US. The biggest criticism against both estimates is the possibility of double counting due to aggregation of provisioning, regulating and cultural services with the supporting services that are responsible for supporting all other ecosystem services.
For India, studies on valuation of ecosystem services are also abundant. According to the Indian Ministry of Statistics and Programme Implementation, the contribution of ecosystem services from forests to the Gross Domestic Product (GDP) of India is 1.23 percent. Some initial estimations include: the water supply benefits of Almora forests;[42] environmental degradation in India;[43] the willingness to pay of urban residents for conservation of Borivilli National Park;[44] the ecosystem services of the Yamuna Basin;[45] the value of carbon storage of Indian forests;[46] and the value of tourism and recreation of the Keoladeo National Park.[47]
Other studies include the ones by Haripriya (1999),[48] which revealed that forest resources contribute around 2.9 percent to the Adjusted Net Domestic product of the country; there was also Manoharan (2000)[49] and Verma (2000).[50] Some interesting studies on mangrove ecosystem services also followed.[51], [52], [53]
A host of studies were published during the initial years of the 2010s, including those by Badola et al. (2010),[54] Vandermeulen et al. (2011),[55] and World Bank (2013).[56] A series of comprehensive assessments of values of Indian forests’ ecosystem services have also been conducted.[57],[58],[59] Under the TEEB-India initiative, Brij Gopal and Dinesh Marothia’s study[60] on the economic analysis of Ken-Betwa link talked of Panna Tiger Reserve valuation, but it entailed a sketchy account of taking averages of values of two forests from Verma et al (2015),[61] namely, Kanha and Ranthambor. There are many other TEEB-India studies that have followed conventional approaches, e.g. the one in Uttara Kannada district of Western Ghats, though based on field based evidence, provides some estimates on provisioning services like timber, fuelwood, and non-timber forest products, regulating service like carbon sequestration, and recreation as cultural service.[62] The recent accounts on ecosystem services valuation in India include studies conducted for Nagarhole National Park in Karnataka,[63] Pakke Tiger Reserve in Arunachal Pradesh,[64] and for Terai Arc Landscape (TAL) in Uttarakhand,[65] and the phase 2 of the tiger reserve’s ecosystem service valuation.[66]
While the values emerging from these studies have been interpreted in different fashions, literature linking the values to the broader developmental paradigm is absent in Indian policymaking. India is also lacking in a better articulation of the ecosystem-livelihoods and the ecosystem-economy linkage in the broader development paradigm.
This section highlights three different applications of valuation of ecosystem services at three different scales and contexts: the Kunigal wetlands in the southern state of India, Karnataka; the Terai Arc Landscape (TAL) in Uttarakhand; and the Indian Sundarbans Delta (ISD).[d] Various ecological economic valuation methods have been used to arrive at the values shown in Tables 1, 2 and 3. The methods entail a combination of various approaches: from revealed preference approaches to benefit transfers (getting values from past estimates on similar physical set-ups) to production function approaches (mathematical economic and econometric methods).[67] (See appendix for a summary of the methods.)
Wetlands play a vital role in: contributing to food security by enabling direct availability of products such as fish, crops, wild fruits and vegetables; providing cash income from sale of raw materials and processed products; and contributing to increased crop and livestock yields as a result of improved productivity from use of water, silt, and through climate moderation. They also support various regulating (carbon sequestration, microclimate regulation) and cultural services (tourism).
Fig. 2
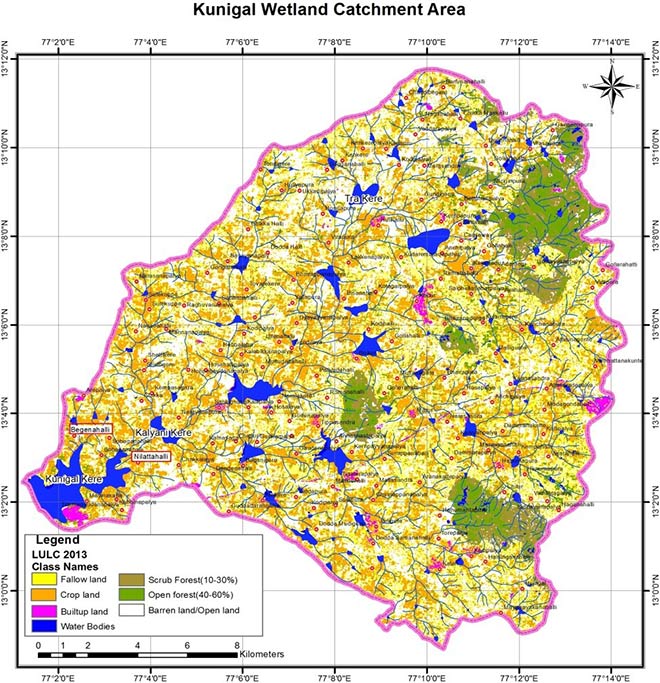
Kunigal wetland is a peri-urban wetland located between 13.02°N and 77.03°E at an average elevation of 773 meters in Kunigal, Tumkur district of Karnataka. The lake has a total spread area of 416.20 ha and a gross water storage capacity of 532.2 MCFT. The lake is mainly fed by the Hemavathi River and from the rainwater from the catchment area of 33,914 ha. The catchment mainly includes agricultural land, barren land, and scrubland. The Lake provides habitat for fish-breeding, water for domestic and agriculture, support for local biodiversity including migratory birds, aquatic vegetation, flood control, purification of wastewater, and groundwater recharge, among other services. The lake is also an important religious place, with a shrine dedicated to the local deity, the Someshwara temple.
The biodiversity of the lake includes 63 species of resident and migratory species of birds, and many fish species as well. The local people have been using the lake resources since ancient times to sustain their livelihoods. At present, the lake is leased to a fishing cooperative to culture and harvest commercial fish.
The lake is surrounded by a number of villages and the town of Kunigal. The current study selected three villages in the lake’s vicinity: Bagenahalli, Neelathalli and Mavanakatte playa. The total population of these villages were 1903 (920 males and 983 females) in 530 households in 2011. The villages have a primary school and there are no high schools, secondary schools or college.
A vast majority of the people living adjacent to the lake areas directly use the wetland resources for their sustenance. The valuation of Kunigal Lake in Tumkur is carried out by considering seven ecosystem services: water for agriculture, domestic water supply, fishery, and fodder, as provisioning services on one hand; and water purification, carbon sequestration, and micro-climate regulation as regulating services, on the other. This valuation study has also estimated the potential benefit annually if tourism is developed, as tourism is not yet developed in that region. (See Table 1 for a summary of the findings.)
Table 1: Valuation of Selected Ecosystem Services of Kunigal Wetlands
| Ecosystem Service | Value (in INR million) | Classification | % of each | Level |
| Domestic water use | 25.56 | Provisioning | 2.96 | Meso |
| Water for agriculture | 11.8 | Provisioning | 1.37 | Local/ Micro |
| Fishery | 8.6 | Provisioning | 1.00 | Local/ Micro |
| Fodder | 1.4 | Provisioning | 0.16 | Local/ Micro |
| Water purification | 81.21 | Regulating | 9.41 | Meso |
| Carbon Sequestration | 749.26 | Regulating | 67.41 | Global |
| Micro-Climate Regulation | 152.61 | Regulating | 17.69 | Meso |
| Total Value of Existing Ecosystem Services | 1030.45 | |||
| Potential Tourism benefit | 159.37 (with 137.26 million as potential revenue) | Cultural |
Source: https://d2391rlyg4hwoh.cloudfront.net/downloads/the_bid_for_the_natural_sponge_.pdf
The wetlands provide 24 percent higher value than the average incomes of the households. This creates a clear case for conservation, as the community at the local and meso levels will lose out 24 percent above their annual incomes if the lake is lost.
In the process, this valuation study contributes to tackling under-investment in environmental assets through better economic analysis for environmental investments, including mobilisation of government and donor resources for environment. In particular, it provides lessons for sustainably managing environmental resources to benefit local community which uses the resources as sources of livelihood as well as improving their management for sustainable use.
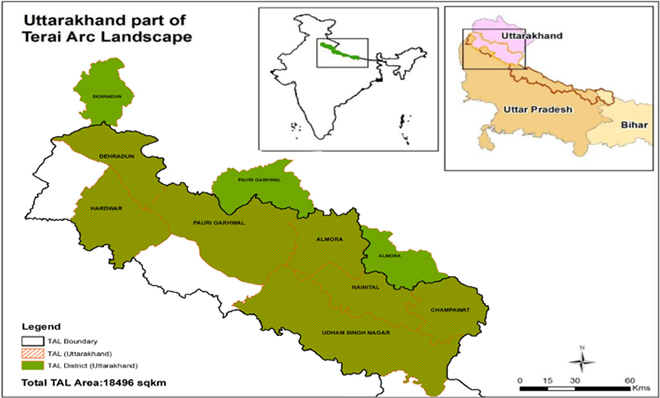
The Terai Arc Landscape (TAL) in Uttarakhand is among the most densely populated rural areas in the country with more than eight million people. During the last two decades, the population in TAL has increased by as much as 54.2 percent, which is nine percent above the national average. Most of the poorer communities in TAL depend on the forest for their subsistence.
Only seven percent of the population use purchased fuel such as liquefied petroleum gas (LPG), coal and kerosene; the rest use firewood collected from the forests. (Note that the entire districts of Dehradun, Hardwar, Pauri Garhwal, and Almora do not fall in the TAL region. See Fig. 3.)
Fig. 3: TAL in Uttarakhand
Values of nine ecosystem services of the TAL have been estimated: provisioning services like water (used for agriculture, hydropower, and drinking water); fuel wood, and fodder; regulating services like carbon sequestration and microclimate regulation; and cultural services like tourism (nature and pilgrimage). They were estimated in the 2005-06 prices using standard valuation methods. The values of 2010-11 and 2015-16 were calculated using Wholesale Price Index (WPI) as deflators. (See Table 2.)
Table 2: Valuation of Selected Ecosystem Services in TAL in Uttarakhand
| Item | Value in 2005-06 (In INR million) |
| Water for Agriculture | 13886.82 |
| Water for Hydropower | 440.68 |
| Carbon Sequestration | 66078.20 |
| Tourism (Corbett) | 3680.00 |
| Drinking Water | 2785.64 |
| Fuelwood | 41995.50 |
| Microclimate Regulation | 48011.40 |
| Fodder | 3015.54 |
| Religious Tourism in Hardwar | 47623.51 |
| Total | 227,517.28 |
Source: Ghosh et al (2017)[68]
These are conservative estimates for various reasons. First, the analysis is limited to a few selected ecosystem services, and was not extended to obtain the full gamut of the services provided by the ecosystem. Only nine ecosystem benefits are considered, and not the other ecosystem services like climate regulation, flood control, and many other services that other studies considered while calculating economic valuation, for instance, of select Tiger Reserves in India.[69] Second, there remains the problem of double counting while considering the supporting services of the ecosystem. To remove such a possibility, this analysis did not consider any supporting service. Third, this paper considered only certain aspects of the cultural services. For instance, religious tourism has been considered only for Hardwar, and nature tourism has been taken only for Corbett Tiger Reserve and the buffer and adjoining areas where the tourism has developed. There are many other aspects of nature tourism, e.g. Nainital, by itself, is a major tourist destination. Fourth, this analysis did not consider the value of the benefits obtained by communities downstream of the landscape. Carbon markets have been taken at one of the lows at US$ 10 per tonne of CO2.
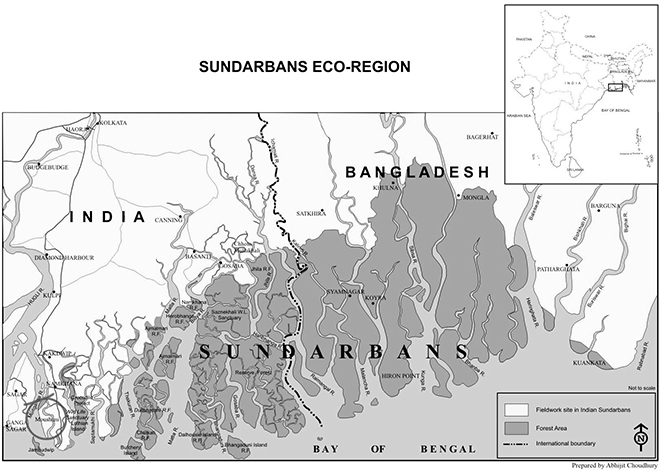
The Indian Sundarbans Delta (ISD) is one of the most vulnerable delta regions in the world. It is prone to extreme events, growing population pressures, and depleting ecosystem services. The ISD faces bio-physical challenges in the form of increased sea surface temperature, sea level rise, changes in the precipitation patterns, and increasing frequency of cyclone events.
In the period 2002-2009, Relative Mean Sea Level (RMSL) in the ISD increased at the rate of 12 mm/year. Considering the record from 1990 to 2015, the rate of relative sea level rise comes close to 8 mm/year, which is significantly higher than the rate of 3.14mm/year observed during the decade prior.[70],[71] Analyses of cyclonic events over a period of 120 years indicate a 26-percent rise in the frequency of high to very high intensity cyclones over this time period.[72] .ual e mms annually and India. It is a eded here.ast India Company..The World Wildlife Fund (The WWF) India has proposed an alternative scenario for the ISD.[73] The vision is about an adaptive management system to not only cope with the predicted onslaught of devastating changes, but also to convert adversity to opportunity for improving people’s lives and rehabilitating the region’s ecological health.
The main points of this vision are: encouragement of phased and systematic outmigration from the vulnerable zone (planned retreat), and restoration of mangrove forests in the vulnerable zone. It is believed that only when a safer habitat is provided to the people of the region, along with proper sources of livelihood, will it be possible to restore mangrove forests in the vulnerable zone and thereby bring about partial ecological rehabilitation of the region.
Fig. 4
The question that arises is whether pursuing such a vision can prove beneficial over the current or the Business-As-Usual scenario. This section presents the economic argument by outlining the costs and benefits, and net benefits that are associated with either of the scenarios, described as Business-As-Usual (BAU) and Vision scenarios.[74]
Business-As-Usual (BAU) Scenario: This is a scenario where the community does not relocate. While assuming that the economic condition of the vulnerable zone remains as prevalent, this analysis presents the figures of the stream of benefits that may be accrued from 2050 to 2100. It is assumed that the BAU scenario is affected by natural disasters, and this paper estimates what might happen if a moderate disaster affects the zone during this period. The limitation of this analysis is that it considers an “average” intensity of an event, between “high intensity” and “low intensity”.
Vision 2050 scenario: The scenario places the population from the vulnerable zone already having moved to the stable zone, and the mangrove forests have been restored in the former. In the process, the costs are not going to be incurred at the same time, but over a longer period. The same is true for the various benefits. It needs to be borne in mind that it is not the same generation that may eventually obtain the benefits. It is possible that over the interim period, only certain sections of a population might choose to move to the newly developed area. The vision assumes the impacts from natural calamity in their current form have been eliminated. Therefore, there is a host of costs that arise from building infrastructure, re-skilling, mangrove restoration, corpus creation, and other activities. The benefits include the incomes from alternative employment, eco-tourism, ecosystem services of mangrove, and possible incomes from access to the regenerated mangrove forest.
For the implementation of the Vision 2050, the community will have to relocate, and proper infrastructure constructed. Those willing to relocate have to be re-skilled so that they can find alternative employment. While most of those in the vulnerable zones are engaged in agricultural activities, one may safely assume that there will be two members of each household who would be working in the stable zone: one in the service sector, and the other finding skilled employment. There are various costs associated with the mangrove regeneration in the vulnerable zone. Mangrove forest, by itself, has its associated ecosystem benefits. At the same time, the income from the BAU scenario also emerges as the opportunity cost, as that benefit will no longer be obtained.
Therefore, the following ecosystem services from the regenerated mangroves have been considered: carbon sequestration (regulating service); fishery (provisioning service); storm surge protection (regulating service); tourism (recreational service); honey (provisioning service); prawn larva (provisioning service); and crab (provisioning service). Standard valuation methods in the form of surrogate pricing, indirect values, and benefit transfer have been used to obtain the values. (See Table 3.)
Table 3: Value of Flows of Ecosystem Services from 2050 to 2100 (in INR billion)
| Ecosystem Service | Current Value of flows of benefits |
| Carbon Sequestration | 695380.66 |
| Fishery Production | 84621.69 |
| Storm protection | 327033.43 |
| Tourism Benefits | 54.89 |
| Fuel wood | 19778.68 |
| Honey | 23808.79 |
| PL | 10023.39 |
| Crab | 45836.02 |
| Total | 1206537.55 |
Source: Ghosh et al (2016)[75]
On the other hand, there will be incomes generated through employment in service sector, and skilled employment; these figures were arrived at using field data and necessary WPI adjustments. Under the net benefit flows, the total value of the flow of the economic and the ecosystem benefits generated from 2050 to 2100 is presented, minus the costs (most of which appear in the form of capital expenditures). (See Table 4.)
Table 4: Vision 2050 Scenario: Statement of Flows of Benefits and Costs from 2050 to 2100
| Benefits | INR billion |
| Total Value of Ecosystem Services (a) | 1206537.55 |
| Total Income Generated out of Service Sector Employment (b) | 460781.74 |
| Total Incomes from Skilled Employment (c) | 726457.70 |
| Total Flows of Benefits from 2050 to 2100 (A= (a)+(b)+(c) | 2393776.98 |
| Costs | |
| Total cost for mangrove regeneration (d) | 91.02 |
| Loss in Incomes from BAU Scenario (e) | 172306.27 |
| Total Cost of Residential Constructions (f) | 2024.89 |
| Cost of establishing 3 hospitals (g) | 123.43 |
| Cost of establishing 5 secondary schools (h) | 6.17 |
| Cost of IT Training Institute (i) | 4.11 |
| Cost of ITI (j) | 4.11 |
| Corpus (k) | 16457.91 |
| Total Flows of Costs (including sunk costs) from 2050 to 2100 (B = sum( (d) to (k)) | 191017.92 |
| Flows of Net Benefits from 2050 to 2100 (A-B) | 2202759.05 |
Source: Author’s estimates
Table 5: Current Expected Value of Flow of Net Benefits from 2050 to 2100
| Scenario | Current Value of Net benefits (INR trillion) |
| Business-as-usual | 172.31 |
| Vision 2050 | 2202.76 |
Source: Ghosh et al (2016)[76]
Given present assumptions, the current value of the net benefits from the Vision scenario (INR 2202.7 trillion) is 12.8 times that of the BAU scenario (INR 172.31 trillion) during 2050-2100. This shows that in the long run, retreat from the vulnerable region, and ecosystem regeneration under the given circumstances will result in manifold net benefits. Additionally, if one takes the rate of land subsidence into the sea over the last 50 years, and a higher rate of temperature rise to 2.5oC, the vulnerable regions of the ISD might no longer exist. In that case, the value of net benefits will be reduced to zero from a particular point in time.
Therefore, this is a justification of “managed and strategic” retreat in the Indian Sundarbans delta from an economic standpoint. This approach and the framework have policy implications for all such places that are faced with the situation where the combined value of assets, products and services—due to climate change—have already fallen or will fall in a future timeframe, below the cost of protecting the place.
Worldwide, population movement has been an integral component of large infrastructure development projects. At times, movement of population has been conflict-free and has led to development of the affected population.[77] There is no dearth of examples in this regard. Here, the framework essentially talks of a conflict-free organic movement resulting in human development. However, for that to happen, the various stakeholders involved in the process need to be convinced of the same by properly highlighting the financial gains, as has been shown in this analysis. Such strategic retreat has the potential to replace a chaotic and deteriorating situation with the opportunity for ecological rehabilitation along with human wellbeing, in effect, turning adversity into opportunity.
However, the important issue is that of economic valuation of potential ecosystem services which has been plugged in the cost-benefit analysis framework to justify strategic and managed retreat. The other important element to be noted is that this exercise has concerned itself with long-term costs and benefits. This implies that while development planning needs to consider the dimension of impact of projects across spaces, it is no less important to consider the temporal dimension. Such cost-benefit framework could be used to justify retreat in their Generic Adaptation Decision Framework (GADF).[78] Such an adaptation mode of organic retreat proves rational under situations where long-term costs of in-situ adaptation are prohibitively high.
3. GDP of the poor: The Ecosystem Dependency Index/Ratio
The estimates of the ecosystem services presented in the earlier section of this paper are conservative. Yet, they are enough to indicate that the contribution of the TAL ecosystem in Uttarakhand to the human community is at least INR 390 billion (US$ 6 billion) in 2015-16, which is higher than the combined income of the people of the Landscape. Similarly, a small ecosystem like the Kunigal lake provides its community as much as US$ 17 million in 2015-16.
In this context, promoting the measure of the “GDP of the poor” becomes relevant, as a calculation of the value of ecosystem services. The poor, to begin with, are more dependent on the ecosystem services than the rich. (See Fig. 5.)
Fig. 5
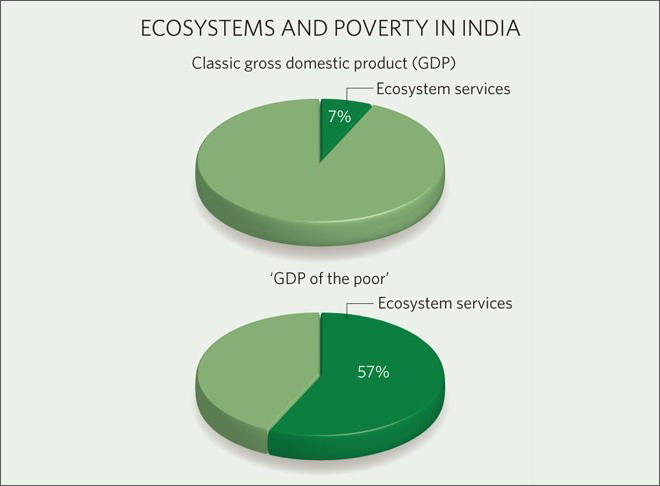
As discussed briefly earlier, the composite values of ecosystem services are called the “GDP of the poor” because these ecosystem services are the sources of livelihoods of the poor, and which standard GDP figures fail to account for. Conversely, standard GDP definition is unable to account for the losses in ecosystem services that may have an impact on the economy as a whole through existing value-chains. Some economists have proposed different ways of correcting this anomaly.[80]
Given the high degree of dependence that the poor have on ecosystem services, they are also the worst hit with depletion and degradation of the natural resource base providing these services.[81] Therefore, the contribution of natural resources and ecosystem services to livelihoods and well-being should be estimated and recognised by delineating a “GDP of the poor”. Notionally as well as in practice, a “GDP of the poor” encompasses the various sources of nature from which the poor in the developing world draw their means of livelihood: land, freshwater, soil, biodiversity, and marine resources. The wealthy people extract more resources than the poor, even as the poor—especially the rural poor—have more direct and higher degree of dependency on the ecosystem services.[82] This analysis offers a numerical measure of this economic dependency of communities and define it as ecosystem dependency ratio or index: the ratio of the sum of values of ecosystem services and total incomes of the economy of the ecosystem under consideration. In other words, the ecosystem dependency ratio is:
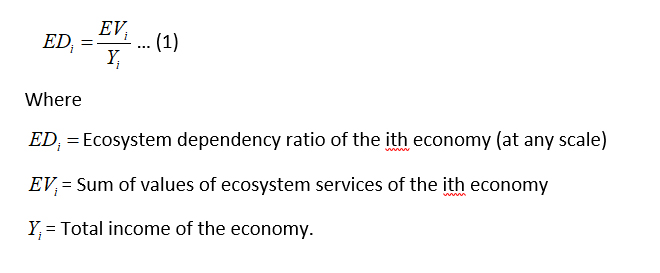
In Kunigal, the ecosystem dependency ratio was 1.24 in 2015-16. In 2005-06 in TAL, it was 1.19. However, according to this paper’s estimates, the ecosystem dependency ratio has been diminishing in TAL, as estimated in 2011-12 and 2015-16. The ED-ratio in 2011 is 0.52, and in 2015-16, it is 0.41. This decline owes to the increase in the incomes from other sources—especially the tertiary ones—that are not dependent on these nine ecosystem services. The ecosystem services add 40 percent more benefits to the earnings of the local community.
Equally important, the ecosystem dependency ratio of the poor in TAL will be substantially higher than this average ED. Indeed, more than half of the population in the TAL live below the poverty line and an earning member of a household earns as little as US$ 1.9/day. The ecosystem dependency of these households is higher than those earning average per capita incomes. Therefore, any policy towards land-use change in the landscape and ground actions leading to land use change in the wildlife habitats and corridors should be considered carefully. Such analysis must take into account the scarcity value of the ecosystem services, i.e. the economic value loss with ecosystem service loss, as it is the poor who suffer the most from the loss in ecosystem services.
While formulating plans for land use change, one needs to assess how much of the habitat will be destroyed. In those cases, poorer people will lose out a substantial amount of their “GDP” or “incomes” provided by the ecosystem, and they need to be compensated for that loss. However, this compensation would not take into account other economic impacts from the loss of services such as flood control, water recharge, and soil retention, which could lead to huge costs due to disasters incurred such as floods and landslides.
The case with the Indian Sundarbans Delta will be different. It is one of the most poverty-stricken regions of the country, with some households completely reliant on fisheries, honey collection, and other provisioning services. Their ecosystem dependency ratio may tend to be infinite. However, the idea of bringing in the context of the values of ecosystem service values in the Vision scenario is that, first, the role of the “GDP of the poor” in future development/ adaptation scenarios becomes important, and their importance needs to be highlighted in numerical terms. Second, it may be seen even in a scenario where service sector employment and incomes are being accrued, the values of the ecosystem services contribute around 55 percent of the total benefits, thereby revealing a greater than unity ecosystem dependency ratio in terms of benefit flows.
It is therefore important that the results of such an analysis are shared with policymakers to demonstrate that, in terms of economic development, it is critical to take into account the net cost of losing ecosystem services and the impacts of this on the rural poor. If valuation from a long-term development perspective is undertaken, then it will be clear that the cost of damaging ecosystems and disrupting their services will be higher than the short-term gains from some planned projects.
4. Key Implications on Policy
By itself, an ecosystem service valuation exercise is insufficient as the more crucial challenge lies in interpreting the monetary values of those services, which occur at various scales. Some of the services that are mostly provisioning in nature occur at local levels and have direct bearing on local livelihoods (e.g., food, fodder, medicinal plants, and various NTFPs that are used for direct consumption). Meanwhile, there are other services that have market and trade linkages; and still others, like carbon sequestration, are “global common goods.” The scales of operation of these services are reflected in values, and they need to be kept in mind while attempting an interpretation.
The policy implications of this exercise range from social and economic to ecological, and have an impact on finance, development, judicial proceedings, and institutional and ethical considerations of human endeavours.
5. Conclusion
Formulating a new strategic direction for the country’s development paradigm should entail integrating the sustainability vision. This implies that the trinity of equity, efficiency and sustainability—often seen as irreconcilable in the traditional goals of economic development—need to be placed together in one frame. In turn, this requires economies to look at the values of the services provided by the ecosystem which are endangered by rampant and thoughtless “development”. Indeed, the footprint of a myopic development paradigm can manifest through an elongated value-chain that goes back to the ecosystem.
At the same time, merely looking at short-term values may be insufficient. The values of the short-run benefits—which businesses often consider in justifying projects—become obsolete in the medium and long term. What might remain after the short run are the costs incurred from lost ecosystem services that affect the broader human endeavours including livelihoods and businesses. Such impact might not only be a temporal phenomenon, but a spatial one, too. While myopic development affects the functioning of an ecosystem, and consequently the services it provides, the impact of these ecosystems’ operations are not confined locally. The “ripple effect” can be extensive.
Unfortunately, in India, even linear infrastructure projects like roads, railway lines, and pipelines, often fail to take into consideration the losses due to ecosystem service across space and time. The case of the Sundarbans delta shows the ways that long-term values should be integrated for sustainable development planning or adaptation to global warming and climate change. This offers a way for policies to reconcile equity, efficiency, and sustainability.
Annex: Summary of Methodology and Data Sources
| ES Classification | Type of Ecosystem Service | Valuation Approach | Methodology | Data Sources |
| Provisioning Services | Water for agriculture | Production function approach | The Value of Marginal Product of water is multiplied with the total water use to obtain the value of its contribution. Eventually, panel data regressions are used to obtain the slope coefficiencts. | District-level area and production data in all cases be obtained from the Season and Crop Report and Department of Economics and Statisticsof each state. |
| Food, medicinal plants, Fisheries | Market price method | Market prices of the food, fish medicinal plant items or their substitutes (surrogate markets) are considered and multiplied with the quantities to obtain the values of the various food items. | The data are obtained from primary surveys, and benefit transfer methods. | |
| Water for urban-industrial including domestic use | Combination of market prices and benefit transfer method |
The municipal operations and maintenance costs are used andthe economic cost of procurement and distribution per unit and the environmental costs are added. Value of consumer surplus are obtained from past demand estimations and added. The costs need to be adjusted with the Wholesale Price Index to arrive at the value of urban-industrial water. |
Data are obtained from Municipal corporation, past estimates, and the Reserve Bank of Indiadatabases (for WPI). | |
| Fuel, fodder, and other NTFPs | Market price and surrogate market methods. | In case they are marketed, the market price is multiplied with the quantity, and if not marketed, surrogate market methods will be used to arrive at the values. | For each of the services like fuel, fodder, and various NTFPs primary data on quantities through primary surveys are obtained. | |
| Regulating Services | Water purification | Market price | This value is obtained byestimating water-use by using population data from Census 2011 and making necessary projections. These figures are then multiplied bythe cost of water treatment, from market prices. | Data are obtained from the municipality and local governments and water treatment plants. |
| Storm surge protection | Avoided cost | Avoided costs of losses to property are determined for ISD by taking considering that mangroves may offer around 35% protection to property and life, based on the available evidence. Since we are not getting into valuation of human life, we confine the storm protection functions of mangroves to protection to property. At the same time, the storm protection function extends around 15 km beyond the mangrove region. Assuming that the value of property, agricultural incomes, and aquaculture incomes per hectare is the same as the BAU scenario even across those regions, we have obtained the value of storm protection here. | Primary and secondary data on property prices from local agents and local government are obtained, along with values from the BAU scenario. | |
| Carbon sequestration | Through InVEST and market prices | Carbon stocks are estimated with InVEST and the quantity is multiplied with the price of carbon credits in voluntary markets or with VER credits. | Data will be obtained from the Forest Department and voluntary carbon markets. | |
| Micro-Climate Regulation | Benefit Transfer | Multiplying the mean value per unit area with the total area. | Data are obtained from meta-analysis. | |
| Cultural Services | Tourism and other recreational values | Travel Cost Method | The sum of the average tourist spending and the consumer surplus provided the value of the landscape from the perspective of tourism | Data are obtained from the past estimates, government departments, and questionnaire survey. |
| Religious tourism | Travel Cost Method | Taken as total revenue but since income effects areprevalent, consumer surplus has not been added | Data are obtained from the past estimates, government departments, and primarysurvey. |
Endnotes
[a] A public good is a commodity or service provided to all members of a society, either by the government or by a private individual or organisation. Due to this nature of the provision, consumption of a public good does not reduce its availability to others and no one is deprived of it. That is why it is said to have the characteristic of “non-excludability” and “non-rivalry” in consumption.
[b] According to Brundlandt Commission report, ‘sustainable development’ is “… development that meets the needs of the present without compromising the ability of future generations to meet their own needs”.
[c] E.g. Sukhdev 2009; Liu et al 2019; to name a few. See in notes iv and xxxvi
[d] All the applications were conducted by the author while advising the Ecological Economics practice of World Wide Fund for Nature, India. The summary results of the TAL and ISD are available in Ghosh et al (2016 and 2017).
[e] The Himalayan states that participated in the Conclave are Jammu and Kashmir, Uttarakhand, Himachal Pradesh, Sikkim, Arunachal Pradesh, Meghalaya, Nagaland, Tripura, Mizoram, and Manipur. West Bengal is also classified as a Himalayan state, but there was no representation from the State in the Conclave.
[1] Dong, S., J. Bandyopadhyay, and S. Chaturvedi. Environmental Sustainability from the Himalayas to the OceansStruggles and Innovations in China and India. Springer, Singapore. 2017.
[2] Ghosh, N. “Sustainability as Corporate Strategy: Importance of the Values of Ecosystem Services for Businesses”, in Ray, P. et al (eds.) Economics, Management and Sustainability: Essays in honour of Anup Sinha. (Singapore: Springer). 2018.
[3] Vatn, A. and D. Bromley. “Choices without Prices without Apologies”, Journal of Environmental Economics and Management, 26 (2), 129-148. 1994.
[4] Sukhdev, P. Costing the earth. Nature, 462(7271):277. 2009.
[5] Millennium Ecosystem Assessment or MA. Ecosystems and human well-being: Synthesis. Washington DC:Island Press. 2005.
[6] Study of Critical Environmental Problems (SCEP). Man’s Impact On The Global Environment: Assessment and Recommendations for Action. MIT Press, Cambridge, 1970.
[7] Holdren, J. P., and P.R. Ehrlich. “Human Population and the Global Environment: Population Growth, Rising per Capita Material Consumption, and Disruptive Technologies Have Made Civilization a Global Ecological Force”, American Scientist, 62: 282-292, 1974.
[8] Ehrlich, P.R. and A.H. Ehrlich. Extinction: The Causes and Consequences of the Disappearance of Species. Random House, New York. 1981.
[9] Daily, G.C. “Introduction: What are ecosystem services?”. Pages 1-10, in: Daily, G.C. (Editor) Nature’s Services: Societal Dependence on Natural Ecosystems. Island Press, Washington, DC. 1997.
[10] Costanza, R., R. d’Arge., R. de Groot, S. Farber, M. Grasso, B. Hannon, K. Limburg, S. Naeem, R. V. O’Neill, J. Paruelo, R. G. Raskin, P. Sutton, and M. van den Belt (1997): “The value of the world’s ecosystem services and natural capital”. Nature,387, 253–260.
[11] Ibid.
[12] Scott, M.J., G.R. Bilyard, S.O. Link, C.A. Ulibarri, and H.E. Westerdahl.“Valuation of ecological resources and functions”, Environmental Management 22 (1), 49-68. 1998.
[13] De Groot, R.S., M.A. Wilson, and R.M.J. Boumans.“A typology for the classification, description, and valuation of ecosystem functions, goods, and services” EcologicalEconomics,41 (3), 393-408. 2002.
[14] Ibid.
[15] Hawkins, K. “Economic Valuation of Ecosystem Services”, mimeo. 2003.
[16] MA. Ecosystems and human well-being: Synthesis. Washington DC:Island Press. 2005
[17] TEEB The economics of ecosystems and biodiversity. TEEB manual for cities–Ecosystem services in urban management, 2011.
[18] De Groot et al “Integrating the ecological and economic dimensions inbiodiversity and ecosystem service valuation”.
[19] Op Cit.
[20] Op Cit.
[21] Ibid.
[22] Op cit.
[23] Meadows, D.H., D.L. Meadows, J. Randers, and W.W. Behrens III (Eds.) The Limits to Growth: A Report for the Club of Rome’s Project on the Predicament of Mankind. Universe Books, New York. 1972.
[24] Georgescu-Roegen, N. “The Entropy Law and The Economic Problem”, In: Daly, H. E. and K.N. Townsend (eds.) Valuing the Earth: economics, ecology, ethics. The MIT Press Cambridge, Massachusetts, 75-88. 1993.
[25] Folke, C. “Resilience The Emergence of a Perspective for Social-Ecological Systems Analyses”, Global Environmental Change, 16, 253-267. 2006.
[26] Ghosh, N. and E. Uddhammar “Tiger, Lion and Human Life in the Heart of Wilderness: Impact of Institutional Tourism on Development and Conservation in East Africa and India”, Conservation and Society, 11 (4), 375-90. 2013.
[27] Pearce, D.W. and R.K. Turner. Economics of Natural Resources and the Environment. Johns Hopkins University Press. 1989.
[28] Resilience Alliance. Assessing and Managing Resilience in Social–Ecological Systems: Supplementary Notes to the Practitioners Workbook, Vol. 2, version 1.0, Resilience Alliance. 2007.
[29] Ghosh, N. “Making Conservation Everybody’s Business”, OP-ED column in abplive.in, November 6. 2015.
[30] Ghosh, N. “Sustainability as Corporate Strategy: Importance of the Values of Ecosystem Services for Businesses”, in Ray, P. et al (eds.) Economics, Management and Sustainability: Essays in honour of Anup Sinha. (Singapore: Springer). 2018.
[31] Panayotou, T. Empirical tests and policy analysis of environmental degradation at different stages of economic development (No. 992927783402676). International Labour Organization.1993.
[32] Ghosh, N. and J. Bandyopadhyay “A Scarcity Value based Explanation of Trans-boundary Water Disputes: The case of the Cauvery Basin in India”, Water Policy, 11 (2), 141-67. 2009.
[33] Hardin, G. “The Tragedy of the Commons”, Science, 168: 1243-48.
[34] Kinzig, A., C. Perrings, and B. Scholes. Ecosystem services and the economics of biodiversity conservation, 2007.
[35] Ghosh, N., D. Ghose, G. Areendran, D. Mehra, A. Paliwal, K. Raj, K. Rajasekariah, A. Sharma, A.K. Singh, S. Srinivasan, and S. Worah. “Valuing Ecosystem Services at the Scale of a large mammal landscape: The Case of the Terai Arc Landscape in Uttarakhand”, PRI Issue Brief No. 2, WWF India. 2017.
[36] Liu, P., W. Li, Y. Yu, R. Tang, X. Guo, B. Wang and L. Zhang. “How much will cash forest encroachment in rainforests cost? A case from valuation to payment for ecosystem services in China”, Ecosystem Services, 38, 100949. 2019.
[37] Singh, M. Inaugural address delivered at the High Level Segment of the 11th CoP to the Convention on Biological Diversity, Hyderabad, October 16, 2012.
[38] O’Neill, J. “Markets and the Environment”, EPW, 36(21), 26 May, 2001.
[39] Vatn and Bromley (1994)
[40] Ibid.
[41] Costanza, R., P. Sutton,S. vander Ploeg, S.J. Anderson, I. Kubiszewski, S. Farber, andR. Kerry Turner. “Changes in the global value of ecosystem services”. Global Environmental Change, 26, 152-158. 2014.
[42] Chaturvedi, A. N. “Environmental value of forest in Almora” in Anil Agarwal (ed) Prices of forests. 1992.
[43] Brandon, C., and K. Hommann. The cost of Inaction: Valuing the Economy-wide cost of Environmental Degradation in India, United Nations University. In Proceedings of the Symposium on Global Sustainability, Tokyo. 1995.
[44] Hadker, N., S. Sharma, A. David, and T.R. Muraleedharan. “Willingness-to-pay for Borivli National Park: evidence from a contingent valuation”. Ecological Economics, 21(2), 105-122. 1997.
[45] Chopra, K. and G.K. Kadekodi. Natural resources accounting in the Yamuna basin: Accounting for forest resources. Ministry of Environment and Forests, India. 1997.
[46] Kadekodi, G. K., and N.H. Ravindranath. “Macro-economic analysis of forestry options on carbon sequestration in India”. Ecological Economics, 23(3), 201-223. 1997.
[47] Chopra K. “The valuation of Biodiversity within Protected Areas: Alternative Approaches and A Case Study”. Discussion Paper Series No. 3, Institute of Economic Growth, New Delhi. 1998.
[48] Haripriya, G. S. Integrating forest resources into the system of national accounts in Maharashtra, India. Environment and Development Economics 5 (1): 143–156. 2000.
[49] Manoharan, T. R. “Natural Resource Accounting : Economic Valuation of Intangible Benefits of Forests”. RIS Discussion Paper # 04/2000, Research and Information System for the Non-Aligned and Other Developing Countries, New Delhi. 2000.
[50] Verma, M. Economic valuation of forests of Himachal Pradesh. Report on economic component of Himachal Pradesh forestry sector review, 7, 2000.
[51] Hirway, I. and S. Goswami. Valuation of Mangroves in Gujarat, Centre for Development Alternatives, Ahmedabad, Gujarat Ecology Commission, Vadodara, pp. 1 – 97. 2004.
[52] Badola, R., and S.A. Hussain. “Valuing ecosystem functions: an empirical study on the storm protection function of Bhitarkanika mangrove ecosystem, India”, Environmental Conservation, 32(1), 85-92. 2005.
[53] Das, S. and J. R. Vincent Mangroves protected villages and reduced death toll during Indian Super Cyclone. Proceedings of the National Academy of Sciences,USA, vol. 106, No. 18, PP: 7357-7360, 2009.
[54] Badola, R., S.A. Hussain, B.K. Mishra, B. Konthoujam, S. Thapliyal, and P.M. Dhakate. “An assessment of ecosystem services of Corbett Tiger Reserve, India”. The Environmentalist, 30(4), 320-329. 2010.
[55] Vandermeulen, V., A. Verspecht, B. Vermeire, G. Van Huylenbroeck, and X. Gellynck. “The use of economic valuation to create public support for green infrastructure investments in urban areas”. Landscape and Urban Planning, 103(2), 198-206. 2011.
[56] World Bank. India – Diagnostic assessment of select environmental challenges (Vol. 3) : Valuation of biodiversity and ecosystem services in India (English). Washington DC ; World Bank. 2013.
[57] Bahuguna, V. K., and N.S. Bisht.Valuation of ecosystem goods and services from forests in India. Indian Forester 139(1), 1-13. 2013.
[58] Verma M, Negandhi D, Wahal A K, Kumar R. Revision of rates of NPV applicable for different class/category of forests. Indian Institute of Forest Management. Bhopal, India. June 2013.
[59] Verma, M., D. Negandhi, C. Khanna, A. Edgaonkar, A. David, G. Kadekodi, R. Costanza, and R. Singh. Economic Valuation of Tiger Reserves in India: A Value+ Approach. Indian Institute of Forest Management. Bhopal, India. 2015.
[60] Gopal, B and D K Marothia. Integrating the Economics of Wetland Biodiversity and Ecosystem Services in Management of Water Resources of River Ken: A Study, Economics of Ecosystems and Biodiversity (TEEB)–India Initiative, GIZ, and Ministry of Environment, Forest and Climate Change, Government of India, New Delhi. 2015.
[61] Ibid.
[62] MoEFCC & GIZ. The Economics of Ecosystems and Biodiversity TEEB India Initiative: Interim Report – Working Document. 2014.
[63] Ninan, K. N., and A. Kontoleon. Valuing forest ecosystem services and disservices–Case study of a protected area in India. Ecosystem services, 20, 1-14. 2016.
[64] Chaudhry, P. “Valuing Ecosystem Services: A Case Study of Pakke Tiger Reserve of Arunachal Pradesh, India”. Journal of Regional Development and Planning, 5(1), 1-14. 2016.
[65] Ghosh, N., D. Ghose, G. Areendran, D. Mehra, A. Paliwal, K. Raj, K. Rajasekariah, A. Sharma, A.K. Singh, S. Srinivasan, and S. Worah. “Valuing Ecosystem Services at the Scale of a large mammal landscape: The Case of the Terai Arc Landscape in Uttarakhand”, PRI Issue Brief No. 2, WWF India. 2017.
[66] Verma, M., C. Tiwari, S. Anand, A. Edgaonkar, A. David, G. Kadekodi, K.N. Ninan, P. Sharma , P. Panda, Z. Thatey, Economic Valuation of Tiger Reserves in India : Phase II. Indian Institute of Forest Management. Bhopal, India. 2019.
[67] See Ghosh et al 2016 and Ghosh 2018 for details of the methods used.
[68] Op cit.
[69] Verma, M., D. Negandhi, C. Khanna, A. Edgaonkar, A. David, G. Kadekodi, R. Costanza, and R.Singh. Economic Valuation of Tiger Reserves in India: A Value+ Approach. Indian Institute of Forest Management. Bhopal, India. 2015.
[70] Hazra, S. (2010): Temporal change detection (2001-2008) of the Sundarban. Unpublished report, WWF-India.
[71] Hazra, S., T. Ghosh, R. Das Gupta, and G. Sen (2002): “Sea level and associated changes in the Sundarbans”, Science and Culture, 68(9-12) 309-321.
[72] Danda, A. A, G. Sriskanthan, A. Ghosh, J. Bandyopadhyay and S. Hazra. Indian Sundarbans Delta: A Vision. World Wide Fund for Nature-India, New Delhi. 2011.
[73] Ibid.
[74] Ghosh, N. AA Danda, J. Bandyopadhyay, and S Hazra. “Away from the Devil and the Deep Blue Sea: Planned Retreat and Ecosystem Restoration as adaptation to Climate Change”, PRI Issue Brief No. 1, WWF India. 2016.
[75] Ibid.
[76] Ibid.
[77] Cernea, M. “Impoverishment Risks, Risk Management, and Reconstruction: A Model of Population Displacement and Resettlement”, Paper presented at the UN Symposium on Hydropower and Sustainable Development, Beijing. 2004.
[78] Danda, A.A., N. Ghosh, J. Bandyopadhyay, and S. Hazra. “Managed Retreat: Adaptation to Climate Change in the Sundarbans ecoregion in the Bengal Delta”, Journal of Indian Ocean Region. DOI: 10.1080/19480881.2019.1652974. 2019.
[79] Sukhdev, P. Costing the earth. Nature, 462(7271):277. 2009.
[80] Common, M. and S. Stagl Ecological Economics. Cambridge University Press, 2012.
[81] Sukhdev, P. Costing the earth. Nature, 462(7271):277. 2009.
[82] Ibid.
[83] Dong et al 2017.
[84] Barber, C. P., M. A. Cochrane, C. M. Souza Jr, and W. F. Laurance. “Roads, deforestation, and the mitigating effect of protected areas in the Amazon”, Biological Conservation, 177, 203-209. 2014.
[85] 10 out of 11 Himalayan states of India assembled on a platform titled, ‘Conclave of the Himalayan States’ in Musoorie, Uttarakhand on July 28, 2019. The meeting was presided over by Union Finance Minister Nirmala Sitharaman, Chairman of 15th Finance Commission N K Singh, Deputy Chairman of the NITI Aayog Rajiv Kumar beside Chief Ministers, special representatives of some North Eastern States and Jammu & Kashmir and senior Government officials. States presented a detailed agenda to the Finance Minister, and requested for the “green bonus”.
The views expressed above belong to the author(s). ORF research and analyses now available on Telegram! Click here to access our curated content — blogs, longforms and interviews.

Dr Nilanjan Ghosh is Vice President – Development Studies at the Observer Research Foundation (ORF) in India, and is also in charge of the Foundation’s ...
Read More +