Introduction
During his 2016 election campaign, US President Donald Trump made promises to “protect” American jobs and “wipe out” US trade deficits with countries around the world by renegotiating trade arrangement. [i] Later he would be quoted as saying, “We’re like the piggybank that everybody is robbing.” [ii] In reality, what he had called “renegotiation” of trade turned out to be unilateral tariff impositions directed at various countries including China. These impositions have resulted in counter-tariff measures from other countries, with China expectedly leading the way. It remains to be seen whether or not these developments will escalate into a full-fledged tariff war across the world in the near future. What is clear is that following the string of tariff and counter-tariff announcements, world trade patterns are showing a distinctly decelerating trend. There is little overall expectation of global trade expansion in the near future.
After a prolonged period of relatively free trade in the past few decades — with some analysts calling this period “the golden age of trade”— the emerging inward-looking, protectionist trend is likely to dent the spirit of multilateralism in world trade. Unilateral tariff impositions by the two largest economies of the world, followed by a few other countries, represent a sufficient threat to the existence of the rules-based multilateral trading system under the World Trade Organization (WTO).
Does trade protectionism, in general, help any nation to prosper economically? How do the basic trade theories view protectionism? This paper attempts to address these questions with the help of current world trade data trends and some elementary but crucial trade theorisations of “free trade regime.”
President Trump has been repeatedly bringing up the issue of India imposing high import duties on “many” American products, including the iconic Harley-Davidson motorcycles. [iii]He has also, on record, threatened to raise import tariff on “thousands and thousands” of Indian motorcycles exported to the US. [iv] Despite these developments, a section of commentators in India have also tried to portray an optimistic view of this potential “trade war” situation — with the hope that the US tariff imposition targeted at Chinese products will ultimately help India increase its export penetration in the US and some other export markets. How realistic are these expectations? Does India’s export basket have the capability to match the now-fabled advanced manufacturing export basket of China? These are the questions that will be addressed in the subsequent part of this paper, based on the latest available data on the export baskets of India and China.
A slowing down in world trade expansion
According to the WTO’s latest World Trade Outlook Indicator (WTOI) released in August 2018, trade volume growth is likely to decelerate further in the third quarter of the year. The WTOI reading is at 100.3, which is barely above the baseline value of 100 for the index and below the previous value of 101.8. Most of the drivers of trade are showing a downward trend except for agricultural raw material trade, which is the only one increasing. [v] Drivers like automobile production and sales, as well as overall merchandise trade volume remain largely at the same level. What is alarming is that export orders are in the red all over the world; this brings down the projection for overall trade volume growth in the near future (see Figure 1).
To be sure, these trends are initial and may vary in the coming quarters. They are worrisome, nonetheless, as only agricultural raw material trade (which is a kind of “wage good” in the classical economic exposition of theories of values and distribution) goes up while other merchandise trades including automobile production (which broadly represents “capital goods”) are all down. This gives rise to the expectation of decelerating and/or stagnating trends in industrial production all over the world in the near future, which will not bode well for global economic growth.
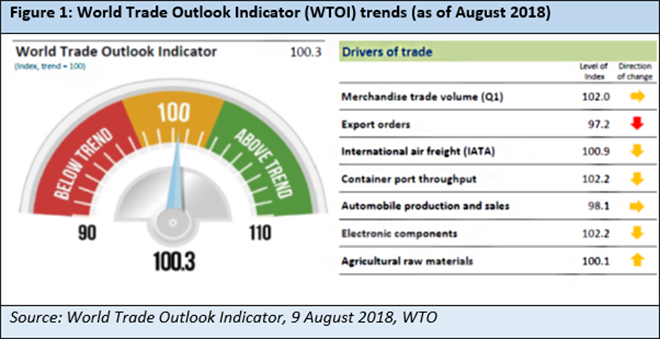
WTOI opines: “This loss of momentum reflects weakness in component indices including export orders and automobile production and sales, which may be responding to the ratcheting up of trade tensions.” [vi] It seems that overall trade expansion is getting adversely affected by an expectation of a deteriorating US-China tariff war and the subsequent involvement of other countries.
It was in early March 2018 when the US fired the first salvo, raising tariffs on US$92 billion worth of imports covering steel and aluminium products, washing machines, and solar panels, among others, in which China holds substantial export shares in the US. Apart from China, the countries affected by this set of tariffs include Brazil, Korea, Argentina, India and the European Union (EU). The second dimension, unveiled in end-March, was President Trump’s directive to the United States Trade Representative (USTR) to take all possible actions against China, including using penal tariffs on its exports, for “harming American intellectual property rights, innovation, or technology development.” [vii]
Subsequently, the US imposed a 25-percent tax on a second tranche of goods worth US$16 billion in August 2018. These goods include motorcycles, aerials, and optical fibres. [viii] The measures are part of Trump’s broader “America First” approach. In what was an expected reaction, the affected countries retaliated with counter tariffs. The EU, for one, announced “rebalancing measures” targeting 340 American export items valued at US$7.2 billion, roughly equivalent to the amount of its steel and aluminium exports adversely affected by the US tariff. Canada, for its part, announced retaliatory tariffs of up to 25 percent on the US imports of steel and aluminium, orange juice, whiskey and other food products — having a value of around 16.6 billion Canadian dollars which is the value of targeted Canadian steel exports to the US. Meanwhile, Mexico announced similar measures on a number of products, including dairy, horticulture and meat products, “up to an amount comparable to the damage caused by the US action.” [ix]
In early April, China decided to retaliate against the US by imposing tariffs on 128 products, which accounted for US$3 billion worth of US exports to China in 2017. China proposed the imposition of a 15 percent tariff on the first set of products, including fresh fruits, dried fruits and nuts, wines, modified ethanol, American ginseng, and seamless steel pipes. On a second set of products, including pork and its products, and recycled aluminium, 25 percent tariff imposition was proposed. Continuing the tit-for-tat, China decided to impose additional tariffs of 25 percent on chemical products, medical equipment and energy imported from the US. [x]
The Chinese government on 8 August signalled its willingness to impose retaliatory tariffs on US goods — just ahead of the annual summit of China’s top leaders. This is reportedly in retaliation for the “Trump administration’s publishing a list of Chinese products that will confront 25 percent duties starting on 23 August” — raising the value of tariffs to US$50 billion, up from the current US$34 billion.[xi] This willingness later translated to additional tariffs on US$60 billion worth of imports from the US. The Customs Tariff Commission of the State Council unveiled lists of 5,207 American products which will face additional tariffs of five to 25 percent. The effect of this set of tariffs can be quite significant in the near future. [xii]
In what appears to be the latest round of the tariff war, the US government has again hit China with a new set of tariffs affecting US$200 billion worth of Chinese goods from the middle of September. Unlike the previous set of tariffs that were aimed mainly at capital goods, this latest round will hit thousands of consumer goods made in China, ranging from luggage and electronics to houseware and food items. The imposition of tariffs will ultimately result in an increase in the cost of these goods. [xiii]This action apparently has been undertaken by the US as a response to China’s indifference in addressing its “unfair policies and practices.” China, meanwhile, deeply regretted the decision and conveyed that it has “no choice but to take counter-measures.” However, China’s Ministry of Commerce is yet to come out with the details of such retaliation. [xiv]
India, perhaps unwillingly, is also getting embroiled in the trade war. The Indian government imposed higher duties on 29 key US imports (applicable from 18 September), in which the value of actual imports stood at US$1.5 billion in 2017-18. This has been ostensibly done to offset the estimated loss incurred by India after the US government hiked import duties on steel and aluminium in May this year. [xv]Needless to say, if the tariff war does not relent, more tariffs are bound to be applied from the Indian side on other sets of goods as well.
The total merchandise exports of WTO members in 2016 was at US $15.71 trillion, and exports of services by the members in the same year totalled US $4.73 trillion. [xvi]These trade numbers might show that the impact of tariff impositions has not reached alarming dimensions. However, if the tariff war continues, it can eventually result in huge losses to world trade much sooner than expected.
US trade deficit woes
The rationale provided for tariff imposition, particularly in the US, revolves around domestic job protection. An “America First” approach entails cutting down imports so that domestic producers can sell their goods. In turn, more employment will be generated (for the American people) within the economy. Therefore, reducing the volume of imports, along with a stricter immigration policy, finds popular domestic support as the last few decades saw American jobs being outsourced to foreign cities where labour is cheaper. The number of immigrant workers, particularly in the high-technology sectors, has also increased in the US in the last few decades. Ever increasing US trade deficit figures give credence to this sentiment. That is why protecting jobs by cutting down trade deficits (by a sizeable reduction in imports) has found support with the American people. In a similar way, targeting China for cutting imports by tariff imposition also finds popular support.
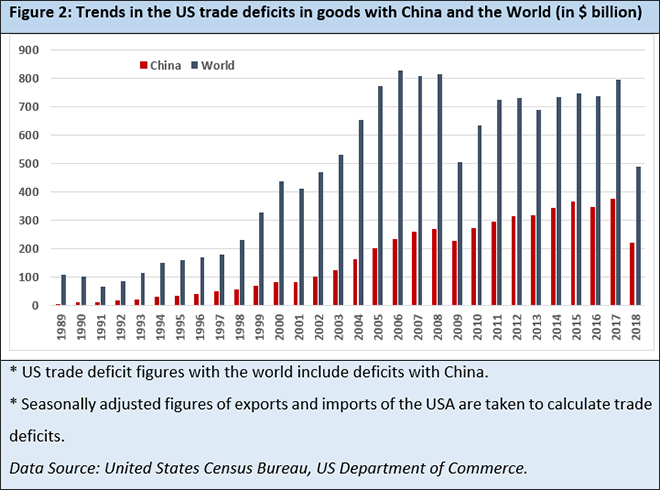
However, as is evident from Figure 2, the US deficit in goods trade has been increasing since the 1980s. After a mild improvement in the initial years of the 1990s, the deficit again deteriorated after the mid-1990s. Since the beginning of the new millennium trade deficits started rising rapidly; this was also the time of China’s accession to WTO and its subsequent entry into the US market. Here perhaps lies the popular justification given by the US government citing the “China factor” for its worsening trade deficit figures. What is noteworthy, however, is that the goods trade deficit of the US with the rest of the world also continued increasing over this period. Although services trade since the late 1980s generated a surplus and kept on increasing, that surplus has been grossly inadequate to offset the rapidly deteriorating imbalance in goods trade.
Using the deficit figures of 2017, then the US trade deficit with China stood at US$375.6 billion and with the entire world, US$795.7 billion. That simply means that the US had a trade deficit of US$420.1 billion with rest of the world, and if hypothetically China is completely pushed out of the American market even then the US economy will have a huge goods trade deficit and an overall current account deficit to deal with. This indicates a general systemic flaw which is beyond the so-called “China factor.”
In terms of national income identity, the gap between the exports and imports of any country is equal to the savings-investment gap. [xvii] America, being a consumption-led economy, for years kept on saving at a very low rate. Its domestic savings rate never touched 24 percent since the 1950s, and in more recent years it has even gone below 17 percent. [xviii] This implies that the economy in general spent more than it saved (and invested), and that spending was supported by borrowing. In other words, the economy grew with consumption as its main driver, and such consumption was generated essentially by borrowing. This spend-thrift way to prosperity worked as long as the country could successfully borrow from global capital markets and its own globalised financial architecture. However, that party ended with the 2008 financial crisis as capital markets everywhere became stressed, and financing that trade deficit increasingly became more difficult. Therefore, the real macroeconomic problems of the US are systemic and broadly due to its consumption-driven growth model. [xix]
In the past, China might have resorted to “unfair trade practices” to penetrate the American and other export markets—and worsened the situation further—but the real long-term problem for the US is its widening savings-investment gap which can be clearly observed from its worsening trade deficits with the rest of the world. This issue is beyond the scope of this paper, but has to be kept in mind to understand the dynamics of the US’ increasing trade deficits. Only then can unilateral tariff imposition, as a policy measure, be objectively judged.
Interestingly, the US government is currently basking in glory after the announcement of a healthy 4.1 percent growth in GDP in the second quarter of 2018. [xx] National unemployment rate in July 2018 dropped down by 0.1 percentage point from June to 3.9 percent and was 0.4 percent lower compared to July 2017; unemployment rates were lower in July in 11 states, higher in two states, and stable in 37 states and the District of Columbia. [xxi]
Are tariff impositions therefore working in favour of the US? At a facile level it may seem so, but a closer examination of the economic costs of such tariff imposition challenges these optimistic views, in the context of both the US and the global economy.
Economic costs of tariff imposition
To put things in perspective, the theory of comparative advantage — as postulated by economist David Ricardo — even today provides the most appealing yet simple justification of free trade. Ricardo apparently developed his theory to advocate removal of trade restrictions on imported wheat in 18th-century England. He argued that a country enhances its own economic growth the most by concentrating on production of the goods in which it has comparative advantage and exporting the surplus, and simultaneously importing other goods in which it has comparative disadvantages. [xxii]
With this kind of rearrangement of production, in an ideal “free trade” globe the world as a whole will be producing more, in the process raising every inhabitant’s standard of living. However, in reality, in the absence of any central authority that can decide comparative advantages and disadvantages of different products on behalf of every country — international production and trade is determined in the marketplace where supply and demand rule. And it will be unrealistic to say that every time that demand-supply mechanism produces perfect result in terms of comparative advantage. Nevertheless, the essential linkage between the comparative advantage theory and international trade remains the same: trade between two countries, under “ideal free trade” framework, can benefit both if each country exports the goods in which it has a comparative advantage. [xxiii] Although, in reality “free trade” may not be beneficial always and can produce distortions in the sectoral production structure of a country. For example, an economy with low level of technology can lose much of its manufacturing sector due to outside competition if it chooses to open up without protecting its fledgling industries.
The most important point to be noted in this context is that China will still be having a comparative advantage in production of steel, aluminium and most other products (on which the US has imposed tariffs) in terms of labour and other input costs, with respect to the US. Manufacturing production has shifted its base heavily to Chinese territories from those of the US in the last few decades to exploit this labour cost advantage, among other factors. Therefore, less imports of these goods from China will negatively affect both American and Chinese production in the long run. Extending this theoretical framework further, tariff imposition is always seen as a hindrance to free trade. In his 1936 article in Economica, A. P. Lerner wrote, “A tax on imports is a tax on exports.” This principle is as fundamental to trade policy as that of comparative advantage is to trade theory. The implications of Lerner’s exposition are broadly as follows.
Tariffs can be imposed to provide incentives for domestic producers, as has been apparently done in the current case of the US. Consumers of targeted products then turn to domestic alternatives and/or imports from non-targeted countries. This creates incentives for increased domestic production of the targeted goods and generates trade diversion. However, the overall consumer prices tend to go up because targeted products, in all probability, will have relatively lower cost of production in targeted countries from where the imports used to be made before tariff imposition. [xxiv]Although overall consumer prices of those goods go up, historically it has been observed that the extent of price rise is usually less than the tariff hike, at least in the initial stages. The immediate effect, therefore, is that tariff imposition may appear that it is achieving its objective of boosting domestic producers. In the next round, however, a reduction in exports of the tariff-imposing country may be on the cards. Reduced imports by the tariff-imposing country brings down the earnings of the foreign producers that could otherwise have been utilised to buy other domestic goods and services (of the tariff-imposing country) as inputs or finished products.
Another alternative channel of adjustment may be the exchange rate. Reduction in imports (say, of the US) can reduce the supply of that country’s currency abroad, and the currency will tend to appreciate. This, in turn, will undermine its international competitiveness across all goods and services in its export basket.
Since mid-April, appreciation of the US dollar has become more pronounced as the tariff war escalated. As of mid-September, the dollar index — which measures the greenback against a basket of six other major currencies — has been up about five percent since mid-April. With trade war remaining one of the fundamental drivers behind the US dollar appreciation, early trends in the international currency markets substantiate the theoretical exposition mentioned above. However, investors in the currency market, who wished to book profits under the current circumstances, have become cautious in the month of September as in “longer term there is a fear of material negative effects to the overall economy (of the US).” [xxv] However, under the current circumstances, appreciation of the US dollar in the international market is expected to continue.
For the US, this is a fairly probable chain of future events. Though the effect of tariff imposition is yet to make its real impact on the economy, over a period of time it is expected to affect the downstream users of steel and aluminium — automobile, machinery and equipment, other transportation equipment, and electronic equipment. These downstream manufacturers will face relatively higher input costs, including hiked up cost due to heightened competition for labour and capital in the domestic market as US domestic steel and aluminium markets expand. On the other hand, foreign producers of these downstream products will face relatively lower input costs than their US counterparts, resulting in tougher competition from imports. US imports of these downstream products are expected to increase as higher domestic prices will reduce overall demand for these domestically manufactured downstream products. The same will be true for the US exporters of these downstream products as they will be set to lose sales abroad as US products will be less competitive in foreign markets due to input cost escalation. In the next round of economic activities, it may get reduced to a simple process of the protected sectors gaining at the cost of other affected downstream sectors — a case of the proverbial “robbing Peter to pay Paul.”
Indeed, there are real economic costs that are likely to impact the US economy’s ability to generate goods and services in the long run — reducing the efficiency of the real sector production economy. It is noteworthy that this economic dynamics is likely to take place even in the absence of retaliation from other countries. Retaliatory measures of other countries will further jeopardise US trade figures — depending on the US share in those countries’ imports. Moreover, those retaliations will have their own effects in the respective economies and are likely to further decelerate overall world trade expansion. It then comes as little surprise that the US’ international trade deficit in goods and services kept on increasing to US$46.3 billion in June from US$43.2 billion in revised estimates for May, as exports decreased and imports increased. [xxvi]
If the US government continues to impose further tariffs on Chinese goods, China will be hit badly, as the US’ imports from China between 2012 and 2016 reached a staggering level of US$481.52 billion. Additionally, the US’ exports to China during the same period was worth US$115.60 billion. [xxvii] The US economy is therefore unlikely to escape unscathed, as some analysts have theorised.
Quite a few Asian economies export intermediate goods to China, and China assembles the pieces into finished products to be then exported to different destinations — the US being the major one. Therefore, serious negative implications may occur for Asian economies such as Taiwan, South Korea, Singapore and Malaysia, which export huge volumes of intermediate goods to China. If an “all-out trade war” between the US and China breaks out (defined as 15 percent to 25 percent tariffs imposed on all traded products), according to some estimates, there might be a 0.8 percent reduction in the growth rate of Singapore. Taiwan and Malaysia could experience a 0.6 percent cut in their expected growth rates, and South Korea could lose 0.4 percentage point in its own. For China and the US, the reduction in their respective expected growth rates can be as high as 0.25 percent if such full-fledged “trade war” breaks out. [xxviii]
Can India benefit at the expense of China?
Ever since the tariff war between the United States and China broke out, opinions — mostly in the Indian media — have been expressed about how Indian exports can benefit at the expense of China. Since exports has historically been an important driver of economic growth for both China and India, the optimism showed by most of these analyses hinged on the ways by which India can fill the space supposedly being vacated by China in world trade.
As mentioned earlier, even India is going to be negatively affected by the US tariff impositions, albeit to a much less extent than China. An examination of the basic trade and economic indicators of both countries may give a perspective about whether or not the current “export optimism” from some Indian commentators is well-founded.
| Table 1: Economic and trade indicators of India and China |
|
China |
India |
| GDP (current US$ Billion) |
11064.7 |
2111.8 |
| Trade Balance (current US$ Billion) |
385.5 |
-48.8 |
| No. of Export partners |
213 |
220 |
| No. of Export products |
4433 |
4424 |
| No. of Import partners |
211 |
215 |
| No. of Import products |
4461 |
4313 |
| No. of Tariff Agreement |
22 |
2 |
| Manufacturing value added (% of GDP), 2017 |
29 |
15 |
| High-tech exports (as % of manufactured exports), 2016 |
25 |
7 |
| Medium & High-tech exports (as % of manufactured exports), 2015 |
59 |
34 |
|
* Manufacturing value added, high-tech exports, and medium & high-tech exports data are taken from World Development Indicators (WDI) Database, World Bank.
* Data on all other indicators are figures for the year 2015, and are sourced from World Integrated Trade Solution (WITS) Database, World Bank.
|
In current value of GDP in US dollar, China is more than five times ahead of India. China has an overall trade surplus of US$385.5 billion; in contrast, India has a US$48.8 billion trade deficit (see Table 1). This difference in trade balance alone is sufficient to trigger scepticism about the possibility of India replacing China in some of the international export markets.
There is a similarity in the numbers of export and import partners, and numbers of export and import products for both countries. An optimistic view of Indian exports replacing Chinese exports in different world markets, particularly in the US, probably originates from this set of statistics. However, the similarities end in some of the other crucial indicators. As of 2015, China had 22 tariff agreements compared to only two for India. This lack of tariff agreements with potential trade partners is likely to make a dent on the optimistic view that India can benefit at the expense of China. In an era where almost all economically important countries are looking inwards and building up trade protection, the role of multilateral trade organisations such as WTO is expected to be sufficiently undermined. In the current situation, bilateral agreements and arrangements are going to be crucial for most of the global trade interactions.
One of the most important elements in China’s success story is its manufacturing sector: in the last 25 years or so, China has successfully transformed itself into the biggest manufacturing hub of the world. Manufacturing value added of the country, as percentage of GDP, bears testimony to that. While in 2017 manufacturing value added in China contributed 29 percent in its GDP, Indian manufacturing languished at 15 percent of GDP. This means that China’s export basket is likely to have more advanced manufacturing products than India’s.
The nature and composition of the export basket of a country, in a way, depict the current stage of economic development and industrial advancement of that country. In other words, a relatively advanced economy tends to export more high-tech, medium-tech and finished products, while a relatively less advanced (or more primitive) economy tends to export more raw materials, intermediate goods, and semi-finished products. The long-term goal for any country is to increase its quantum of manufacturing and high-tech exports. In this respect, India has a lot of catching up to do with China. Chinese high-tech exports are 25 percent of its manufacturing exports while those of India stand at a relatively low seven percent. Yet, one may argue that in terms of medium-tech exports India has made some headway as 34 percent of Indian manufacturing exports are high and medium-tech whereas 59 percent of Chinese manufactured exports are the same. However, if one excludes refined petroleum oil, which is the top export item of India, from India’s high and medium tech exports basket, then the comparative figures are likely to be as lopsided as in high-tech exports.
Another way of comparing export capabilities of different countries is to look at the Index of Export Market Penetration (IEMP). It is calculated as the number of countries to which the reporter country exports a particular product divided by the number of countries that report importing the product that year. [xxix] It is important to note that no country ever exports all its exports to all the countries that import them. So, an IEMP value of 100 is impossible to achieve. Historically it has been seen that IEMP of countries with top export performance in the world hovers around 50 percent of their total potential as can be seen in Table 2. [xxx]
| Table 2: Trends in Index of Export Market Penetration Index (IEMP) in India, China and the US |
|
2012 |
2013 |
2014 |
2015 |
2016 |
| India |
27.49 |
28.14 |
27.90 |
27.65 |
23.32 |
| China |
53.31 |
53.07 |
52.53 |
51.16 |
42.57 |
| USA |
48.32 |
47.24 |
46.27 |
43.59 |
36.98 |
| Data Source: World Integrated Trade Solution (WITS) Database, World Bank |
Table 2 demonstrates the difference in export penetrations of India and China. While China’s export market penetration crossed 50 percent of potential between 2012 and 2015, India’s was around 28 percent. While in 2016 China’s IEMP decreased to 42.57, India’s also went down to 23.32. Similar downward trends in IEMP can be observed for the US as well in 2016, though it is still at 36.98. Incidentally, China and the US occupy the two top spots in current values of IEMP, while India is ninth.
While the overall slowdown in global trade has reduced the export market penetration for all three countries, the relevant point is that China’s export market penetration is roughly double of India’s. The way this US-China tariff war is unfolding, it is clear that China may lose some parts of the American export market. This will still be a loss of one market; a big market but only one. China will then try to compensate by utilising the rest of its export market penetration, where in any case it has a visibly overwhelming edge over India. It is quite unlikely that India can fill up the vacuum, if any, created by this tariff war. This is primarily because replacing Chinese products in the American market will require advanced high-tech production capabilities, particularly in manufacturing products, which India currently does not possess and cannot build overnight.
However, IEMP has one limitation — it does not assign statistical weightage to exports by their relative importance. An insignificant export to a small economy counts the same as a voluminous major export breakthrough in a large economy. [xxxi] Keeping that in mind, to further probe into the feasibility of the Indian exports replacing Chinese exports, one may have to look at the composition and volumes of both the countries’ export baskets under major product group heads.
| Table 3: A comparison of export product groups of India and China |
| Product Group |
China_Export
(US$ Billion)
|
India_Export
(US$ Billion)
|
(China_Export/
India_Export)
|
| All Products |
2097.64 |
260.33 |
8.06 |
| Capital goods |
927.32 |
35.60 |
26.05 |
| Mach and Elec |
895.64 |
21.77 |
41.13 |
| Consumer goods |
785.49 |
117.50 |
6.68 |
| Intermediate goods |
342.02 |
84.66 |
4.04 |
| Textiles and Clothing |
253.29 |
35.43 |
7.15 |
| Miscellaneous |
224.81 |
6.18 |
36.41 |
| Metals |
154.38 |
19.37 |
7.97 |
| Chemicals |
99.16 |
33.47 |
2.96 |
| Transportation |
92.88 |
21.41 |
4.34 |
| Plastic or Rubber |
81.40 |
7.63 |
10.67 |
| Stone and Glass |
66.01 |
45.33 |
1.46 |
| Footwear |
59.44 |
3.04 |
19.58 |
| Raw materials |
38.25 |
21.74 |
1.76 |
| Wood |
37.91 |
1.92 |
19.78 |
| Hides and Skins |
31.40 |
3.27 |
9.61 |
| Food Products |
28.54 |
5.87 |
4.86 |
| Fuels |
26.87 |
27.72 |
0.97 |
| Vegetable |
25.03 |
15.20 |
1.65 |
| Animal |
17.62 |
9.59 |
1.84 |
| Minerals |
3.25 |
3.13 |
1.04 |
|
* Export figures for both the countries are for 2015, the latest available year in WITS database.
* Product group “Mach and Elec” includes nuclear reactors, boilers, machinery and mechanical appliances, and electrical machineries and parts; “Miscellaneous” includes clocks, watches, musical instruments, arms and ammunition, furniture, toys & games, and works of art; “Animal” includes live animal, meat, fish, dairy products, and products of animal origin; “Raw Materials” includes animal, horticultural, agricultural and industrial raw materials; same for the product group “Intermediate Goods”; rest are self-explanatory.
Data Source: World Integrated Trade Solution (WITS) Database, World Bank
|
Table 3 compares the exports of India and China in major product groups. The last column is constructed by dividing Chinese export value in dollars by Indian export value in dollars for the respective product groups. This has been done to show how many times Chinese export in a particular product group is greater than Indian exports. China’s export product groups are arranged in descending order, with the corresponding Indian exports in the same product group — to highlight the comparison.
There is no surprise in the overall exports figures as Chinese export in all products turns out to be more than eight times that of India. As is evident from Table 3, Chinese exports in ‘machinery and electrical equipment’, ‘miscellaneous’ category (which includes clocks, watches, arms and ammunition, musical instruments, furniture, toys and game, and works of art), ‘capital goods’, and ‘footwear’ are 41.13 times, 36.41 times, 26.05 times, and 19.58 times of Indian exports in respective product groups. This highlights the stark fact that exports of China are strongly based around its manufacturing sector and advanced finished goods, and also emphasises that India is currently way behind China in the competition in manufacturing exports. India is therefore unlikely to gain even minimally if there are possible future decreases in these Chinese manufacturing exports — as China is operating in a completely different zone in international export markets compared to India.
For example, the initial phase of the US tariff imposition targeted Chinese steel and aluminium exports. In this area, Chinese exports are almost eight times of India’s. There is thus a slim chance that Indian metal exports will benefit from any reduction in Chinese metal exports. On the contrary, there is always a possibility that China may try its best to dump its resultant surplus of steel and aluminium exportables in markets other than the US, including India. In that case, even in domestic market Indian steel and aluminium manufacturers may face a stiff challenge from low-priced Chinese products. Additionally, there are apprehensions that India also may get adversely affected by the US tariff imposition, as mentioned earlier. All these factors together indicate towards a short-term scenario where there is little probability that Indian exports, particularly manufacturing exports, can gain at the expense of Chinese exports.
On the other hand, one can also look at those export product groups where Chinese exports are less than two times of Indian exports. These might be the goods where India may have a fighting chance and can gain at the expense of China. The table shows that stone and glass, raw materials, fuels, vegetable, animal, and minerals are the export product groups where Indian export values are much closer to China’s. However, these are mostly goods that fall under ‘raw material and intermediate goods’ category, and it does not seem that China has any long-term vision to compete in these segments which are much lower in the value chain. Therefore, even if India gains in the export of these products, it cannot be branded as “real long term gain” in trade and economic terms at the expense of China. Moreover, in the long run, China will probably be less interested in competing in exports of products like minerals or raw materials. The country would rather concentrate on high-tech products where per unit export earnings and profit margins are much higher.
Combining these facts with the larger truth that India may get adversely affected by some of the tariff impositions by the US and other countries, there is close to zero probability that Indian exports can make substantial gains when some of the Chinese exports are pushed out of American and other markets in a potential “trade war”-like situation.
Conclusion
The United States of America has a serious problem in its worsening trade deficits, particularly in goods trade. However, the real cause of the problem lies in its economic development model which is essentially consumption-driven. Since this consumption has been historically driven by borrowing, it gives rise to a persistent low level of savings and in turn, a low level of investment. Addressing that low level of investment cannot be done by simply curbing imports through unilateral tariff impositions. In other words, the problems of real sector percolates into trade sector for any economy but treating that trade sector problem as a “stand-alone” problem will not provide results as trade sector only mirrors the real sector. The long-term solution has to be found in the real sector itself.
China definitely has a history of “unfair trade practices” like dumping, violating intellectual property, and subsidising industries bypassing international trade laws and norms. However, it is important to mention that at present China is also as serious on issues of intellectual property rights as the US or any other advanced country. As China unveils and invests more into advanced methods and technologies of production, the country has started to take the issues of intellectual properties more seriously than ever. However, common complaints against China like dumping and providing industrial subsidies still remain. But, unilateral tariff impositions by the US (or by any country), which hurt other countries as well, is not the answer. On the contrary, it weakens the process to attain a just and free international trade order — for which the US itself ostensibly fought so long. Raising justified issues and grievance redressal in the international trade platforms, including WTO, by convincing and mobilising other aggrieved countries has proved to be a better way of arriving at a resolution. Random and unilateral tariff impositions by the world’s major economies will only jeopardise and destroy the rules-based trade framework, including WTO. The tariff war of the last few months has practically put the WTO in a comatose state.
To put things in a historical perspective, the US employed protectionist trade policies, mostly by imposing high tariffs on imports, throughout the 19th century and at the beginning of the 20th century. Protectionism during that phase was mainly justified as a means to protect American “infant industries” from the onslaught of relatively more advanced British industries. However, by the time Second World War was over, the US was spearheading the international endeavour to ensure free trade, which would eventually lead to multilateral negotiations under the General Agreement on Tariffs and Trade (GATT) in 1947. Simultaneously, the US’ protectionist stance weakened over the next several decades.
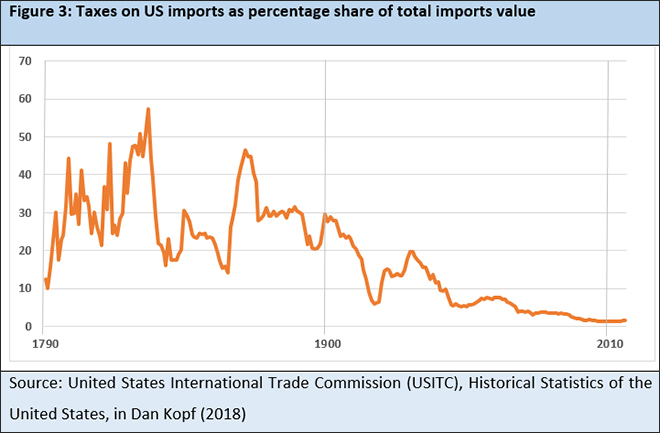
It is unlikely that India will benefit from China’s retreat from certain export markets. Top exports of these two countries do not match; moreover, China’s exports are increasingly leaning towards high-tech products where India’s relative capability is currently lacking. China’s export market penetration is also the highest in the world while India’s lies roughly half-way that of China. Therefore, both in terms of production capabilities and export market penetration, China is operating in different segments of international export markets, and India simply cannot attain those production capabilities and export market penetration overnight to replace China in any export market, including that of the US.Figure 3 charts the trends in the share of taxes collected on US imports in its total import value since the country’s inception, and this variable signifies the country’s trade protectionism. The last time this share reached roughly 30 percent value was long ago, in 1899, and it was only 1.5 percent in 2016. [xxxii] Therefore, after more than a century, the US is traversing the path where the country intends to implement a similarly high level of tariff imposition. Even historically speaking, the country has gone more than a century back in terms of trade protectionism. To be sure, the world has changed in the last century, US industries are no more “infant”, the composition of its services sector has undergone a sea change, and this retrograde policymaking does not seem to be helping the economy in the long run.
In another significant recent development, the EU, Canada and the trinity of WTO Secretariat-World Bank (WB)-International Monetary Fund (IMF) have proposed reforms to “modernise the WTO.” Apart from junking the “consensus” principle of trade, earlier embedded as a cornerstone of multilateralism, this set of reforms also propose to curtail “policy space” for countries like China, India, Brazil and South Africa. Worse still, the US has also proposed abolition of the multilateral dispute settlement system as it exists under the current WTO structure. This effectively means that countries will be free to act unilaterally without being answerable to any multilateral appellate body. Their proposed solution is that the WTO members must embark on a new round of plurilateral trade negotiations to design rules on issues like e-commerce, investment facilitation, disciplines for MSMEs. This practically sounds the death knell for WTO as the world knows it. It is noteworthy that the WTO Secretariat is endorsing these views, which technically it cannot, under the existing structure. The US, the EU, Japan and Canada — the Quad that vehemently forced a unifying trade framework earlier on the world — are now saying the opposite. [xxxiii] This tornado of destruction of multilateral trade structure is going to affect almost all countries of the world, including India.
In a rapidly changing, volatile international trade scenario, the time has come for India to employ elaborate analyses of trade diagnostics to identify potential export markets. This may also be an opportune time to build a long-term policy view to add new export products, preferably belonging to the high- and medium-tech segments, to the country’s export basket. Similarly, identifying countries with whom India can possibly have gainful trade interactions should also be done as soon as possible. If India fails to quickly adapt to the new unfolding realities of international trade, then the country’s external sector may face serious trouble in the near future.
References
Bloomberg, “How bad could it get? Counting the cost of a global war”, 23 March (2018), Bloomberg Terminal, Economics- Brenton, P., and Newfarmer, R. “Watching More Than the Discovery Channel to Diversify Exports”, in Breaking into New Markets: Emerging Lessons for Export Diversification, eds. R. Newfarmer, W. Shaw, and P. Walkenhorst (Washington DC, World Bank, 2009): 111-126
- Ciuriak, D. “The March into Trade Wars: US Policy Aims and the Implications for Reconciliation”, Verbatim, 2 August (2018)
- Dhar, B. “Trade Wars of the United States”, Economic and Political Weekly, 15 September (2018): 12-17
- Grennes, T. “The Economics of Tariffs: Can Restricting International Trade be Good for the Economy”, NC State Economist, May/June (2017)
- Krugman, P. R., and Obstfeld, M. “International Economics: Theory and policy”, Indian Edition, First Impression (2009), Pearson Education, India
- Lerner, A. P. “The Symmetry between Import and Export Taxes”, Economica New Series, Vol. 3, No. 11 (1936): 306-313
- Reis, J. G., and Farole, T. “Trade Competitiveness Diagnostic Toolkit”, World Bank (2012)
- Ricardo, D. “On The Principles of Political Economy and Taxation”, Batoche Books (2001), First published in 1817
- WTO, “World Trade Outlook Indicator”, 9 August (2018)
- WTO, “World Trade Statistical Review 2018”., World Trade Organization
[i] Partington, R. “Why is Donald Trump threatening more tariffs – and what next?”, The Guardian, 19 June (2018).
[ii] President Trump said this in a press conference at G7 Summit, June 2018.
[iii] Economic Times, “Donald Trump accuses India of charging 100 per cent tariff on some imports”, 11 June (2018).
[iv] Ibid.
[v] WTOI intends to provide “real time” information on the trajectory of world trade relative to recent trends. Though it does not intend to be a “short-term forecast”, it does provide an indication of trade growth in the near future. Main contribution of WTOI is identification of turning points and gauging momentum in global trade growth, and it acts complementarily with trade statistics and forecasts provided by the WTO and other organisations. Readings of 100 indicate growth in line with medium term trends, greater than 100 indicates above-trend growth, and below 100 readings indicate reversal of medium term trends. The direction of change is captured by the momentum compared with the previous month.
[vi] World Trade Outlook Indicator, 9 August 2018, WTO
[vii] Dhar (2018)
[viii] BBC News, “US-China trade war: New tariffs come into force”, 23 August (2018).
[ix] Dhar (2018), op. cit.
[x] Ibid
[xi] This Business Standard news article also reports that WTO has warned that US-China trade tension is expected to have ripple effects across the world.
Chakraborty, S. “US-China tariff war to slow down global trade growth in Q3 of CY18: WTO”, Business Standard, 10 August (2018).
[xii] Dhar (2018), op. cit.
[xiii] Partington, R.; Rushe, D. and agencies. “Trump hits China with $200bn of new tariffs as trade war escalates”, The Guardian, 18 September (2018).
[xiv] Ibid
[xv] Chakraborty (2018), op. cit.
[xvi] Chapter 2, World Trade Statistical Review, 2017
[xvii] National income identity is given as –
Y = C + I + G + (X-M)
[where Y, C, I, G, X and M are national income (output), consumption, investment, government expenditure, export and import respectively]
Assuming government intervention at zero level, the identity can be reduced to –
S – I = X – M, where S is savings = (Y – C)
Therefore, trade deficit (or surplus) is equal to savings-investment gap (or surplus savings over investment)
[xviii] Dhar (2018), op. cit.
[xix] Ibid
[xx] Bureau of Economic Analysis, U.S. Department of Commerce.
[xxi] Bureau of Labor Statistics, “News Release: State employment and Unemployment – July 2018”, 17 August (2018).
[xxii] A country has a comparative advantage on a particular good or service when it can produce that with relatively lower opportunity cost than other countries. The opportunity cost of good X in terms of good Y (within a particular country) is the number of units of Y that could have been produced with the resources used to produce a given number of units of X. ‘Opportunity cost’ practically is a synonym for ‘trade-off’; when a country can produce both textiles goods and steel but it is relatively more efficient in producing textiles then as a ‘trade-off’ producing more textile goods and importing steel from another country (which has comparative advantage in producing steel) can boost economic output of that country. Other country, which has a comparative advantage in producing steel, can also increase its national output in the same way if it concentrates on steel production and imports other goods and services, in which it has comparative disadvantage. In other words, a country has a comparative advantage in producing good X if the opportunity cost of producing X in terms of other goods is lower in that country than it is in other countries.
[xxiii] Krugman and Obstfeld (2009)
[xxiv] Grennes (2017)
[xxv] Reuters, “Dollar steady as US, China escalate trade war”, CNBC, 17 September (2018).
[xxvi] United States Census Bureau, “U.S. International Trade Data”.
[xxvii] Data source: World Integrated Trade Solution (WITS), World Bank
[xxviii] Lee, Y. N. “The US and China won’t be the only ones hurt by their tit-for-tat tariffs”, Asia Economy, CNBC, 5 July (2018).
[xxix] Reis and Farole (2012)
The index considers a country’s total number of exports, and the number of markets that each of those products reaches. Then, the number of countries in the rest of the world that import each of these products (which the country of interest exports) is considered. Pairing products and countries this way, one can obtain the maximum potential number of export relationships that a country can establish given its export portfolio at present. The actual number of export relationships is then divided by the potential number to assess how much export opportunities a country is exploiting.[xxix]
For example, in 2004 Albania exported 955 products and if Albania exported all of its exports to all the countries that import what Albania exports, then it could have formed 90,350 export relationships. That is Albania’s maximum potential number of export relationships. However, in that year Albania could only exploit 2.27 percent of that potential, and therefore Albania’s IEMP stood at 2.27 at that year.
[xxx] Brenton and Newfarmer (2009)
[xxxi] Reis and Farole (2012), op. cit.
[xxxii] Kopf, D. “The history of US protectionism, in one 230-year chart”, Quartz, 16 March (2018).
[xxxiii] Ravi Kanth, D. “Must India pay for America’s trade war with China?” livemint, 24 October (2018).
The views expressed above belong to the author(s). ORF research and analyses now available on Telegram! Click here to access our curated content — blogs, longforms and interviews.

 PDF Download