The financial health of the Indian Railways, the single largest employer in the Government of India, has been in a dismal state for some time now. With the recent merging of the railways budget with the general budget, it has become a daunting exercise to conduct an analysis of railway finances. Yet, it is no doubt in the national interest to not only locate the shortcomings in the system but also explore solutions to improve performance. This paper examines the falling asset productivity of the Indian Railways, which is precluding efforts to engineer a resurgence in its profitability. The analysis finds similarities with the historical data of ‘falling asset productivity’ which had in the past led to poor financial performance of the railways. The paper offers recommendations to ameliorate the decline in productivity.
Introduction
The finances of the Indian Railways (IR) are currently under great stress, and such bleak state is well-documented in the report of the Comptroller and Auditor General of India (CAG) on railway finances for the year 2016–17, released in early 2018. Indeed, the same report said, had the cash flows been more conscientiously recorded, the Operating Ratio[1] of the IR would have been well past 100, and not 96.5 as reported by the railways.[2] This means that the railway finances were actually in the ‘red’ zone, and it was the window-dressing that made it appear less so.
The situation has never been so precarious in the long history of the IR in independent India. Only a decade ago, in 2007–08, the IR was receiving accolades for its robust growth in profitability, which matched some of the more established multinational companies of the world. The railway minister of that time earned rave reviews in the media for scripting a turnaround in the finances of the railways and was temporarily anointed the “Management Guru”[3] who could “milk a cow”.
What has gone wrong? Any exercise in diagnosing the situation will have to be anchored to a sound analysis of how the railway finances have been handled in the last six decades. The IR’s current structure was formulated in 1951 by amalgamating scores of princely state railways, privately owned railways, and the erstwhile British government-owned railways. Since then, it has delivered a yeoman service in transporting people and goods throughout the length and breadth of this vast country. However, the IR has always been torn between the twin goals of commercial success and social welfare, resulting in its freight transportation being assiduously exploited to cross-subsidise passenger fares. The freight-rate structure of the IR is now heavily skewed, and pipelines and road transport compete with rail quite successfully. Today, the IR has the highest freight rates in the world while offering cheapest passenger travel.[4]
Since political compulsions preclude any possibility of bringing a reasonable balance in the passenger-fare structure and freight-rate policy, the railway administration must explore avenues of reducing its expenditure on transportation. This paper studies the IR’s “asset productivity” to arrive at various measures that can reduce the working expenditure as well as the capital deployed.
Recent Infusion of Capital in Railways
Over the years, traffic on the IR has always shown growth of around three to four percent. While this is slow, to sustain even this level of steady growth, IR has had to regularly invest capital in its system (see Table 1).
| Table 1: Indian Railways Investments vis-à-vis Growth in Freight |
| Five-year plan |
Capital investment |
Current (inflation adjusted) value of past investment[5] |
Originating tonne in the beginning |
Originating tonne in the end |
Growth in freight
(CAGR) |
Originating NTKM in the beginning |
Originating NTKM in the end |
Growth in NTKM (CAGR) |
| INR Billion |
Million Tonne |
% |
Million Tonne-Kilometres |
% |
|
Up to V Plan
(1950–78)
|
47.23 |
877.82 |
93.0 |
237.3 |
3.4 |
44,117 |
162,687 |
4.77 |
|
VI Plan
(1980–85)
|
65.85 |
654.49 |
217.8 |
264.8 |
3.99 |
155,995 |
182,161 |
3.15 |
|
VII Plan
(1985–90)
|
165.49 |
1,093.14 |
264.8 |
334.3 |
4.77 |
182,161 |
236,917 |
5.4 |
|
VIII Plan
(1992–97)
|
323.06 |
1,137.65 |
360.0 |
423.4 |
3.3 |
256,895 |
279,992 |
1.74 |
|
IX Plan
(1997–02)
|
457.25 |
1,200.67 |
423.4 |
522.2 |
4.28 |
279,992 |
336,445 |
3.74 |
|
X Plan
(2002–07)
|
840.03 |
1,734.68 |
522.2 |
744.6 |
7.35 |
336,445 |
483,422 |
7.52 |
|
XI Plan
(2007–12)
|
1,898.38 |
2,464.87 |
744.6 |
975.2 |
5.54 |
483,422 |
668,618 |
6.7 |
|
XII Plan
(2012–17)
|
4,192.21 |
4,192.21 |
975.2 |
1,110.9 |
2.6 |
668,618 |
620,858 |
-1.47 |
| Source: Tabulated by the authors, based on statistics from the Indian Railways Year Book 2016–17 and the IR Data Book.[6] |
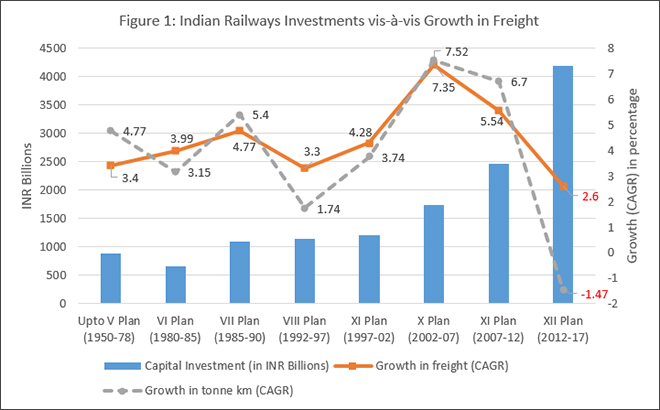 The capital infusion in the IR in the five-year period of 2012–17 was 70-percent higher than in the 2007–12 period. Despite this substantial growth in capital, the freight traffic (the IR’s bread and butter) grew only at a tepid pace of 2.6 percent and the total net tonne-km (NTKM)—the key indicator of freight earnings—clocked a negative growth of 1.47 percent.
The railway administration has repeatedly highlighted the perennial shortage in the Indian government’s capital infusion in the IR. In the budget of 2015, the then minister for railways tried to accelerate the infusion of capital by declaring a plan to invest INR 8,500 billion (US$ 118.56 billion) in five years, at par with world standards.[7] A loan of INR 1,500 billion (US$ 20.92 billion) from Life Insurance Corporation of India (LIC), India’s premier public insurance company, was touted as the first step in this direction.[8]
This paper attempts to decipher why such a liberal infusion of capital has not energised growth in freight and profitability. Negative growth in NTKM is, to say the least, mysterious. This analysis unpacks how “asset productivity” is measured and what it comprises. The paper suggests ways to improve this parameter and tries to ascertain if it is possible to catalyse the IR’s profitability.
First, the term ‘asset’ must be understood in the context of the IR, including how it is created and how its profitability can be assessed. It is also necessary to understand how various productivity indices are measured in statistical terms. Since the maintenance of railway statistics is a vast and esoteric subject, a discussion of how various statistical units are created is essential to ensure that their comparisons do not give a vitiated result.
Asset Creation
For its output of transportation, the railway needs three kinds of assets: immovable assets, movable assets, and human-resource assets. This section will discuss the impact of the first two on the performance and profitability of the IR.
Immovable Assets
Comprising the bulk of immovable assets are the railway tracks, bridges constructed over rivers, culverts to protect smaller water channels, and level crossings. Other immovable assets are signalling equipment required for the safe running of trains, the overhead equipment for electric operation, and buildings such as stations, workshops and administration offices. To lay tracks, a substantial tract of land is required. The appropriate cost of acquiring land is decided based on the various provisions contained in the Indian Railway Act and other central- and state-government acts, in line with “The Right to Fair Compensation and Transparency,” as stated in the Land Acquisition, Rehabilitation and Resettlement Act, 2013.
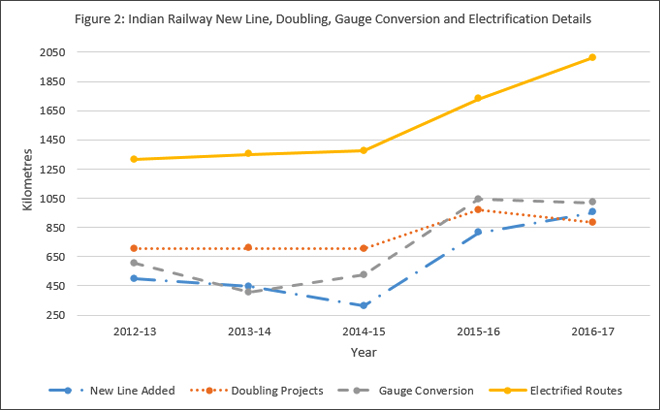
Doubling projects, when completed, give immediate relief on a congested route as it more than doubles the capacity of a route on which a purported traffic density is proven. On the other hand, gauge conversion and new line projects do not always provide extra capacity or relief in traffic congestion. In certain regions, they provide alternate routes to divert traffic from an already congested route. Often, a new line or a gauge conversion project is commissioned only to connect an underdeveloped region with the mainstream flow of trade and commerce. In such cases, the IR can increase its volume of traffic carried. All electrification works are justified only on grounds of ‘improved capacity’ on a route. Signalling and telecommunication projects help in improving either capacity or safety or, occasionally, both.
Table 2 lists the total quanta of assets that materialised in the IR under this head in the last five years.
| Table 2: Indian Railway Immovable Asset Creation (2012–13 to 2016–17) |
| Year |
New line added |
Doubling projects |
Gauge conversion |
Electrification |
Capital infusion in signalling and telecommunication (INR billion) |
Annual capital infusion in immovable assets (INR billion) |
| Km added |
Capital infusion
(INR billion)
|
Km added |
Capital infusion
(INR billion)
|
Km added |
Capital infusion
(INR billion)
|
Km added |
Capital infusion
(INR billion)
|
| 2012-13 |
501 |
61.80 |
705 |
24.7 |
605 |
24.01 |
1,317 |
9.64 |
9.37 |
129.52 |
| 2013-14 |
449 |
66.05 |
708 |
29.61 |
404 |
28.74 |
1,350 |
12.63 |
8.99 |
146.02 |
| 2014-15 |
313 |
84.01 |
705 |
38.59 |
527 |
35.20 |
1,375 |
13.87 |
10.02 |
181.69 |
| 2015-16 |
813.1 |
157.90 |
973 |
104.72 |
1,042 |
36.16 |
1,730 |
22.65 |
8.93 |
330.36 |
| 2016-17 |
953.2 |
159.70 |
882 |
90.93 |
1,020 |
37.70 |
2,013 |
28.71 |
9.52 |
326.56 |
| Total |
3,029.3 |
529.46 |
3,937 |
288.55 |
3,598 |
161.81 |
7,785 |
87.50 |
46.83 |
1,114.15 |
| Total capital infusion in immovable assets from 2012–13 to 2016–17 was INR 1,114.15 billion. |
| Source: Tabulated by the authors, based on the statistics from the Indian Railways Year Books 2016–17, 2015–16, 2014–15, 2013–14 and 2012–13.[9] |
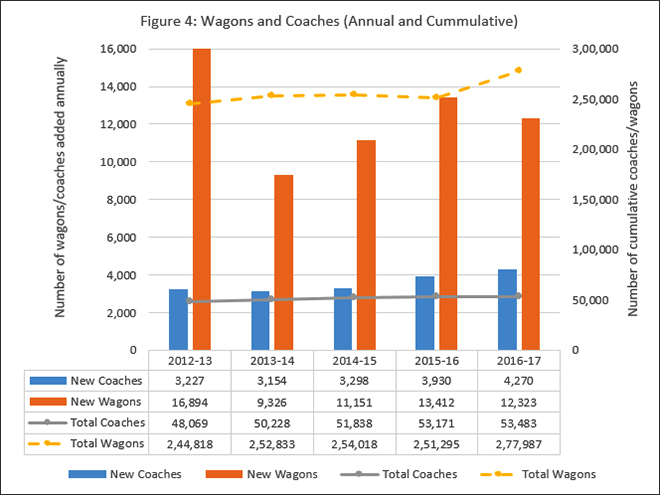
Movable Assets
Movable assets are also known as “rolling stock.” Locomotives of various kinds, wagons, coaches and railway cranes constitute this kind of assets, which provide transportation for people and material at reasonable yet profitable rates. Wagons are used to transport goods, and coaches to transport people. Both assets need a locomotive to haul them. To increase transport output, the IR needs higher horse-power locomotives, higher axle-load wagons and superior coaches to carry more passengers. To earn a profit, the IR must make full use of the hauling power of locomotives and the higher payload in wagons and coaches, to achieve a higher density of traffic/m of track.
Table 3 lists the movable assets acquired by the railways and the capital expenditure made for the same in the last five years.
| Table 3: Indian Railway Rolling Stock (2012–13 to 2016–17) |
| Year |
Manufactured |
Cumulative holding |
Capital infusion in rolling stock (INR billion) |
| Diesel locos |
Electric locos |
Coaches |
Wagons |
Diesel locos |
Electric locos |
Coaches |
Wagons |
| 2012–13 |
305 |
270 |
3,227 |
16,894 |
5,345 |
4,568 |
48,069 |
244,818 |
181.99 |
| 2013–14 |
352 |
264 |
3,154 |
9,326 |
5,633 |
4,823 |
50,228 |
252,833 |
172.97 |
| 2014–15 |
339 |
250 |
3,298 |
11,151 |
5,714 |
5,016 |
51,838 |
254,018 |
162.75 |
| 2015–16 |
332 |
280 |
3,930 |
13,412 |
5,869 |
5,214 |
53,171 |
251,295 |
179.13 |
| 2016–17 |
350 |
292 |
4,270 |
12,323 |
6,023 |
5,399 |
53,483 |
277,987* |
196.11 |
| Total capital infusion in movable assets from 2012–13 to 2016–17 was INR 892.95 billion. |
| Source: Tabulated by the authors, based on the statistics from the Indian Railways Year Books 2016–17, 2015–16, 2014–15, 2013–14 and 2012–13.[10] |
| * The figure of 277,987 wagon in 2016–17 is misleading and may need correction, since calculations based on the number of wagons held in 2015–16 and manufactured in 2016–17 do not lead to this figure. |
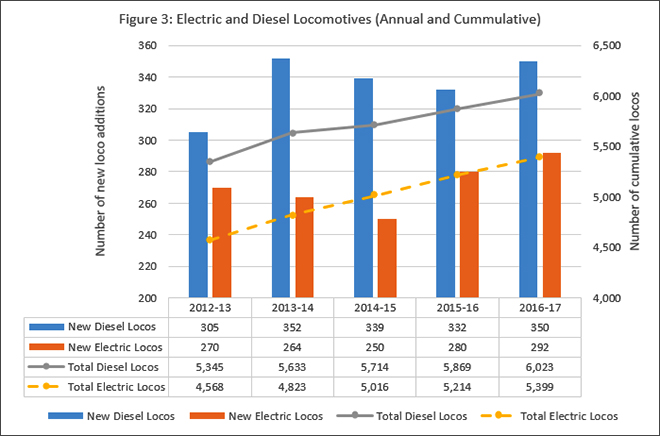
 Tables 2 and 3 show that in the period from 2012–13 to 2016–17, IR made a gigantic investment of INR 2,007.1 billion (US$ 28 billion) in creating assets: INR 1,114.15 billion (US$ 15.55 billion) for immovable assets; INR 892.95 billion (US$ 12.46 billion) for movable assets.
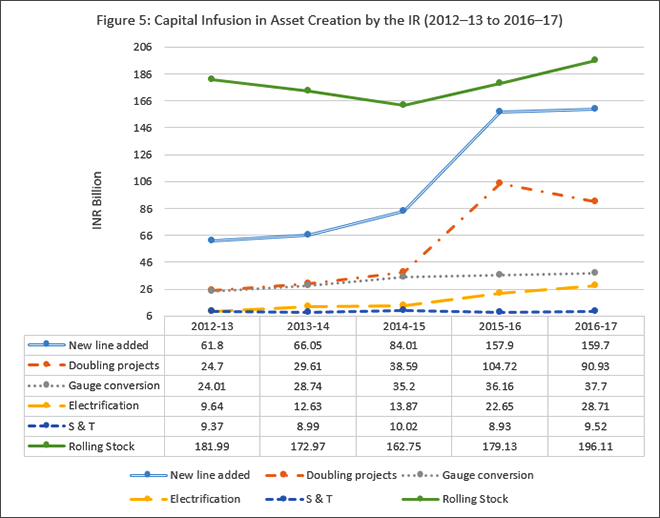
Such a high level of capital infusion was unprecedented and should have supported a healthy growth in the IR’s traffic output. However, this was not the case (see Table 4).
|
Table 4: Growth in the Indian Railways’ Originating Passengers and Freight
Volume (2012–13 to 2016–17)
|
| Year |
Total passengers
(million)
|
Percentage rise/fall
(year-on-year)
|
PKM (million) |
Percentage rise/fall
(year-on-year)
|
Freight carried
(million tonne)
|
Percentage rise/fall
(year-on-year)
|
NTKM
(million)
|
Percentage rise/fall
(year-on-year)
|
| 2012–13 |
8,421 |
NA |
10,98,103 |
NA |
1,008.1 |
NA |
649,645 |
NA |
| 2013–14 |
8,397 |
– 0.3% |
1,140,412 |
+ 3.8% |
1,051.6 |
+ 4.3% |
665,810 |
+ 2.4% |
| 2014–15 |
8,224 |
– 2.1% |
1,147,190 |
+ 0.5% |
1,095.3 |
+ 4.1% |
681,696 |
+ 2.3% |
| 2015–16 |
8,107 |
– 1.4% |
1,143,039 |
– 0.3% |
1,101.5 |
+ 0.6% |
654,481 |
– 3.9% |
| 2016–17 |
8,116 |
+ 0.1% |
1,149,835 |
+ 0.5% |
1,106.2 |
+ 0.4% |
620,175 |
– 5.2% |
| Source: Tabulated by the authors, based on the statistics from the Indian Railways Year Books 2016–17, 2015–16, 2014–15, 2013–14 and 2012–13.[11] |
The results are counterintuitive, to say the least. The number of passengers carried in 2016–17 is much less than it was in 2012–13. Even the freight carried in 2016–17 is almost the same as that in the previous year.
In the same four-year period, the IR expenses have steadily grown at a CAGR of 9.26 percent (see Table 5). However, its growth in revenue—despite a hike in freight rate and a marginal increase in passenger fare (though only for AC travel, which accounts for four percent of the total passenger traffic)—has lagged behind, at a CAGR of 7.51 percent. The net revenue has consequently plummeted to almost nil.[12]
| Table 5: Indian Railways Finances (2012–13 to 2016–17) |
| Year |
Total working expense
(INR billion) |
Gross traffic receipts
(INR billion) |
Net revenue receipts
(INR billion) |
| 2012–13 |
1,115.72 |
1,237.32 |
136.15 |
| 2013–14 |
1,303.21 |
1,395.58 |
117.49 |
| 2014–15 |
1,429.96 |
1,567.11 |
168.38 |
| 2015–16 |
1,478.36 |
1,643.34 |
192.28 |
| 2016–17 |
1,590.30 |
1,652.92 |
49.13* |
| Source: The Indian Railways Year Books 2016–17, 2015–16, 2014–15, 2013–14 and 2012–13.[13] |
| *As per the CAG report on Railway Finances, the IR has appropriated INR 5,026 crore less to the pension fund for the year 2016–17. |
The IR faces competition from the road and air sectors. The railways carried 89 percent of India’s freight traffic in 1951, but as of 2012, was left with only a 32-percent share. The passenger business of the IR, too, has suffered due to competition from the airline industry (which has been growing at more than 15 percent for last four years)[14] and the roadways (where Volvo-type AC buses are run on an improved road network).
Railway Statistics: Generation of Productivity Indices
Before analysing the performance of the IR, it is important to understand how such performance is assessed and reviewed, which “productivity indices” are relevant for the purpose, and how they are prepared.
Productivity Indices
To understand the phenomenon of ‘returns’ on the per-unit investment in infrastructure, the quantifiable productivity parameters must be compared. These parameters are derived statistics, obtained from primary statistics such as route kilometre, train kilometre, number of wagons and locos, and the total volume of traffic. Transport is a perishable commodity; neither infrastructure nor service capacity can be stored. Unused train paths, idling locos or wagons, and trains moving with partial loads all lead to underutilisation of capacity. Higher vehicle productivity leads to better commercial performance for any transport service provider and higher infrastructure utilisation facilitates the viability of every infrastructure project.
For vertically integrated railways such as the IR, the need for higher vehicle productivity is closely connected with the ineluctability of better infrastructure exploitation.
The derived statistics, crucial to measure quantitatively and qualitatively the usage of the various assets acquired by the IR, must be selected carefully to ensure an unbiased and holistic assessment of productivity. This paper relies on the following four derived units, which have been obtained from four fundamental units.
1. Primary Units
- Quantity: It is the volume of freight that consists of the commodities carried by the IR. It is measured in tonnes. Quantity can also be the number of passengers carried by the IR under its passenger business.
- Number of locomotives, wagons and coaches: The wagon and coaches owned by the IR are distributed divisionally and zonally. The number of wagons and coaches available to transport commuters and carry freight indicates the potential of services that can be undertaken in those regions.
- Distance: This specifies the journey of trains on the system. It is measured in kilometres.
- Duration: This unit signifies the number of hours or days for which railway operations are carried out.
2. Fundamental Units
- Wagon-kilometres: This is calculated by multiplying the train kilometres for each train by the number of wagons (earlier in terms of four-wheeler wagons and, since 2007–08, in terms of eight-wheelers) it carries.
- Wagon-day: It is the total number of wagons available for traffic in a system. To ensure a common standard for all zonal railways/divisions, the midnight holding is taken as the number of wagons available daily. It includes sick wagons undergoing repairs.
- Engine-hours: This unit gives the total number of hours the engines were available for traffic and is calculated from the time an engine leaves a shed until it returns to one.
- NTKM: This is calculated from the fundamental unit of train kilometres multiplied by the net load carried on that train and aggregated for a defined period (e.g. a day, month or year) in a defined system (e.g. a division or zone in the IR).
3. Derived Units
- Wagon-km/wagon-day: This unit indicates the average distance travelled by a wagon in a day after taking into consideration detentions suffered by the wagon in yards and in the process of loading and unloading at stations or sidings. It measures the mobility of the wagon. Wagon-km/wagon-day mainly comprises factors that depend on operating efficiency. A drop in this figure indicates that there is either congestion on the system or no demand for wagons, such that some of them are idling.
- NTKM/wagon-day: This unit reflects the extent to which the capacity of a wagon has been utilised in moving traffic. It denotes not only the movement of the wagon but also the percentage of loaded wagon-kilometrage and the load-per-wagon. This indicator is influenced by the nature of the commodity loaded. Since freight charges are levied in terms of tonne-km, this unit is a reliable marker for assessing the earnings of a system. Any drop indicates that the finances of the system are under stress.
- NTKM/engine-hour (in use): This derived unit is the best marker for assessing the financial viability of any railway system. A locomotive is the costliest movable asset that the IR acquires. It is also the most important asset because no train can be run without an engine attached to it. Presently, one locomotive costs around INR 200–300 million (US$ 2.8-4.2 million) (depending on the type of the loco). It is costlier than the rake of 50 to 60 wagons that it hauls. An increase in this parameter indicates better utilisation of the IR’s movable assets as well as immovable assets, since there is bound to be a higher density of trains on the tracks. Ultimately, any increase in NTKM/engine-hour reflects better profit margins.
- Wagon turn-round (WTR): The turnaround of a wagon on a system is the interval between two successive times the wagon is utilised and is measured in terms of days. WTR involves the loading time, the time taken to move the nearest yard, the time the train spends in motion, the time taken by the processes in marshalling yards, and the empty movement before utilisation. It is inversely dependent on the speed of trains and directly dependent on the detention in yards and wagon-handling. WTR is linked with the lead of the freight movement. A falling lead should result in reduction in WTR because the train should complete its run early. It will also mean that the wagon will now spend a larger proportion of time standing for loading and unloading operation. The lesser the WTR, the better is the performance of the railways.
There are multiple statistical indices to assess the productivity and profitability of the IR’s assets. However, this paper focuses on the above four indices, which it considers most reliable and germane to the subject under study.
Financial Indicators
Several parameters can be used to study the finances of a commercial organisation. As previously stated, the IR, as a government entity, is unique in terms of dispensing both commercial and social services. It sources its funds for capital investments and operational expenses by generating its own revenue (“Internal Sources”) in addition to the infusion of capital from the central government (“General Budgetary Support (GBS)”) and raises investments through public bonds and loans, (“Extra Budgetary Resources (EBR)”).
For the ease of assessing the state of finances of the IR, this paper primarily focuses on two indicators, viz. operating ratio and net revenue receipts as a percentage of capital-at-charge.
- Operating Ratio: It states the percent to be spent to earn one unit of revenue. The ratio is calculated by dividing operating expenditure with operating revenue. The operating expenditure is all cash and non-cash expenses, including depreciation and appropriation to the pension fund but excluding the dividend payable to the Government of India. (Post the merger of the railway budget into the union budget in 2017, the IR does not have to pay the dividend). The operating revenue is gross traffic receipts. Thus, the lower the operating ratio, the more efficient the enterprise.
- Net revenue receipts as a percentage of capital-at-charge: Every year, IR infuses capital into its assets and infrastructure for operating and expanding its passenger and freight businesses. The term ‘capital-at-charge’ is the cumulative investment made by the railways since its formation in 1951. It denotes the net worth of the organisation till date. On the other hand, the net revenue receipts indicate the total profits made by the railways per year. This capital is then distributed for the capital and operational expenditure for the next year. Thus, ‘net revenue receipts as a percentage of capital-at-charge’ fundamentally means the return on the net worth of the organisation.
After the merger of the railway budget with the general budget in 2017, the IR is no longer required to pay a dividend on the capital invested in it. As the operating ratio is inching towards a figure of 100 in the official statistics, and the CAG report suggesting that it may be well past 100, some have started arguing that neither the operating ratio nor the net revenue receipts as a percentage of capital-at-charge are true indicators of the railway’s financial health. However, an analysis reveals that this argument is fallacious. While the two budgets have been merged, the financial stability of an organisation as huge as the IR is paramount for the financial stability of the country. On the plus side, the IR finances no longer have to undergo the rigours associated with the preparation of a budget to be placed on the Parliament floor. Yet, an internal mechanism to subject it to a vigorous analysis must be created to maintain a focus on its profitability.
Table 6 lists the values for the two financial indicators for the period between 2012–13 and 2016–17. The operating ratio rose to 96.5, while the net revenue receipts as a percentage of capital-at-charge went down to two percent. These numbers are discussed later in the paper.
| Table 6: Indian Railways Financial Indicator (2012–13 to 2016–17) |
| Year |
Capital-at-charge
(INR billion) |
Gross traffic receipts (INR billion) |
Total working expense
(INR billion) |
Net revenue receipts
(INR billion) |
Operating ratio |
Net revenue receipts as a percentage of capital-at-charge |
| 2012-13 |
1,448.12 |
1,237.33 |
1,115.72 |
136.15 |
90.19 |
9.4 |
| 2013-14 |
1,701.68 |
1,395.58 |
1,303.21 |
117.49 |
93.60 |
6.9 |
| 2014-15 |
1,979.92 |
1,567.11 |
1,429.96 |
168.38 |
91.25 |
8.5 |
| 2015-16 |
2,246.85 |
1,643.34 |
1,478.36 |
192.28 |
90.48 |
8.6 |
| 2016-17 |
2,490.08 |
1,652.92 |
1,590.30 |
49.13 |
96.50 |
2.0 |
| Source: Indian Railways Year Books 2016–17, 2015–16, 2014–15, 2013–14 and 2012–13.[15] |
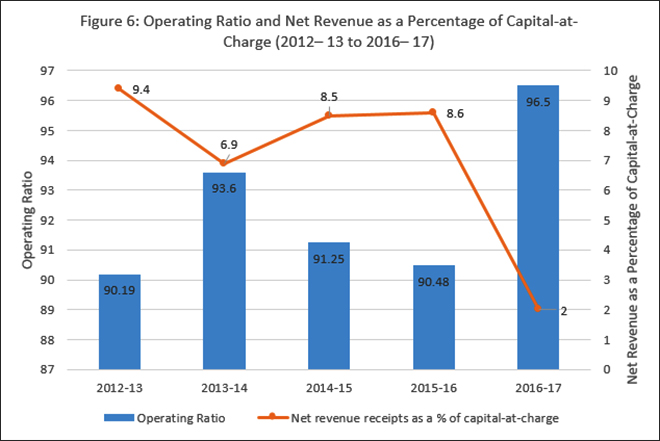
Table 7 collates the statistical productivity indices to be studied, for the years 2012–13 to 2016–17.
| Table 7: Asset Productivity Indicators (from 2012–13 to 2016–17) |
| Year |
Lead (km) |
Wagon turn-round (days)* |
NTKM/Wagon-day |
NTKM/engine-hour |
Wagon-km/wagon-day |
| 2012–13 |
644 |
5.18 |
8,453 |
19,468 |
265.5 |
| 2013–14 |
633 |
5.13 |
8,547 |
18,804 |
264.5 |
| 2014–15 |
622 |
4.98 |
8,113 |
18,605 |
220.0 |
| 2015–16 |
594 |
5.18 |
7,510 |
17,507 |
214.5 |
| 2016–17 |
561 |
5.32 |
7,359 |
16,337 |
204.2 |
| *lower WTR results in better profitability |
| Source: Based on the statistics from the Indian Railways Year Books 2016–17, 2015–16, 2014–15, 2013–14 and 2012–13.[16] |
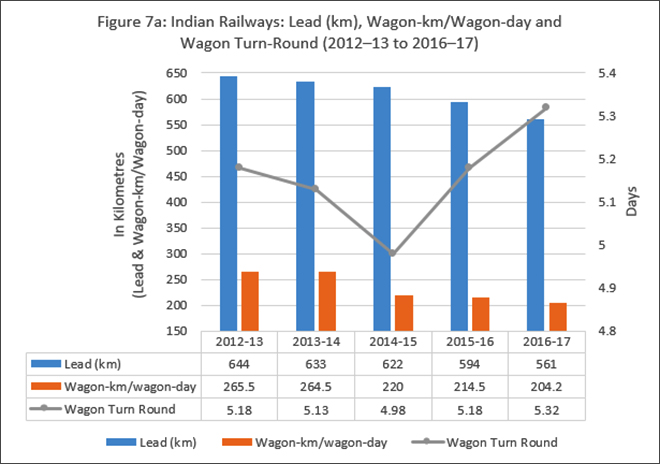
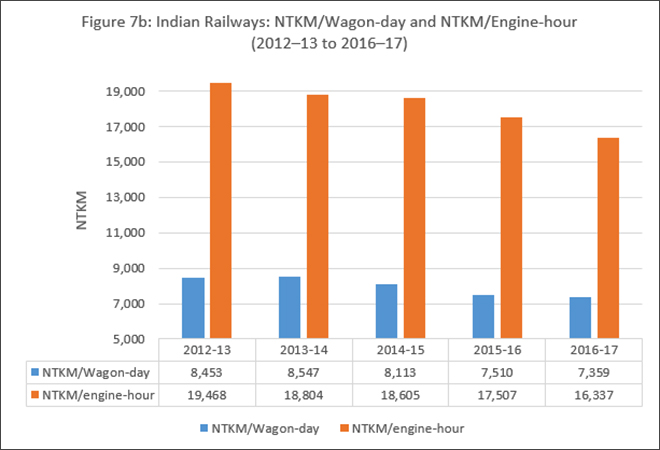 Figures 6 and 7 show the gravity of the situation, with WTR relentlessly increasing and both NTKM per wagon-day and NTKM per engine-hour showing a steady decline.
The IR has existed for more than a century. During all these years, its performance has seen both highs and lows. Thus, it is useful to check the last three decades for situations where asset productivity indices and financial indicators of the IR saw similar declines. Studying the measures taken in the past can guide us in finding solutions for present-day situation.
A Review of the IR’s Performance in the Last Three Decades
The productivity indices of the IR are currently in a steady decline. Before this, similar dips in performance have been seen twice in the history of the railways: during 1978–80 and 2000–02.
Decline in Productivity Indices in 1978–80
Table 8 shows the state of the IR’s finances from the year 1977–78 to 1982–83. The operating ratio had touched 96 and the net revenue receipts as a percentage of capital-at-charge had reached 2.1 percent.
| Table 8: Indian Railways Financial Indicators (1977–78 to 1982–83) |
| Year |
Capital-at-charge
(INR billion) |
Gross traffic receipts
(INR billion) |
Total working expense
(INR billion) |
Net revenue receipts
(INR billion) |
Operating ratio |
Net revenue receipts as a percentage of capital-at-charge |
| 1977–78 |
47.97 |
21.23 |
17.50 |
3.52 |
82.99 |
7.4 |
| 1978–79 |
50.24 |
21.51 |
18.68 |
2.61 |
87.51 |
5.2 |
| 1979–80 |
54.85 |
23.38 |
21.42 |
2.27 |
91.49 |
4.1 |
| 1980–81 |
60.96 |
26.24 |
25.37 |
1.27 |
96.07 |
2.1 |
| 1981–82 |
66.98 |
35.38 |
31.82 |
4.03 |
89.4 |
6 |
| 1982–83 |
72.51 |
43.76 |
38.83 |
5.54 |
88.34 |
7.6 |
| Source: Tabulated by the authors, based on the statistics from the Indian Railways Key Statistics (1950–51 to 2013–14)[17]. |
During this period, there was a decline in asset productivity indicators (see Table 9), which resulted in a decline in the financial indicators of the IR.
| Table 9: Asset Productivity Indicators (fr om 1975–76 to 1979–80) |
| Year |
Lead (km) |
Wagon turn-round (in days) |
NTKM/Wagon-day |
Wagon-km/wagon-day |
| 1977–78 |
713 |
13.3 |
1,045 |
81.9 |
| 1978–79 |
721 |
14.3 |
976 |
75.9 |
| 1979–80 |
749 |
15.1 |
972 |
73.3 |
| 1980–81 |
754 |
15.2 |
982 |
73.4 |
| 1981–82 |
743 |
13.3 |
1,112 |
83.7 |
| Source: Based on the statistics from the Indian Railways Key Statistics (1950–51 to 2013–14)[18] |
By 1980, the IR was in a severe financial crisis. The powerhouses were shutting down because the required volumes of coal could not reach them. There were sporadic shortages of food in Southern states and salt in the Northeastern states due to the IR’s inability to move them. It was the same with fertilisers, cement and even POL products (e.g. diesel, petrol and kerosene oil). In a desperate move, the then prime minister sacked the entire railway board in November 1980. A new board was constituted to turn the tide in a short span of time. The ‘mool mantra’ of this new board was to improve the productivity of assets. To understand this, phenomenon, one must delve further back in time.
India’s first two five-year plans were a resounding success. In April 1962, when the second five-year plan culminated, the IR was not far behind. The performance of the railways showed a consistent upward trend. From 1958 onwards, the IR drew up plans for rapid modernisation in consultation with various international agencies such as ADB and World Bank. As a result, the railways decided to opt for the following technologies.
1. Rolling Stock
- Locomotives: It was decided to upgrade from steam traction to electric traction (25 kV AC) directly on the congested coal-carrying routes in the Northern and Eastern regions. Elsewhere, steam traction was to be supplanted by diesel traction. Indigenous manufacturing capacities for both these types of locos (electric and diesel) were to be increased using ‘transfer of technology’.
- Wagons: Higher capacity wagons were adopted to support higher axle-load with better-designed bogies. The screw couplings, which had limitations on the trailing-load that could be hauled, were to be replaced by a central buffer coupler (CBC), to enable the hauling of heavier load. Additionally, the antiquated plain bearings on the wheels were to be replaced by roller bearings for fewer breakdowns and smoother runs.
- Coaches: Anti-telescopic steel-frame coaches were to replace the old wooden-bodied coaches for better safety.
2. Permanent Way
- Heavier rails (52 kg/m) on concrete sleepers were envisaged. The axle-load permitted on the track was to be increased to 22.9 tonne in phases.
- The lower-quadrant signalling was to be upgraded to upper-quadrant signalling, which was also known as “speed signalling.”
The general idea was to modernise the IR to carry heavier loads at higher speeds to enhance throughput on all routes and drastically reduce the cost of operation by clocking higher asset productivity.
These were lofty ideas, and work began in earnest. By 1962, the IR was steadily moving in the right direction. However, on 20 October 1962, the Chinese struck on both the Eastern and Northern flanks. This war set the IR back by more than two decades in its modernisation efforts since the defence expenditure was scaled up sharply. The Pakistan war of 1965 further aggravated the situation. Steel produced in India was diverted for the war effort, e.g. manufacturing of tanks, armoured vehicles, trucks. Capital investment in the IR was drastically reduced. Consequently, by the mid-1970s, railway infrastructure was reduced to a mishmash of every ilk. Roller-bearing wagons were mixed with plain-bearing wagons. Screw-coupling wagons were mixed with CBC wagons, and steam traction still ruled the roost.
The new technology rolling stock had come at a heavy capital cost. However, as it was not segregated from the old ones, little benefit was derived from the huge investment made in procuring it. Thus, there was a decrease in asset productivity despite an increase in capital investment. Since steam traction was not yet obsolete, freight trains could only carry 1,800–2,000 tonne, despite the availability of diesel and electric locos, which could haul heavier loads of up to 2,400 tonne. Moreover, since screw-coupling wagons were mixed with CBC wagons, the load was restricted to a maximum of 2,240 tonne, lest the coupling may break.
The new railway board formed in 1980 set matters right in a few months by segregating the old stock from the new, changing the wagon examination rules, eliminating steam traction and increasing crew runs. Soon, there was a spurt in asset productivity, and the IR was back on an upward trend of profitability as can be seen in Table 9.
Decline in Productivity Indices in 2000–02
A similar decline occurred again after about 20 years, around the early 2000s. The net surplus of the IR was steeply declining, and it did not have enough resources to even disburse adequate funds in the depreciation reserve fund (DRF). As the replacement of old and worn-out assets started to get delayed, there was an increase in the frequency of rail accidents. Ultimately, the Government of India had to spare INR 170 billion (US$ 2.37 billion) in 2003, from the general budget, placed under the specially created “Rail Safety Fund,” to be utilised in five years. This capital was used for replacing old rails, distressed bridges and other safety-related activities. Table 10 shows the IR finance indicators for this period. The operating ratio was 98.34 in 2000–01.
| Table 10: Indian Railways Financial Indicators (1998–99 to 2003–04) |
| Year |
Capital-at-charge
(INR billion) |
Gross traffic receipts (INR billion) |
Total working expense (INR billion) |
Net revenue receipts (INR billion) |
Operating ratio |
Net revenue receipts as a percentage of capital-at-charge |
| 1998–99 |
368.29 |
296.20 |
278.35 |
21.41 |
93.34 |
5.8 |
| 1999–00 |
397.72 |
229.39 |
308.44 |
27.36 |
93.31 |
6.9 |
| 2000–01 |
430.52 |
348.81 |
346.67 |
10.71 |
98.34 |
2.5 |
| 2001–02 |
471.47 |
378.38 |
362.93 |
23.38 |
96.02 |
5 |
| 2002–03 |
510.99 |
410.68 |
380.26 |
38.30 |
92.34 |
7.5 |
| 2003–04 |
560.62 |
429.05 |
394.82 |
44.79 |
92.19 |
8 |
| 2004–05 |
593.47 |
473.70 |
427.59 |
52.74 |
90.98 |
8.9 |
| 2005–06 |
658.78 |
544.91 |
452.92 |
80.06 |
83.72 |
12.2 |
| 2006–07 |
760.30 |
627.32 |
490.47 |
144.53 |
78.68 |
19 |
| 2007–08 |
737.45 |
717.20 |
544.62 |
183.34 |
75.94 |
24.8 |
| Source: Tabulated by the authors, based on statistics from the Indian Railways Key Statistics (1950–51 to 2013–14).[19] |
The asset productivity indicators in the same period were also on a decline (see Table 11).
| Table 11: Asset Productivity Indicators (from 1998–99 to 2007–08) |
| Year |
Lead (km) |
Wagon turn-round (days) |
NTKM/Wagon-day |
Wagon-km/ wagon-day |
| 1998–99 |
669 |
8.2 |
1,904 |
169.1 |
| 1999–00 |
669 |
7.7 |
2,027 |
177.4 |
| 2000–01 |
660 |
7.5 |
2,042 |
179.0 |
| 2001–02 |
677 |
7.2 |
2,223 |
191.6 |
| 2002–03 |
681 |
7.0 |
2,468 |
204.8 |
| 2003–04 |
684 |
6.7 |
2,574 |
187.8 |
| 2004–05 |
677 |
6.4 |
2,677 |
204.4 |
| 2005–06 |
660 |
6.08 |
2,960 |
217.5 |
| 2006–07 |
661 |
5.49 |
3,238 |
230.1 |
| 2007–08 |
657 |
5.23 |
3,539 |
248.9 |
| Source: Based on the statistics from the Indian Railways Key Statistics (1950–51 to 2013–14).[20] |
Tables 10 and 11 highlight the resemblance between the situation in 2000 and the one in 1980. In 2000–01, the lead is down by 18 km from the previous year, and both the NTKM/wagon-day and wagon-km/wagon-day are almost static. This shows that the capital infusion in the previous years did not yield much result, and consequently, the net revenue receipts as a percentage of capital-at-charge declined to 2.5 percent.
The IR had, by that time, invested heavily in 60 kg/m rails, concrete sleepers, higher horsepower locos, multi-aspect colour-light signalling, casnub bogies, better-designed wagons, etc. However, this high investment did not have commensurate results because there was no relaxation in the loadability of wagons and the higher speed of freight trains. In 2005, the IR managed to increase its freight earnings by more than 10 percent, by making optimal use of the wagon design and enhancing the carrying capacity of the wagons by eight tonne (on most routes) or six tonne (on certain routes with specific track structure). In addition, the IR began to weigh every loaded wagon after dispatch to protect against overloading, which was endemic. More than a hundred in-motion weigh bridges were commissioned for this purpose. As a result of these measures, annual freight revenue increased significantly.
Revenue from passenger traffic was also enhanced by ensuring full load-running (24-coach trains) of all popular mail/express services on all days of the week. All new passenger services were introduced primarily on commercial considerations. Many trains were speeded up to give them super-fast status to increase earnings.
History Repeats Itself: Decline in Productivity Indices in 2015–18
Fifteen years later, the IR is once again faced with a decline in profits. As seen in Tables 6 and 7, the financial indicators as well as the asset productivity indices for the years 2012–13 to 2016–17 show a steady drop.
The financial condition of the IR is deteriorating, with the operating ratio hitting 96.5 percent (official figure) in the year 2016–17. The net revenue was INR 49.13 billion (US$ 700 million) rupees in 2016–17, down from INR 192.28 billion (US$ 2.68 billion) in the year 2015–16. The IR did not pay any dividend to the Indian government in the year 2016–17, since the railway budget was merged with the union budget. The IR had paid a dividend of INR 87.22 billion (US$ 1.22 billion) in the year 2015–16. Had the budgets not been merged, and the railways were to pay a dividend, the net revenue receipts would have been negative. Moreover, the CAG report on railway finances for the year 2016–17 states that the actual amount to be appropriated to the pension fund was INR 400.26 billion (US$ 5.58 billion), of which only INR 350 billion (US$ 4.88 billion) was appropriated. Thus, the total working expenditure was understated by INR 50.26 billion (US$ 700 million). As per the CAG report, had the actual amount required to meet the expenditure under the pension fund been appropriated, there would have been a negative balance of INR 1.13 billion (US$ 15.76 million), putting the IR in losses for the first time since 1980. The operating ratio, too, would be around 99.54 percent, had the actual expenditure been appropriated.[21]
The IR had appropriated INR 77.75 billion (US$ 1.08 billion) towards the DRF in 2014–15. This figure should have increased but was consistently reduced over the next two years: INR 56 billion (US$ 780 million) in 2015–16 and INR 52 billion (US$ 730 million) in 2016–17.
The Depreciation Liability of the IR in a Year?
The following model is used to make an approximation of the percentage share of DRF in the total capital employed in any year. The capital is bifurcated in two groups, viz. immovable and movable assets. For immovable assets, the land cost is separated, as it does not depreciate, and rail and other materials (such as sleepers, points and crossings, and fastenings) are given a life of 20 years. The cost of land is maximum: 50 percent for new lines, 20 percent for doubling projects and 10 percent for gauge conversion. For movable assets, a codal life of 30 years is assumed.
| Table 12: Calculation of Asset Depreciation of Immovable Assets for the Year 2016–17 |
| Immovable assets |
Expenditure (INR billion) |
Component |
Percent of expenditure |
Actual expenditure (INR billion) |
Life
(years) |
Depreciation (percentage) |
Depreciation value
(INR billion) |
| New Lines |
159.7 |
Land |
50 |
79.85 |
100 |
– |
0 |
| Rail & other |
50 |
79.85 |
20 |
5% |
3.99 |
| Doubling |
90.93 |
Land |
20 |
18.19 |
100 |
– |
0 |
| Rail & other |
80 |
72.75 |
20 |
5% |
3.64 |
| Gauge Conversion |
37.70 |
Land |
10 |
3.77 |
100 |
– |
0 |
| Rail & other |
90 |
33.93 |
20 |
5% |
1.70 |
| Electrification |
28.71 |
– |
– |
– |
20 |
5% |
1.44 |
| Signalling |
9.52 |
– |
– |
– |
10 |
10% |
0.95 |
|
Total Expenditure
(INR billion)
|
326.56 |
|
|
|
|
Total Depreciation
(INR billion)
|
11.71 |
| Net depreciation for immovable assets is 3.6 percent. |
| Table 13: Calculation of Asset Depreciation for Movable Assets for the Year 2016–17 |
| Immovable Assets |
Expenditure (INR billion) |
Life (years) |
Depreciation (percentage) |
Depreciation value
(INR billion) |
| Locomotives, Wagons and Coaches |
196.11 |
30 |
3.33% |
6.53 |
| Net depreciation for movable assets is 3.33 percent. |
Tables 12 and 13 show that the IR must appropriate to DRF at least 3.5 percent of the total chargeable capital employed, to maintain its assets in good condition. If the net revenue receipts as a percentage of capital-at-charge falls below five percent, the IR’s financial health is at risk.
The analysis suggests that had money been properly appropriated to the pension fund, the operating ratio of the railways would have been well past 100 percent. It has been widely reported in media that, during April–September 2018, the IR’s operating ratio touched 117.31 percent.[22] According to the data available, the railways spent INR 791.52 billion (US$ 11.04 billion) under ordinary working expenses against the target of INR 759.94 billion (US$ 10.6 billion), during the first six months of 2018–19. It earned INR 255.92 billion (US$ 3.57 billion) from passengers against a target of INR 261.11 billion (US$ 3.64 billion). Its earning from freight movement was low, at INR 536.15 billion (US$ 7.48 billion) as against the target of INR 574.13 billion (US$ 8.01 billion). As of September 2018, the IR’s total earning was INR 834.25 billion (US$ 11.64 billion) against the target of INR 909.04 billion (US$ 12.68 billion).[23] At the time of preparing the annual budget, the appropriation for DRF and pension fund will kick in too, which is bound to give an even bleaker figure for the operating ratio.
Comparison with International Railroads
To understand the full extent of the underutilisation of the IR’s assets, the productivity indices of the IR must be compared with that of other railroads, especially Chinese and European ones. While the state-owned Chinese railroad has a comparable network and about the same number of passenger kilometre (PKM), it carries four times more freight than its Indian counterpart. Similarly, for freight, class-one American railroad employs about one-tenth the labour force of the IR but carry three times the freight. Thus, there is room for vast improvements in the utilisation of existing assets in the IR. Table 14 is a brief comparison between the IR and its peers, focusing on a few parameters.
| Table 14: Asset-Productivity Estimates |
| Country |
Year |
Network utilisation
(traffic units/route-km/year) millions
|
Loco productivity (traffic units/ loco/year) millions |
Wagon productivity (NTKM/wagon/day) |
Wagon-km/wagon-day |
Lead (km) |
| India |
2016–17 |
11 |
63 |
6,469 |
192 |
559 |
| USA |
2015 |
15 |
104 |
23,184 |
680 |
1623 |
| Russia |
2016 |
29 |
336 |
5,982 |
161 |
1916 |
| China |
2016 |
29 |
148 |
8,520 |
256 |
714 |
| Canada |
2016 |
9 |
175 |
19,942 |
518 |
1078 |
| Brazil |
2017 |
13 |
135 |
10,070 |
288 |
696 |
| Source: Data procured from the World Bank. |
|
Conclusion and Recommendations
The analysis shows that when the IR finances are distressed, net revenue receipts as a percentage of capital-at-charge goes down to two or three percent. In 1980–81, it was 2.1 percent, and in 2000–01, it was 2.5 percent. In 2016–17, it is again down to two percent, despite the IR having no liability for payment of dividend and appropriating INR 50 billion (US$ 700 million) less than required for the pension fund. In earlier terms, the net revenue receipts in 2016–17 would have been negative. The situation calls for urgent remedial measures, without which, the IR may sink into an irretrievable vortex of severe debt.
Railway asset productivity has currently taken a backseat. The management concerned with ‘superintending’ these aspects of railway operation is focused on ancillary activities when they should be looking at improving the IR’s productivity indices. It is crucial to revert to the basics.
The central question is how the situation can be salvaged and if the IR is positioned to exploit the heavy capital investment being poured into it. All useful capital investment is directed towards increasing the capacity in the system to handle higher volumes of traffic, and the target should thus be to enhance the ‘throughput’ of the system. All investments made into movable and immovable assets must result in better speeds of freight trains and increase the average speed of all trains in the system. The following actions can help improve the situation:
- Reintroduce the productivity test review: Until the 1990s, the IR employed a time-tested system of carrying out a ‘productivity test review’ for every capital investment made within five years of its commissioning for usage. This exercise was dropped for reasons unknown. Given the steep drop in asset productivity, there is an urgent need to reintroduce the ‘productivity test review’ system in all zonal railways.
- Redraw inter-station running time: The inter-station running time for various kinds of loads in combination with multiple variety of rolling stock must be revised or prepared afresh. Locomotives with better technology and higher horsepower must be exploited to run heavier freight trains at higher speeds, to cut down the inter-station running time by 20–25 percent. The superior—thus, costlier—rolling stock can be utilised to run freight trains at 100 km/hr, at least on Route A.[24] This is bound to give a fillip to the NTKM/engine-hour in use, which will lead directly to better profitability. The inter-station running time for all freight trains hauled by superior locomotives should be redrawn and communicated to the operating staff. Introducing a 100-km/hr speed for freight trains, with 100-km/hr fit wagons in loaded mode, will shrink the spacing between freight trains and express trains. This should generate more than 10 percent extra capacity in the system.
- Prepare a freight-working timetable: Until the 1980s, a ‘freight-working timetable’ was available in every division of the IR. It was later discarded, citing ambiguous reasons. The IR must reintroduce it, drawing up a timetable using the powerful computer programme introduced by Centre for Railway Information System (CRIS) for controlling of trains.
- Revamp the train-controlling mechanism: The next action should be revamping the computer programme that controls all trains on all divisions, based on the modified intersectional running time. This programme forecasts the precedence or crossings on the section to help the controller. If the inter-station running is not properly defined in consonance with the specifications of the locomotive, the forecasting will be inaccurate. Without proper forecasting, the full potential of the capital invested cannot be derived. This exercise will be complex and must be carried out under the supervision of a team of experts in operations.
- Internally audit asset usage: Once the inter-station running time is revised, a complete audit of the stated line capacities of various congested routes should be carried out. An investment of INR 529.46 billion (US$ 7.39 billion) on doubling and INR 46.83 billion (US$ 650 million) on automatic block signalling in the last five years should have given ample relief on congested routes. Yet, this has not materialised. Many allied assets such as additional loops, better and powerful locomotives, and improved technology of signalling should all have resulted in an enhanced capacity. A knowledgeable and erudite team of officials from various departments should be entrusted with investigating why such high levels of investments are leading only to fringe benefits and marginal returns. This team can then suggest whether the entire calculation of line capacity of various routes needs reworking and whether the current figures are being purposely misreported to set low targets of performance for the management.
- Train the operating staff to improve productivity: The IR staff manning the control boards and the loco pilots driving superior-technology locomotives (both diesel and electric) must be trained properly to get the best out of these assets. It has been drilled into the minds of loco pilots that they must always remain in control of the train even if they have to reduce speed. In some training colleges for electric locos, they are trained to maintain a “balancing speed” of 55 km/hr to conserve of energy. Such compromises negate all investments aimed at enhancing capacity. The administration must decide what is economically more prudent: enhancing the capacity to run more trains or achieving energy conservation.
- Focused investment in doubling and new-line projects: One of the reasons for poor returns from such high investments is that the allotment of funds for various doubling and new-line projects is done in a fragmented manner. There are many projects in the country for which only a certain part (or fragment) of a section gets completed in a year, but the benefits do not start flowing because the point of congestion only gets shifted, not eliminated. This situation must be resolved.
- Create more reliable infrastructural assets: The reliability of infrastructural assets continues to be poor. In 2016–17, there were 3,546 rail failures, 4,452 locomotive failures (both diesel and electric) and 130,197 signal failures[25] on the entire network. These failures eat into the existing capacity of the already-congested route. There is an urgent need to rein in the extent of asset failures on the IR.
If followed meticulously, these measures will restore asset productivity to its former levels, and even help increase it further. The IR can thus tackle its financial woes in the shortest possible time.
The Indian Railways today stands precariously on a threshold. On the one end is financial viability and on the other is financial ruin. It is the same situation it once faced in 1980, and a similar response from the management is imperative to strengthen the IR’s financial situation. Without corrective measures, this once-mighty institution may go down the way Air India did, which will be most unfortunate for this vast country that dearly depends on the railways.
Endnotes
[1] The amount of money spent by Indian Railways to earn INR 100. The lower the ratio, the better it is. This parameter is further defined in the paper under the ‘Financial Indicators’ section.
[2] Report No.1 of 2018, Finance Audit on Railways Finances in Indian Railways Union Government, Comptroller and Auditor General of India, Government of India, 2018.
[3] PTI, “Lalu to teach management at IIM Ahmedabad“, Daily News and Analysis, 30 August 2006.
[4] National Transport Development Policy Committee, “Volume III Sector Reports” in National Transport Development Policy Committee Report (India: Routledge, published on behalf of “The Planning Commission,” Government of India, 2014), 50–51.
[5] The current value of past investments made in the respective five-year plans have been obtained by adjusting for inflation. These calculations have been made with the help of the following website: http://calculatorstack.com/inflation-calculator-india.php.
The current values are as under:
| Five Year Plan |
Capital Investment
(INR crore)
|
Current Value (in 2017)
(INR crore)
|
| Up to V Plan (1950–78) |
4,723 |
87,781.83 |
| VI Plan (1980–85) |
6,585 |
65,448.92 |
| VII Plan (1985–90) |
16,549 |
109,314.34 |
| VIII Plan (1992–97) |
32,306 |
113,764.56 |
| XI Plan (1997–2002) |
45,725 |
120,068.68 |
| X Plan (2002–07) |
84,003 |
173,467.56 |
| XI Plan (2007–12) |
189,838 |
246,487.45 |
| XII Plan (2012–17) |
419,221 |
419,221 |
[6] Indian Railways Year Book 2016–17, Directorate of Statistics and Economics, Ministry of Railways, Railway Board, Government of India, 2018, 16; and Indian Railways Key Statistics (1950–51 to 2013–14), Directorate of Statistics and Economics, Ministry of Railways, Railway Board, Government of India, 2015, 35–36.
[7] “Annexure 1” in Indian Railway Budget Speech 2015–16, Ministry of Railways, Government of India, 2015, accessed 25 October 2018.
[8] BS Reporter, “LIC to invest Rs 1.5 lakh crore in Indian Railways over 5 years”, Business Standard, 12 March 2015.
[9] Indian Railways Year Book 2016–17, op. cit.; Indian Railways Year Book 2015–16, Directorate of Statistics and Economics, Ministry of Railways, Railway Board, Government of India, 2017; Indian Railways Year Book 2014–15, Directorate of Statistics and Economics, Ministry of Railways, Railway Board, Government of India, 2016; Indian Railways Year Book 2013–14, Directorate of Statistics and Economics, Ministry of Railways, Railway Board, Government of India, 2015; and Indian Railways Year Book 2012–13, Directorate of Statistics and Economics, Ministry of Railways, Railway Board, Government of India, 2014.
[10] Ibid.
[11] Ibid.
[12] As per the CAG report on Railway Finances, IR has appropriated INR 5,026 crore less for the pension fund for the year 2016–17.
[13] Indian Railways Year Book 2016–17, op. cit.; Indian Railways Year Book 2015–16, Directorate of Statistics and Economics, Ministry of Railways, Railway Board, Government of India, 2017; Indian Railways Year Book 2014–15, Directorate of Statistics and Economics, Ministry of Railways, Railway Board, Government of India, 2016; Indian Railways Year Book 2013–14, Directorate of Statistics and Economics, Ministry of Railways, Railway Board, Government of India, 2015; and Indian Railways Year Book 2012–13, Directorate of Statistics and Economics, Ministry of Railways, Railway Board, Government of India, 2014.
[14] Vipul Prasad, “Indian Railways: Can the elephant dance?” Livemint, 15 March 2018.
[15] Indian Railways Year Book 2016–17, op. cit.; Indian Railways Year Book 2015–16, Directorate of Statistics and Economics, Ministry of Railways, Railway Board, Government of India, 2017; Indian Railways Year Book 2014–15, Directorate of Statistics and Economics, Ministry of Railways, Railway Board, Government of India, 2016; Indian Railways Year Book 2013–14, Directorate of Statistics and Economics, Ministry of Railways, Railway Board, Government of India, 2015; and Indian Railways Year Book 2012–13, Directorate of Statistics and Economics, Ministry of Railways, Railway Board, Government of India, 2014.
[16] Ibid.
[17] Ibid.
[18] Indian Railways Key Statistics (1950–51 to 2013–14), op. cit.
[19] Ibid.
[20] Ibid.
[21] Report No.1 of 2018, Finance Audit on Railways Finances in Indian Railways Union Government, op. cit.
[22] Arun Kumar Das, “As Railways Hits Highest-Ever Operating Ratio, Rae Bareli Accident Underscores Gaps in Safety”, The Wire, 15 October 2018.
[23] Ajith Athrady, “Railways’ operating cost going super-fast”, Deccan Herald, 16 October 2018.
[24] IR has categorised its broad-gauge network in six categories, viz. A, B, C, D-Special, D and E, based on the traffic density on it. Route A has the heaviest density. However, all suburban routes are kept in category C, irrespective of traffic density. Route A comprises of the quadrilateral with nodes at Howrah, Delhi, Mumbai and Chennai, as well as its diagonals.
[25] Monthly Evaluation Report Upto March 2017, Directorate of Statistics and Economics, Ministry of Railways, Railway Board, Government of India, 2017, 28.
The views expressed above belong to the author(s). ORF research and analyses now available on Telegram! Click here to access our curated content — blogs, longforms and interviews.

 PDF Download