This paper attempts to make a contribution in the context of the recent push in making India an e-empowered economy for promoting exports. The study stems from the premise that exports respond significantly to the costs associated with breaking into foreign markets and sustaining in those markets, whereas e-commerce offers a ready platform to minimise such costs. The empirical exercise focuses on export decision and export intensity, after adjusting for self-selection in exporting, to establish their responsiveness to e-commerce treatment. The possibility to choose the treatment in a purely non-random manner prompts the use of an endogenous treatment-effects regression model. Using a sample of 2,191 manufacturing firms in the period 2010-16, the results show that, on average, firms adopting e-commerce are 21.8 percent more likely to be exporters, and their intensity of export is likely to increase by 7.9 percent.
Traders, policymakers and researchers are becoming increasingly aware that exports respond significantly to costs associated with breaking into foreign markets and sustaining, besides the macro and observed and unobserved firm and industry characteristics.[1]Such costs typically include establishing marketing channels, accumulating information on demand sources, packaging, and upgrading product quality. Several implications follow because of these costs. First, current-period export supply depends largely on the number and type of producers that were exporting in previous periods as costs accrued hinder the scope of flexibility. Second, transitory policy changes or macro shocks can lead to permanent changes in market structure as incurred costs make ex post reverting/realigning difficult. That is, costs produce “hysteresis” in trade flows. Third, when future market conditions are uncertain, incurred costs, by creating a barrier, govern the patterns of entry and exit to a considerable extent. Fourth, re-entry for exporters who have been out of the export market for a small period is easier than for a first-time exporter. Beyond a threshold period, however, the difficulty in re-entry is akin to those faced by a new exporter. This is mainly because the costs for exporters are contingent upon information acquisition that is likely to depreciate upon exit from the market. Thus, it becomes imperative that a reduction in costs make exporting more profitable for a substantial proportion of firms, incumbent or entrant.
E-commerce is commonly considered a ready platform to minimise costs of the nature discussed above. First, it lowers the cost of obtaining detailed content, on a one-to-one, one-to-many, or many-to-many basis. The scale of economies in providing content to consumers make it even more important, given the size of the potential market. Second, it allows for asynchronous communication, so that information access can take place at any time. It is especially valuable when widely differing time zones are involved, as in the global economy. Third, it allows considerable flexibility in dealing with information, with far greater interactivity and search capability than catalogues or menu-driven information. Easy and low-cost information gathering helps the seller build a robust model for market and product development. Fourth, the ability of consumers to direct queries to these electronic platforms makes it possible to rapidly search through millions of listings to find the items of interest. The main consequence of the increased reach is the improvement in the matching of buyers and sellers. Fifth, it enables large cost savings on distribution. Such savings include the reduction of handling within the store, theft, rent, and selling costs. Sixth, online stores benefit from economies of centralised inventories. A company can carry inventory at a much lower cost when it does so at a small number of distribution centres than on a store-by-store basis. Seventh, it has significant potential for customised manufacturing. The example of Dell Computer Corporation illustrates that e-commerce can yield significant cost savings and improvements in the match between buyer preferences and the goods they purchase.[2]Eighth, it helps in efficient customer–client relationship management with mass customisation, as all dealings with a particular account are integrated and marketing insights can be generated using these data, feedbacks, ratings and online surveys taken by the customers or clients.
The key impediments to adoption of e-commerce concern organisational issues, concordance with the incumbent systems, and transaction costs attributed to such systems. For example, a considerable restructuring in information exchange, motivations, and roles and duties is required for “collaborative replenishment schemes” to work where supplier takes the responsibility of endowing retailer’s stocks with requisite supply. Moreover, each firm must undertake to comply with specific information templates tailored for the industry if communication across firms is to flow smoothly. Such restructuring and compliance are often tedious and political. Moreover, the mechanisms for redressal of conflicts, if they arise, must be smooth and timely. Some merchandise sellers, for instance, are averse to sell their stocks online to avert the “free rider” problem between departmental retailers (where consumers can check the stocks in person) and internet retailers (whose overhead costs are lower).
With regards to competition, e-commerce platforms face two-sided challenges. The traditional offline “brick-and-mortar” firms carry enormous strategic advantages in the forms of established brand names, stable geographic networks, and attainment infrastructure which are decisive in getting a product from the warehouse to the customer. The incumbent peers, on the other hand, in the rush to secure e-commerce landscape and gain market position, incur costs with a focus on customer acquisition and building infrastructure to achieve an efficient scale. The costs in both the cases are often incurred by way of aggressive pricing mechanism and/or belligerent advertising and marketing expenses. This leads to a natural barrier for entry of firms that are less endowed.
Another challenging exercise is establishing the responsiveness of exports to e-commerce. First, exports will respond positively to e-commerce only if the cost advantages associated with e-commerce are perceived as over and above the cost of adoption and the competitive pressures. However, if the converse is perceived as binding, the effect of e-commerce on exports would be insignificant. So, ex ante, for a sample of firms, there is no obvious reason to expect any specific direction of responsiveness of exports to e-commerce; deep empirical investigation is the only way to solve the problem. Second, how much a firm would export depends on its self-selection to break into the foreign market. Accounting for self-selection is important because firms may select themselves into exporting in a purely non-random manner. For example, there may be several differences between firms that choose to export and those that choose not to, such as motivation, ability, or experience. Third, in both the steps—export decision and export intensity—the onus is on finding whether exports of firms treated with e-commerce are different from exports of firms that are not treated with e-commerce. In case the treatment is endogenous, as in this context, care must be taken to get consistent results on the responsiveness. Finally, several factors can potentially confound the relationship between exports and e-commerce. Such factors include policy regime, uncertainty, market structure, observable and unobservable firm and industry characteristics, and demand-side adjustments. These confounding factors must be suitably controlled.
The empirical exercise aims at accounting for the influence of self-selection on export decision by augmenting the specification for export intensity with the inverse Mills ratio. Subsequently, Heckman’s endogenous treatment-regression approach is used for estimating the responsiveness of exports to e-commerce.[3]The approach coherently incorporates the correlation between the error terms in both the steps to account for the endogeneity problem. To perform the estimation, the exercise uses data on the manufacturing firms in India in the period 2010–16. Based on a sample of 2,191 manufacturing firms, the following observations emerge. First, a dismal performance of exports is quite noticeable during the sample period in terms of lower growth rate. Second, the average treatment effect of e-commerce on both export decision and export intensity is positive and significant at 21.8 percent and 7.9 percent, respectively. Third, several variables such as size, maturity, group affiliation, exchange rate, and uncertainty turn out to be significant in explaining e-commerce adoption, export decision, and export intensity. However, almost all the characteristics prompting firms to break into the foreign markets are significantly different from the characteristics that prompt them to export intensely.
The results reveal several important aspects of exporting and e-commerce adoption in India. They highlight a significant scope for policymakers in promoting exports, mainly in the realms of external credit availability, and provisions of infrastructure and procedural ease. In addition, a need to promote firms with distinctive characteristics with schemes suitable to their need is also quite evident. Further promotion of e-commerce-based exports will require policies that induce more firms and consumers to adopt e-commerce and a revival of world demand for exports.
The rest of the paper is organised as follows: section II presents a review of literature; section III discusses the macro structure of the country in the context of the current exercise; section IV outlines dataset and the variables; and section V presents the estimation exercise. The paper concludes with section VI.
II. Literature Review
Potential of e-commerce and its adoption
Past studies have examined technologies in general and have found many factors impacting the adoption decision of information and communication technologies (ICTs) in organisations. Following Lefebvre and Lefebvre, these factors can be classified into two types: internal factors and external factors.[4]Factors internal to the firm include a firm’s characteristics such as size, maturity and type of business. Larger and mature organisations tend to have the resources and the competitive imperative to initiate deployment of new information technologies.[5]Moreover, the type of business and sectoral differences are noted to be important in the acquisition of telecom products and services.[6]External factors exist at three levels: industry, macroeconomic, and national-policy level. These external factors affect the general and competitive environment within which a particular firm has to operate. For example, firms located in high-bandwidth telecommunication regions obtain better technological services to support e-commerce applications. Such access is generally better in urban areas than in rural areas. Ghosh, and Dasgupta et al. provide examples of companies in the US that took to the internet mainly because an increasing number of firms from developing countries are adopting electronic technology as a means of communication and distribution.[7]Dholakia and Kshetri, however, provide alternate evidence to Ghosh by showing that an increasing number of firms from developing countries are adopting electronic technology as a means of communication and distribution under competitive pressure from suppliers and customers in developed countries.[8]Schware and Kimberley, in addition, point out that there are several cases of companies—particularly traditional, small, older firms—that have gone out of business because of their inability or unwillingness to demonstrate an electronic data interchange (EDI) capability.[9]
Costs associated with exporting
The earliest economic models that considered the export decisions of firms facing fixed costs of entering and continuing in foreign markets include Baldwin, Baldwin and Krugman, and Dixit.[10]These models suggest that firms face a large upfront sunk cost of entering a foreign market and a smaller, period-by-period cost of continuing in the foreign market. Melitz extends these works by providing a framework for firms’ export decisions in which heterogeneous firms face sunk costs of entry and uncertainty concerning their productivity.[11]Specifically, he shows that only the more productive firms enter the export market, and simultaneously, the least productive firms exit the export market. Recent empirical works have extended the original models of export decision to allow for heterogeneity in the abilities and opportunities of production units. Some of the empirical regularities noted across economies are as follows.[12]
First, export decisions are quite persistent. On average, each year, more than 80 percent of exporters continue exporting in the following year, and almost the same proportion of non-exporters do not export in the following year. Second, exporters tend to be bigger and more productive than non-exporters. On average, exporters are at least 10 percent more productive, employ at least 70 percent more workers, and use at least 10 percent more capital per worker. Third, export penetration costs account for 15–45 percent of the annual value of a firm’s exports. The continuation costs are considerably smaller, of the order of 1–5 percent of the annual value of exports.
A contagious issue in the current line of research pertains to approximating the sunk cost. Sunk costs have firm-specific, industry-specific as well as country-specific components.[13]Three approaches are generally suggested to account for the effect of sunk costs of exporting. First, firms that are already familiar with the foreign market will have better information access and continue to export for longer periods. Thus, previous export experience can serve as the proxy for reduction in sunk costs.[14]However, identifying export entry costs using this proxy requires separating persistence generated by sunk entry costs from any other sources of persistence in exporting status. For example, controlling for variables that measure managerial ability, product quality or foreign consumers’ affinity towards domestic brand is a prerequisite to correctly deduce the nature of sunk export entry costs.[15]Second, the framework developed by Arkolakis suggests that the majority of foreign-market entry cost is related to marketing and advertising.[16]However, applicability of this proxy needs decomposition of incidental marketing expense into domestic and external markets components as the produce may be sold in both the markets. Moreover, marketing and advertising are also a valuable tool for market discrimination. Third, there exists destination complementarity features to sunk costs that influence firms’ export status. For example, tariff rate, similar legal origin, and others, significantly affect the sunk costs of exporting to a destination.[17]
Exports and e-commerce
There are only a few studies linking e-commerce to exports, mainly because of the lack of requisite data. Yong et al., in a theoretical setup, invoke cost advantages associated with e-commerce to show that e-commerce affects international trade positively by increasing the quantity of product sold, reducing the price of the product, and increasing the profits of firm.[18]Yadav, in an empirical exercise on firms from developing countries of Asia and sub-Saharan Africa, looks at the impact of internet use on their export behaviour.[19]She finds that use of e-mail and private website has a positive impact on the extensive margin of enterprise export but not on the intensive margin. In addition, both these internet tools only affect export likelihood of manufacturing enterprises and not of service enterprises. Meijers corroborates the finding of Yadav by showing that internet use does not explain economic growth directly in a fully specified growth model.[20]Specifically, using a sample of 162 countries, he shows that internet use impacts trade, and trade impacts economic growth. In addition, he also shows that internet use impacts trade in low-income countries more than in high-income countries, whereas the impact of trade on economic growth is the same for both income groups. Najarzadeh et al., however, show that the internet, besides mitigating the costs of exporting, also increases labour productivity.[21]Specifically, using a sample of 108 countries, they show that increasing the number of internet users by 1 percent increases GDP per employed person by $8.16–$14.6.
Bianchi and Mathews, and Mathews et al. augment this line of research by investigating the link between internet marketing capabilities and international market growth.[22]For a sample of Chilean and Australian firms, they show that firms deploying internet marketing capabilities benefit due to the reduction of information uncertainty and increased capacity to develop international networks. Timmis investigates whether firms export directly or via intermediaries upon adopting internet technology.[23]He finds that internet access amplifies direct trade, and it is likely to diminish indirect trade. Interestingly, he also finds that in developing countries, firms with internet technology export more than those without it. Kurihara and Fukushima confirm and expand on this finding by showing that the effect of internet on international trade is larger in Asian countries, although it has positive effects for both developed and developing countries.[24]
III. Macro and Policy Structure
The mechanism for sustaining exports is a recurrent issue of debate, mainly because of the country- and time-specific nature of such a mechanism. A study with any pretention of a full disclosure of the role of exports will, therefore,undoubtedly have to caricaturise the underlying economy. To this end, this section presents the broad outline of exports and its underlying structure in India. It also glances through similar patterns in China, Brazil and the US as references.
Table 1: Export of Goods and Services: Growth, Time and Cost
2010
2011
2012
2013
2014
2015
Export of goods and services (% growth)
India
19.616
15.575
6.786
7.803
1.716
-5.363
China
19.302
10.431
3.334
3.857
5.408
-2.454
Brazil
11.723
4.788
0.272
2.394
-1.133
6.28
US
11.895
6.851
3.417
3.481
4.269
0.11
Time to export (days)
India
17.0
17.0
16.0
16.0
17.1
17.1
China
21.0
21.0
21.0
21.0
21.0
21.0
Brazil
12.0
13.0
13.0
13.0
13.4
13.4
US
6.0
6.0
6.0
6.0
6.0
6.0
Cost to export ($ per container)
India
895.0
1005.0
1045.0
1070.0
1332.0
1332.0
China
500.0
500.0
500.0
580.0
823.0
823.0
Brazil
1135.0
1650.0
2075.0
2075.0
2414.3
2322.8
US
1050.0
1050.0
1050.0
1090.0
1164.0
1224.0
Notes: Exports of goods and services represent the value of goods and market services provided to the rest of the world. They exclude compensation of employees, factor income and transfer payments. Time to export is the number of calendar days necessary to comply with all procedures required to export goods. The waiting time between procedures is included in the measure. Cost to export is for a homogeneous new product of weight 15 metric tonnes and value $50,000. Cost includes payments for a freight forwarder, customs broker, international shipping, domestic transport, clearance and inspections by customs and other government agencies, port or border handling, and document preparation.
Data source: World Bank.
In table 1, the first block presents the average annual growth in export of goods and services. It shows that the countries witnessed an export slowdown in the sample period. This slowdown is attributed to cyclical factors such as weakness in global demand and structural weakness of Indian exports. For example, Hoekman attributes the slowdown to lower trade income elasticity world over, whereas Hong et al. attribute it to the weak position of the Chinese markets that influence other countries on the globe.[25]Krishna and Kumar, in addition, argue that lack of necessary infrastructure and skills in the comparative-advantage (labour-intensive) sectors of the country, weak integration with global production networks, and rising real wages lead to the noted fall in Indian exports.[26]
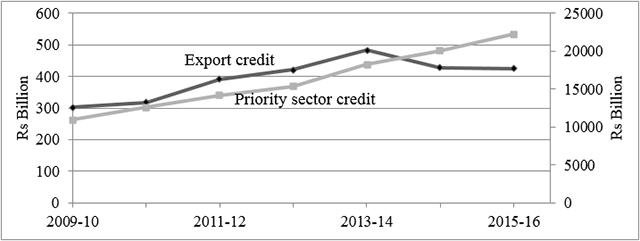
The second and the third blocks sum up the costs faced in exporting, in terms of “time to export” and “cost to export.” A trade-off between the two variables for the three developing countries under consideration, apart from the effect of export slowdown in the recent years, is quite evident. The case of US, however, suggests that with further development, a country may optimise on both the variables. Therefore, a significant scope for reduction in time and cost to export is quite plausible for India. A similar pattern emerges in formal credit support to exports as well (Figure 1). The Government of India has a priority sector lending programme, which is intended to benefit exports besides other sectors such as agricultural; weaker-section enterprises; micro-, small- and medium-scale enterprises; education; housing; social infrastructure; and renewable energy. Banks are advised to lend these sectors to the level of 40 percent out of their adjusted net bank credit. However, there is no sub-target for exports within the priority sector. The lack of specific sub-target and the slowdown, thus, resulted in low credit allocation to the exports following the year 2013–14.
Figure 1: Priority sector credit and export credit in India
Data source: Reserve Bank of India.
Notes: Export credit is on the primary Y-axis. Priority sector credit is on the secondary Y-axis.
Table 2: Internet Usage
2010
2011
2012
2013
2014
2015
Internet users (% of Population)
India
7.500
10.070
12.580
15.100
21.000
26.000
China
34.300
38.300
42.300
45.800
47.900
50.300
Brazil
40.650
45.690
48.560
51.040
54.551
59.079
US
71.690
69.729
74.700
71.400
73.000
74.452
Fixed broadband subscription (per 100 people)
India
0.912
1.093
1.212
1.192
1.243
1.321
China
9.291
11.435
12.721
13.634
14.384
19.767
Brazil
7.223
9.055
9.625
10.661
11.676
12.248
US
27.069
28.045
29.138
30.005
30.321
31.023
Cellular mobile subscription (per 100 people)
India
62.390
73.198
69.922
70.783
74.484
78.062
China
63.170
72.071
80.763
88.708
92.273
92.180
Brazil
100.88
119.000
125.000
135.310
138.950
126.590
US
91.312
94.440
96.010
97.078
110.200
117.590
Data source: World Bank.
Table 2 presents a glimpse of the internet usage. The first block suggests that the past few years have experienced unprecedented rise in internet usage. From 2010 to 2015, in most countries, the proportion of internet users out of their respective population has increased by 16 percent to 20 percent, where most of the increase has come from the cellular platform (third block) as it provides more spatial flexibility in usage. The table reveals that the proportion of internet users in India saw a surge from 2013 onwards. This is mainly because of the launch of the fourth-generation internet services on cellular platform in early 2013, a year after it was launched on dongles and modems.
IV. Dataset and Variables
The major data source for this empirical exercise is Capitaline. It is one of the largest data depository for the corporate sector in India, covering more than 30,000 firms across 3,000 variables and ratios.[27]The data on policy and macro variables is taken from the Reserve Bank of India (RBI) and the World Bank. The sample period for the study is 2010–16. The sample period is chosen in a way that it is not congruent with any major crisis, such as the sub-prime crisis of 2007–09, and it has representation for the latest year for which data is available. The firms chosen are mainly from the manufacturing sectors based on the National Industrial Classification (NIC) codes of 2008. NIC codes classify firms into industries based on their major activity, and such a classification is consistent across years in the sample period. To avoid the influence of outliers, the extreme 1 percent observations for each variable are winsorised. Meeting these conditions yields an unbalanced sample of 2,191 firms with 12,210 observations.
Three variables are of key interest in this context: e-commerce adoption, export decision and export intensity. Below are the definitions of these variables, followed by a discussion of their potential determinants.
E-commerce adoption:Ideally, firms that have adopted e-commerce can be identified as those having a registered e-mail and a website. However, in the dataset, these domain variables are noted as the background indicators, implying that same entry is recorded for all the years, irrespective of when the firms acquired them. This definition, by design, renders those variables insignificant that have only annual variation. Such variables are typically macro and policy variables. This problem is tackled by interacting the domain variables with a dummy for expenditure on computers. Specifically, e-commerce adoption is defined as a dummy, which takes the value one for a firm (having registered e-mail and a website) for all the years since it first made an expenditure on computers, and zero otherwise. To illustrate, if a firm having registered e-mail and a website in the sample period to makes expenditure on computers for the first time in year , the period to is recorded as one and to as zero.[28]
Export decision:It is defined as a dummy that takes the value one if a firm is exporting and zero otherwise.
Export intensity:It is defined as the ratio of value of exports (FOB) and total sales.
Variables affecting e-commerce adoption
Firm-level variables:
Size: Larger firms are better able to manage the fixed and variable costs associated with the use of the e-commerce, given their resources. Smaller firms, on the other hand, have greater growth potential to motivate them to invest in cutting-edge technology. Therefore, the ex-ante effect of size on e-commerce adoption is ambiguous. To measure size, natural logarithm of assets is used.[29]
Maturity: Older firms signal that they have survived all ups and downs in the market by aligning their strategies to the market. However, such firms may also thrive because of intrinsic value created through traditional modes of business, and may be reluctant to mend ways. Thus, ex ante, the effect of maturity on e-commerce adoption is ambiguous. To measure maturity, natural logarithm of the number of years since the incorporation firms is used.
Foreign ownership: Foreign owned firms are more likely to have better access to resources, information and technical expertise. Therefore, such firms are more likely to adopt e-commerce. The variable is defined as a dummy, which takes the value one if a firm has 10 percent or more foreign promoters share and zero otherwise.
Group affiliation: Firms affiliated to groups are expected to have better access to information and better network compared to standalone firms. However, some business groups mainly exist for the benefit of the typically small number of investors that control the group. This complicated ownership structures of business groups may lead to severe agency conflicts and obliterate the incentive to make investments in newer technology.[30]Thus, ex ante, the effect of group affiliation on e-commerce adoption is ambiguous. The variable is defined as a dummy, which takes the value one if a firm is affiliated to a group and zero otherwise.
Growth opportunities: Firms facing favourable growth opportunities indicate further scope of profitable ventures. Such firms are more likely to adopt e-commerce as it provides a potentially effective means of margin building. Two proxies for growth opportunities are commonly used in the literature: sales accelerator and Tobin’sq. Sales accelerator is defined as the growth in operating income (sales) in two consecutive years. Tobin’sqis defined as the ratio of the market value of a firm to the book value of its assets. Tobin’sqis a forward-looking measure, but its use restricts the sample to firms that are listed in stock exchanges. The accelerator, unlike Tobin’sq, is backward looking, but it is not susceptible to omission of firms that are not listed. Since there are many unlisted firms in the sample used, the exercise employs sales accelerator.
Productivity: Productive firms are those that have larger output-to-input ratio. Since e-commerce offers the possibility of cost reduction and economies of scale, productivity is expected to have a positive effect on e-commerce adoption. The ratio of total revenue to total expenditure is used as the proxy for productivity.[31]
Availability of external finance: Availability of external finance eases the adoption of e-commerce from the resource side. The exercise replaces availability of external finance with the ratio of net fixed assets to total assets (asset tangibility) as firms that have more tangible assets are likely to find it easier to pledge for external finance.
Marketing, distribution and advertising expenditure: For firms that incur high marketing, distribution and advertising expenditure, e-commerce offers a convenient way to economise on these heads. Thus, a positive relationship is likely between e-commerce adoption and marketing, distribution and advertising expenditures. These variables are normalised by sales.
Unobservable firm characteristics: To control for the firm-specific unobservable characteristics, the exercise includes firm dummies, which are time invariant.
Industry-level variables:
Market concentration: Firms in concentrated industries, relative to competitive industries, are less likely to engage in practices that are cost effective and that increase market share. Thus, market concentration is expected to affect e-commerce adoption negatively. The exercise uses the Herfindahl–Hirschman Index (HHI) as the measure of concentration in each industry.[32]HHI is defined as the sum of the squares of market shares of all the firms in an industry where “industry” is taken at five-digit NIC level.
Relative industry revenue growth: Firms with positive relative industry revenue growth are those that perform better than their peers in other industries. Such firms are more likely to invest in cost-reduction technologies. Therefore, there is likely to be a positive relationship between relative industry revenue growth and e-commerce adoption. Relative industry revenue growth is defined as the difference between the median sales growth of an industry at five-digit NIC level and the median sales growth across all industries in the corresponding two-digit NIC level.
Other variables:
Domestic internet penetration: Those firms that are uncertain about the mode of customers’/clients’ attention (online versus offline), may take domestic internet penetration as a proxy of their customer orientation. Thus, domestic internet penetration should affect e-commerce adoption positively. The variable is defined as the proportion of internet users to total population.
Cost of supporting hardware: If firms face a lower cost of supporting hardware, they are more likely to adopt e-commerce. Wholesale price index for IT hardware is used as the proxy for the variable.
Variables affecting export decision and export intensity
Most variables discussed below influence both export decision and export intensity, except for time and cost to export, which influence export decision only. These two variables, conditional on the decision, do not influence export intensity.
Firm-level variables:
Size: Larger firms are more likely to manage the costs associated with breaking into the external market, given their resources, and are thus more likely to export than smaller firms. However, conditional on breaking into external market, smaller firms are more likely to pursue an intense exporting strategy as they enter into such markets with much higher stake and potential for growth. Thus, size is likely to have positive effect on export decision and negative effect on export intensity.
Maturity: Older firms signal that they have survived all ups and downs in the market by adjusting to it, and they have accumulated significant amount of information about the product market and their competitors. Such firms are more likely to export. However, conditional on their decision to export, younger firms—like smaller firms—are more likely to pursue an intense exporting strategy as they enter into such markets with much higher stake and potential for growth.
Foreign ownership: Foreign-owned firms are likely to have better access to networks, resources, information and technical expertise. Therefore, such firms are more likely to export. For the same reason, their export intensity is also likely to be higher.
Group affiliation: Firms affiliated to groups are expected to have better access to information and better network compared to stand alone firms. Therefore, such firms are more likely to export. For the same reason, their export intensity is also likely to be higher. However, stand-alone firms, to establish networks, may export more intensely upon breaking into the external market. Additionally, the complicated ownership structures of business groups may also obliterate the incentive to export intensely. Thus, ex ante, the effect of group affiliation on export intensity is ambiguous.
Growth opportunities: Firms facing favourable growth opportunities indicate further scope of profitable ventures. Such firms are more likely to export as exporting provides a potentially effective means of tapping margins from multiple markets. For the same reason, their export intensity is also likely to be higher.
Productivity: Productive firms are typically noted to export since such firms are more likely to thrive amidst tough competition. Thus, productivity is likely to have a positive effect on export decision and its intensity.
Availability of external finance: Availability of external finance helps in meeting the costs related to exports from the resource side. Thus, firms that that can readily avail external finance are more likely to export. For the same reason, their export intensity is also likely to be higher.
Unobservable firm characteristics: To control for the firm-specific unobservable characteristics, firm dummies are included, which are time invariant.
Industry-level variables:
Market concentration: Firms in concentrated industries, relative to competitive industries, typically enjoy sizable market power and higher margins on their product. Such firms are less likely to be motivated to expand into other markets. Thus, it is expected that market concentration affects export decision and its intensity negatively.
Relative industry revenue growth: Firms with positive relative industry revenue growth are those that perform better than their peers in other industries. Such firms are more likely to engage in external markets. Thus, there is expected to be a positive relationship between relative industry revenue growth and exports. For the same reason, their export intensity is also likely to be higher.
Other variables:
Exchange rate: A fall in the relative domestic prices due to exchange rate depreciation makes exports cheaper in international markets, resulting in increased demand for exports. Therefore, it is likely that exchange-rate depreciation affects export decision and its intensity positively. A similar argument can be made for exchange-rate appreciation. As the measure of exchange rate, the exercise uses the annual mean of real effective exchange rate (REER) between INR and USD.
Uncertainty: Firms facing uncertainty have two opposite motives for engagement. An engagement, before uncertainty unfolds, may lead to acquisition of a strategic growth option in terms of stronger ex post market share. However, the uncertainty might also lead to a dismissal of the undertaken engagement as mere sunk costs without any potential advantage in near future. These two motives make the association of uncertainty with export decision and its intensity ambiguous ex ante. Following Campa, and Padmaja and Sasidharan, the paper uses daily data on REER to construct the measure of uncertainty.[33]The process is as follows. First, construct the return series as the change in the log of the base REER series from the previous date. Second, check for stationarity and structural break in the return data, which is found to be stationary and without any structural break. Third, choose lag length based on various information criteria (Akaike, Bayesian and Schwarz criteria) and check for the best fit among the various models in the ARIMA-ARCH family. Exponential generalised ARCH (1, 1) or EGARCH (1, 1) is found to be a better fit than the competing models.[34]Finally, compute the annual uncertainty score by taking the mean of the predicted conditional variance over each year and dividing it by the square root of the number of observations in the respective year. The division is performed to annualise the series.
Low export credit dummy: The Government of India, as discussed in section 3, has a priority sector lending programme, which is intended to benefit exports, in addition to other sectors. But there is no sub-target for export credit within the priority sector. The lack of specific sub-target and slowdown of exports resulted in low credit allocation to the exports following the year 2013. The effect of this low export credit regime is captured by using a dummy, which the takes the value one for year 2013 onwards and zero otherwise. This is likely to influence export decision and its intensity negatively.
Cost to export: The cost to export acts as a detriment on expected profits from exports. It is computed assuming a homogeneous new product of weight 15 metric tonnes and value $50,000. It is expected to have negative impact on the decision to export.
Time to export:Time to export is the number of calendar days necessary to comply with all procedures required to export goods. It is expected to influence export decision negatively.
Descriptive Statistics
Table 3 presents the descriptive statistics for the variables discussed above. It suggests that the sample firms, on average, are bigger, mature, productive, creditworthy, and competitive; they face positive growth opportunities and industry demand. Such firms export to the extent of nearly 15 percent of their sales. Looking at the composition of the sample firms, nearly two-thirds of the firms are exporters and almost one-third of the firms are affiliated to a group. The proportion of foreign firms is lower at around 12 percent. About 47.3 percent of firms reported e-commerce adoption, which is one of the main variables in the current context. Overall, the sample firms come from a heterogeneous distribution of all the variables.
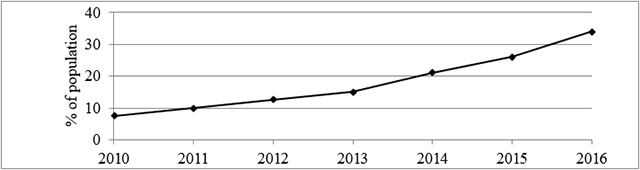
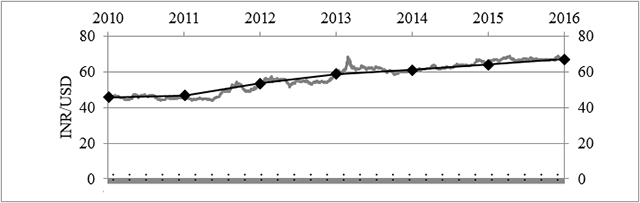
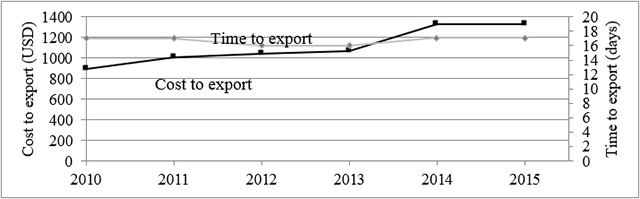
Figures 2 to 6 present the plot of variables with annual variation. Several points are noteworthy. First, 4G internet services were launched in India in mid-2012 and were priced at the same level as 3G internet services. With better data quality post this launch, more individuals adopted the internet. There is, therefore, an observable kink in the domestic internet penetration in the year 2013 in figure 2. The years following 2013 saw internet penetration at a greater pace than the years before. Second, with the launch of 4G services, sellers of the 3G devices accumulated sizable inventory as the demand then shifted to 4G devices. This led to a downward pressure on the prices of the 3G devices and subsequently in the fall of WPI of IT hardware as can be seen in figure 3. Third, a consistent depreciation of INR versus USD, as seen in figure 4, can be attributed to several factors such as stable trade pattern of the US compared to India; India’s widening current account deficit; India’s political turbulence; and growth slowdown. Fourth, the economic uncertainty, constructed using REER series in figure 5, increased in two periods: 2010–11 and 2013–14. While the earlier phase can be accredited to the overshoot of the sub-prime crisis, the later phase can be attributed to two factors. There was an indication that the US may withdraw or ease the fiscal stimulus package, which could potentially put the brakes on funds for developing economies. Moreover, there was a decision by the RBI and the Government of India to impose temporary restrictions on capital flows. Such a development did not go well with the markets, as it not only discouraged Indian companies from investing abroad, but also foreign firms from pumping money into India. Finally, the cost and time to export increases at a greater pace starting 2013 than in the years before. This increase occurred despite the focus of the national policy to promote exports, and therefore, it can be attributed to the slowdown of trade.
Table 3: Descriptive Statistics of Variables with Cross-Sectional Variation
Quantitative variables
Mean
Median
SD
Export intensity
0.153
0.028
0.237
Size
4.481
4.565
2.046
Maturity
3.371
3.332
0.529
Growth opportunity
0.109
0.083
0.411
Productivity
1.084
1.126
0.298
Availability of external finance
0.540
0.552
0.196
Marketing expenditure
0.001
0.000
0.009
Distribution expenditure
0.021
0.012
0.046
Advertising expenditure
0.007
0.000
0.048
Market concentration
0.290
0.214
0.234
Relative industry revenue growth
0.039
0.023
0.317
Qualitative variables
Percentage: yes
Percentage: no
E-commerce adoption
47.30
52.70
Exporter decision
64.22
35.78
Foreign ownership
11.93
88.07
Group affiliation
35.73
64.27
Figure 2: Domestic Internet Penetration
Data source: World Bank.
Figure 3: Cost of supporting hardware
Data source: RBI.
Figure 4: Real Effective Exchange Rate
Data source: RBI.
Figure 5: Uncertainty
Data source: RBI.
Figure 6: Cost and time to export
Data source: World Bank.
V. Estimation
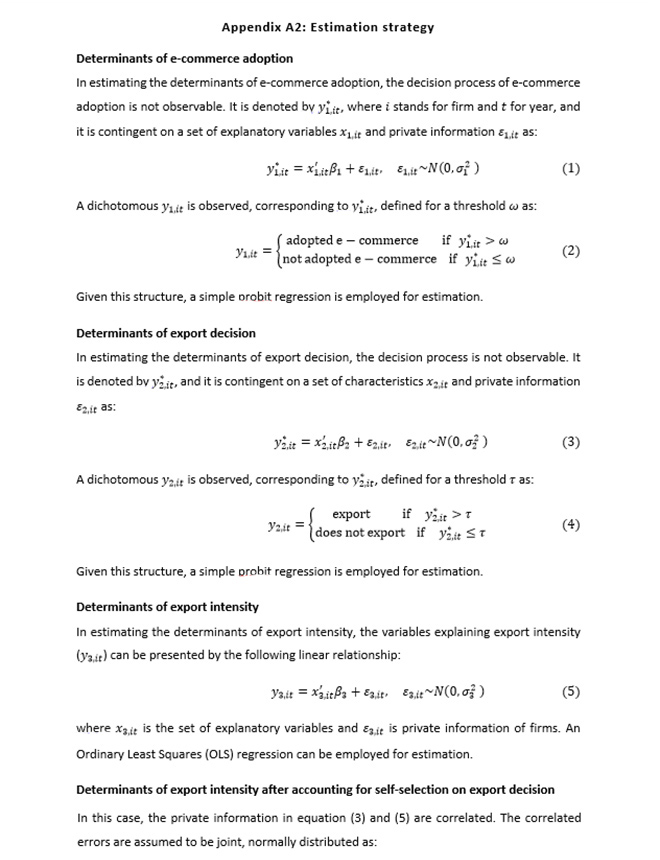
This section attempts to empirically ascertain the responsiveness of exports to e-commerce after controlling for all other plausible factors as discussed in section 4. The approach involves first estimating the determinants of export decision by incorporating e-commerce adoption as a treatment. Subsequently, it estimates the determinants of export intensity conditional on the decision to export and e-commerce adoption. The full empirical model is outlined in Appendix A2.
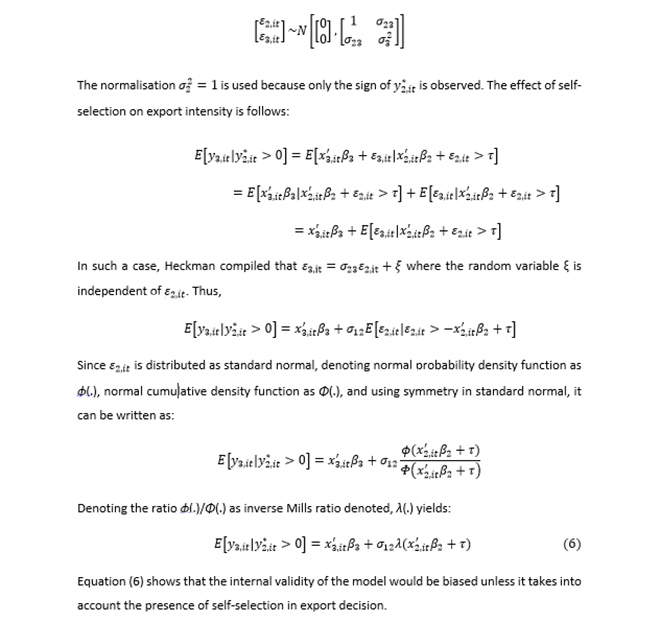
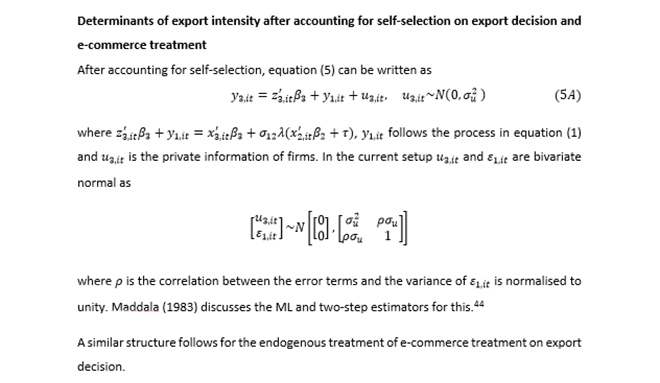
The first exercise follows from a potential non-zero correlation between the unobservables that affect e-commerce adoption and the unobservables that affect export decision. Examples of such unobservables may be motivation or ability. In such a case, e-commerce treatment is endogenous to the export decision. Specifically, the endogenous treatment-regression model, proposed by Heckman, is composed of an equation for the outcome (i.e. export decision) and an equation for the endogenous treatment (i.e. e-commerce adoption).[35]Maddala discuss a Maximum Likelihood (ML) estimator for the endogenous treatment-regression model.[36]The second exercise investigates the determinants of export intensity conditional on the decision to export and e-commerce adoption. Since firms choose whether to export or not, the decision to export implies self-selection by firms. Such self-selection may accrue in a purely non-random manner, making the determination of causation difficult. For example, there may be many differences between firms that choose to export and those that choose not to export, such as motivation, ability and experience. Following Heckman, self-selection can be accounted for by augmenting the export intensity equation with inverse Mills ratio computed from the first exercise.[37]The e-commerce treatment is also allowed to endogenously influence export intensity, over and above its influence on export decision. This is because, as discussed in sections 1 and 2, e-commerce not only eases the fixed cost of entry into the exporting market but also economises on the subsequent marginal costs.
An additional challenge is in identifying the equations on export intensity, export decision and e-commerce adoption. To tackle this challenge, there is ensured at least one variable in the equations on export decision and e-commerce adoption that, besides being distinct in these equations, is excluded from the export intensity equation.[38]This consideration results in the exclusion of two variables, “cost to export” and “time to export,” from the export intensity equation that are present in the export decision equation. Similarly, two variables—domestic internet penetration and cost of supporting hardware—are included in the e-commerce adoption equation but excluded from export intensity equation.
Finally, there is a possibility that firms may export in one year and may not export in another year within the sample period. This implies that the unit of analysis is firm-year, and the structure of the data is cross-sectional. This setup poses two key challenges. First, fixed firm effects will remain. Second, the estimate of lagged exports will be biased due to its correlation with the fixed effects if it is an important variable in explaining current exports. Mean-differencing the variables can remove fixed effects. However, the dynamic panel bias (due to correlation of lagged dependent variable with fixed effects) still remains. Following Nickell, this bias is negative if the coefficient of lagged dependent variable is positive.[39]Thus, a positive coefficient associated with lagged investment implies that the results are valid with even greater force. These aspects are kept in hindsight while discussing the results.
Determinants of Export decision with endogenous e-commerce treatment
Table 4 presents the endogenous treatment-regression model where the outcome equation pertains to export decision and the treatment equation pertains to e-commerce adoption. The Wald test, at the bottom of the table, indicates that the two equations are not independent. The estimated correlation between the treatment-assignment errors and the outcome errors, rho, is 0.508. The positive correlation indicates that unobservables that lead to e-commerce adoption tend to occur with unobservables that increase the propensity to export.
In explaining export decision, several variables turn out to be significant. The estimated average treatment effect (ATE) of e-commerce adoption on export decision, which is the main variable of interest, is 0.218. This number is significant, implying that those firms that adopt e-commerce are 21.8 percent more likely to export than those that do not. Among the firm-level variables, the coefficient of lagged exporting status, with a positive sign, suggests that firms that have already been exporting have amassed a pool of knowledge regarding the destination market and preferences of the customers, and have already incurred the sunk costs for exporting. Given such endowments, such firms are more likely to export. The coefficients associated with size and maturity are positive, implying that such firms—due to their resources and accumulated information regarding the product market and their competitors—are more likely to break into the foreign market. The coefficients of foreign ownership and group affiliation are positive. It suggests that foreign firms and firms belonging to a group are more likely to export as they have well-established networks and a pool of information to channel such a decision. The positive coefficients associated with growth opportunities and productivity suggest that firms that have scope of profitable ventures by way of increasing sales and the ability to build margins by cost-effective means are more likely to export.
Among the industry-level, macro-level and other significant variables, the coefficients associated with market concentration and relative industry revenue growth are negative and positive respectively. They suggest that firms in competitive industries and firms with better performance than their peers in other industries are more likely to export as it offers them a hedge against future downside risk, as well as a potential increase margin on the other. The coefficient of exchange rate is negative, suggesting that exchange-rate depreciation makes exports cheaper in international markets and, thus, prompts firms to export. Uncertainty assumes a negative sign, implying that firms perceive the fear of a sunk cost over and above the growth option when uncertainty unfolds. Thus, uncertainty depresses export decision. The coefficients associated with time to export and cost to export are negative. They imply that time lag and cost incurred act as deterrents in firms’ export decision.
In explaining e-commerce adoption, several variables turn out to be significant.[40]Among the firm-level variables, the coefficients associated with size and maturity are negative. They imply that smaller and younger firms, motivated by their growth potential, are more likely to adopt e-commerce as they foresee e-commerce as an effective means to thrive in the market against the incumbents’ traditional modes of business. The coefficient of foreign ownership is positive. It suggests that foreign firms—owing to better access to resources, information and technical expertise—are more likely to adopt e-commerce. The coefficient of group affiliation turns out to be negative, implying complicated structure of business groups, and severe agency conflicts obliterate the incentive to make investments in newer technology such as e-commerce. The coefficient associated with the availability of external finance is positive. It implies that e-commerce adoption is progressively contingent on the ease of availing external resources, especially as smaller, younger and standalone firms, which are relatively constrained by internal resources, are seen to adopt e-commerce more. The positive coefficient of marketing expenditure suggests that firms find e-commerce an effective means to economise on the expenditure head.
Table 4: Determinants of Export Decision with Endogenous E-Commerce Treatment
Outcome equation: Export decision
Treatment equation: E-commerce adoption
L. Export status
0.847***
Size
–0.073***
(132.420)
(9.280)
Size
0.018***
Maturity
–0.303***
(10.470)
(11.850)
Maturity
0.033***
Foreign ownership
0.075*
(5.570)
(1.990)
Foreign ownership
0.026***
Group affiliation
–0.387***
(4.080)
(13.010)
Group affiliation
0.028***
Growth opportunity
0.002
(3.580)
(0.990)
Growth opportunity
0.035***
Productivity
0.023
(4.840)
(0.470)
Productivity
0.023*
Availability of external finance
0.342***
(2.070)
(4.710)
Availability of external finance
0.018
Marketing expenditure
3.938**
(1.200)
(2.830)
Marketing expenditure
–0.116
Distribution expenditure
–0.244
(0.330)
(0.640)
Distribution expenditure
–0.098
Advertising expenditure
–0.622
(0.900)
(1.000)
Advertising expenditure
0.122
Market concentration
–0.143**
(1.030)
(2.640)
Market concentration
–0.037***
Relative industry revenue growth
0.033**
(3.450)
(3.110)
Relative industry revenue growth
0.004*
Domestic internet penetration
0.009***
(2.360)
(6.370)
Exchange rate (REER)
–0.007***
Cost of supporting hardware
–0.012***
(3.780)
(9.190)
Uncertainty
–0.264**
(3.020)
Low export credit dummy
0.004
(0.420)
Time to export
–0.018*
(2.500)
Cost to export
–0.306**
(2.930)
E-commerce adoption
0.218***
(7.460)
Correlation of disturbances in two equations (rho)
0.508
Wald test of independent equations (rho = 0): Prob. > Chi2
0.000
Model: Prob. > Chi2
0.000
Notes: *, ** and *** represent level of significance at 5 percent, 1 percent and 0.1 percent respectively. Robustz-statistics are in parentheses.
Among the industry-level and other significant variables, the coefficients associated with market concentration and relative industry revenue growth are negative and positive respectively. They suggest that firms in competitive industries and firms with better performance than their peers in other industries are more likely to adopt e-commerce as it offers cost effective means to increase market share. The coefficient of domestic internet penetration turns out to be positive, suggesting that firms match their customer orientation by adopting e-commerce. Finally, the negative coefficient associated with cost of supporting hardware suggests that firms adopt e-commerce when it is cheaper to do so.
Determinants of export intensity with self-selection on export decision and endogenous e-commerce treatment
Table 5 presents the endogenous treatment-regression model, where the outcome equation pertains to export intensity and the treatment equation pertains to e-commerce adoption. The likelihood ratio (LR) test (at the bottom of the table) is significant, indicating that the two equations are not independent. The estimated correlation between the treatment-assignment errors and the outcome errors, rho, is 0.544. The positive correlation indicates that unobservables that lead to e-commerce adoption tend to occur with unobservables that increase the intensity of export. The outcome equation accounts for the self-selection on export decision by including inverse Mills ratio from the previous result in table 4. It turns out to be positive and significant, suggesting that adjustment for self-selection is important for internal validity of the model.
In explaining export intensity, several variables turn out to be significant. The estimated ATE of e-commerce adoption on export intensity, which is the main variable of interest, is 0.079. This number is significant, implying that those firms that adopt e-commerce are 7.9 percent more likely to export intensely than those who do not. Among the firm-level variables, the coefficient of lagged export intensity assumes a positive sign. It suggests that firms that have already been exporting intensely have amassed a pool of knowledge regarding the destination market and the preferences of the customers. Such firms are more likely to export intensely. The coefficients associated with size and maturity are negative. They imply that, upon entry into the foreign market, smaller and younger firms export more vigorously to meet their growth potential. The coefficient of group affiliation turns out to be negative. It suggests that firms belonging to a group are less likely to export intensely, because their complicated structure and severe agency conflicts diminish the incentive to do so. The coefficient associated with availability of external finance is positive. It implies that export intensity is progressively contingent on the ease of availing external resources, especially as smaller, younger and standalone firms, which are relatively constrained by internal resources, export intensely. The positive coefficient associated with advertising expenditure suggests that advertising is an effective way for firms in the foreign market to reach their customers.
Among the industry-level, macro-level and other significant variables, the coefficients associated with exchange rate is negative, suggesting that exchange-rate depreciation makes exports cheaper in international markets and, thus, prompts firms to export more briskly. Uncertainty assumes a positive sign, implying that, upon breaking into the foreign market, firms perceive the growth option over and above the fear of a sunk cost when uncertainty unfolds. Thus, uncertainty promotes export intensity.
In explaining e-commerce adoption, all the significant variables are consistent with the ones noted in the table 4. Therefore, a similar explanation follows.
Table 5: Determinants of Export Intensity with Endogenous E-Commerce Treatment and Self-Selection Correction
Outcome equation: Export intensity
Treatment equation: E-commerce adoption
L. Export intensity
0.926***
Size
–0.072***
(244.484)
(9.687)
Size
–0.002**
Maturity
–0.297***
(2.935)
(12.017)
Maturity
–0.009***
Foreign ownership
0.063
(4.649)
(1.653)
Foreign ownership
0.001
Group affiliation
–0.386***
(0.288)
(13.219)
Group affiliation
–0.016***
Growth opportunity
0.001
(6.903)
(0.240)
Growth opportunity
0.001
Productivity
0.019
(0.476)
(0.497)
Productivity
0.003
Availability of external finance
0.359***
(0.942)
(5.126)
Availability of external finance
0.024***
Marketing expenditure
3.376*
(4.574)
(2.207)
Marketing expenditure
–0.150
Distribution expenditure
–0.095
(1.523)
(0.382)
Distribution expenditure
–0.006
Advertising expenditure
–0.920
(0.311)
(1.557)
Advertising expenditure
0.155***
Market concentration
–0.157**
(3.559)
(2.944)
Market concentration
–0.003
Relative industry revenue growth
0.038*
(0.777)
(2.390)
Relative industry revenue growth
0.001
Domestic internet penetration
0.009***
(0.331)
(6.250)
Exchange rate (REER)
–0.001**
Cost of supporting hardware
–0.012***
(2.598)
(9.526)
Uncertainty
0.007**
(2.768)
Low export credit dummy
–0.002
(0.521)
Inverse Mills ratio
0.454*
(2.351)
E-commerce adoption
0.079***
(17.754)
Correlation of disturbances in two equations (rho)
0.544
LR test of independent equations (rho = 0): Prob. > Chi2
0.000
Model: Prob. > Chi2
0.000
Notes: *, ** and *** represent level of significance at 5 percent, 1 percent and 0.1 percent respectively. Robustz-statistics are in parentheses.
Discussion
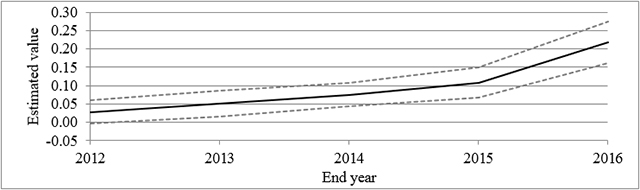
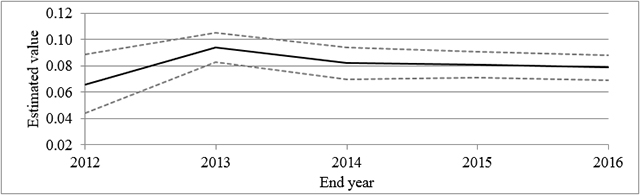
The results present several important aspects of exports by manufacturing firms in India. The issues of e-commerce treatment, which is central to the current exercise, suggests that e-commerce helps firms not only in breaking into the foreign markets but also in increasing the intensity of exports. To ascertain that this result is robust, the exercise is repeated for several sub-samples. Specifically, the main regressions are performed for firms in the period 2010–12, subsequently adding one year at each step. The evolution of ATEs in figures 7 and 8 reaffirm the main result. Mapping these ATEs with the recent episodes of exports in the country, two key points can emerge. First, the slowdown since 2013 seems to have mainly impacted the intensity of exports and not the export decision per se. Second, a lower base of e-commerce adoption itself may be a key reason for its limited ability to influence exports in the initial years. Only after the global demand for exports revive, and a larger number of producers and consumers start using the internet, can a clear picture of the “natural” responsiveness of exports to e-commerce be established. Another important aspect of the results pertains to self-selection in export decision, which is accounted for by introducing point estimates of inverse Mills ratio. The repeated exercise, which employed several sub-samples, also lends credence to the stability of the main results in this context by incorporating inverse Mills ratio specific to each sub-sample.
Figure 7: ATE on Export Decision with Confidence Interval
Fig 8: ATE on export intensity with confidence interval
The ATE of e-commerce adoption on export intensity remains lower than the ATE on export decision for the complete sample and all the sub-samples in figures 7 and 8. A similar observation is made by Choi et al., and Richards and Willows, who find that after gaining internet access, traders trade more frequently than the group of firms without internet access.[41]However, online traders tend to have smaller portfolios than other traders. Barber and Odean, and Daniel and Hirshleifer, in a similar context, note that those investors who switch to online trading perform more actively, more speculatively, but less profitably than before.[42]
The results reveal that the sign of all the significant variables is consistent with the discussion in section 4. The variables that were ambiguous ex ante—size, maturity, group affiliation and uncertainty—present a very interesting pattern in the results in tables 4 and 5. If export decision is categorised as ‘planning’ variable, and export intensity or/and e-commerce adoption as ‘activity’ variables, the following observations can be made. Size, maturity, and group affiliation have positive signs, and uncertainty has negative sign for the ‘planning’ variable. The sign of these variables reverses for the ‘activity’ variables. It implies that the factors that drive a firm in ‘planning’ are internal or arm-length resources and information, networks, and minimising sunk costs. In contrast, the factors that guide a firm for an ‘activity’ are growth potential, lower ownership and informational complications, and growth option that may augment the existing endowments significantly. Similar patterns are commonly noted in the Behavioural Economics literature.[43]
In addition to e-commerce, lagged exporting and marketing and advertising expenditure are also commonly associated with the costs of exporting. They reveal an interesting pattern in the results. Lagged exporting, whether as presence or as intensity, turns out to be most significant in explaining current exporting. However, only the advertising expenditure turns out to be significant, and only in the export-decision equation. The overall results with these variables suggest that firms that are already familiar with the foreign market have better information access and continue to export intensely and for longer periods.
VI. Conclusion
The paper investigates the responsiveness of exports to e-commerce. The investigation is developed on the premise that exports respond significantly to the costs associated with breaking into the foreign markets and sustaining in those markets, whereas e-commerce offers a ready platform to minimise such costs. E-commerce, however, confronts problems relating to adoption and competition. Adoption problems arise because of organisational issues, compatibility with legacy systems and non-technological transactions costs. The problem of competition, in contrast, arises from the strategic assets of the traditional offline “brick-and-mortar” firms, which includes brand names, established networks and fulfilment infrastructure; and aggressive pricing and/or belligerent advertising and marketing of the incumbent peers, which tends to create a natural barrier for entry. Only if firms perceive the cost advantages associated with e-commerce as over and above the cost of adoption and the competitive pressures will exports respond positively to e-commerce.
The empirical setup focuses on export decision as well as export intensity to establish their responsiveness to e-commerce. Since firms first self-select into exporting, and only then in the second step decide how much to export, adequate care is taken to account for the self-selection. Finally, in both the cases—export decision and export intensity—the attempt is on finding whether exports of firms treated with e-commerce are different from exports of firms that are not treated with e-commerce. The possibility that the treatment may be chosen in a purely non-random manner, making determination of causation difficult, prompts the use of endogenous treatment effects regression model for the estimation exercise.
With a set of controls and using a sample of 2,191 firms in the period 2010-16, the results lead to the following conclusions. First, a dismal performance of exports is quite noticeable in terms of lower growth rates. The main reason for this dismal performance is a global slowdown. However, there exists significant scope for export policymakers in the realms of external credit availability, and provisions of infrastructure and procedural ease. Second, the average treatment effect of e-commerce on export decision and export intensity is positive and significant at 21.8 percent and 7.9 percent respectively. It is, however, plausible that the full potential of the impact of e-commerce on exports is unrealised due to lower adoption base and global slowdown. Third, the global slowdown in exports seems to be parallel to the e-commerce treatment on intensity of exports and not the treatment on export decision as the former stagnated in the slowdown period after a period of growth in the preceding years, whereas the latter increased over time. Fourth, an interesting contrast is evident between the process of export decision on the one hand, and export intensity and e-commerce adoption on the other. Firms that are large and mature, affiliated to a group, and face lower uncertainty are more likely to break into foreign markets, whereas these characteristics reveal a contrary pattern for firms that are likely to adopt e-commerce and export intensely. It implies that the factors that drive a firm in export decision are internal or arm-length resources and information, networks, and apprehension of ex post sunk costs. In contrast, the factors that guide a firm for an e-commerce adoption and intense exporting are growth potential, lesser ownership, informational complications, and growth option, which may augment the existing endowments ex post. Finally, inclusive of the four characteristics noted in the previous point, almost all the characteristics prompting firms to break into the foreign markets are significantly different from the characteristics that prompt them to export intensely. Therefore, it is much warranted to promote firms with distinctive characteristics differently, with schemes suitable to their need.
Endnotes
[1]R. Baldwin, “Sunk-Cost Hysteresis,” NBER Working Paper No. 2911; R. Baldwin and P. Krugman, “Persistent Trade Effects of Large Exchange Rate Changes,”Quarterly Journal of Economics104, no. 4 (1989): 821–54; A. Dixit, “Hysteresis import penetration exchange rate pass-through,”Quarterly Journal of Economics104, no. 2 (1989): 205–28.
[2]Before Dell, the business model in the computer market was to forecast demand and produce in batches and then use inventory and price changes to buffer mismatch between supply and demand. J. Schmid and D. Vogl, “Dell Computer Corporation – Best practice for Relationship Marketing?” University of Abertay Dundee, 2003.
[3]J. Heckman, “Dummy Endogenous Variables in a Simultaneous Equation System,”Econometrica46, no. 4 (1978): 931–59.
[4]E. Lefebvre and L. Lefebvre, “Factors Affecting Adoption,” inInformation and Tele- communication Technologies: The Impact of Their Adoption on Small and Medium-sized Enterprises, IDRC, 1996,http://www.idrc.ca/books/focus/.
[5]E. Clemons and F. McFarlan, “Telecom: Hook Up or Lose Out,”Harvard Business Review64 (1984): 91–7; R. Kean, L. Gaskill, L. Leistritz and C. Jasper, “Effects of Community Characteristics, Business Environment and Competitive Strategies on Rural Retail Business Performance,”Journal of Small Business Management36, no. 2 (1998): 45–57.
[6]R. Dholakia, N. Dholakia and A. Bitta, “Acquisition of Telecommunications Products and Services: An Examination of Inter-Sector Differences,”IEEE Transactions on Engineering Management38, no. 4 (1991): 328–35.
[7]S. Ghosh, “Making the Business Sense of the Internet,”Harvard Business Review76, no. 2 (1998): 126–35; S. Dasgupta, D. Agrawal, A. Ioannidis and S. Gopalkrishnan, “Determinants of Information Technology Adoption: An Extension of Existing Models to Firms in a Developing Country,”Journal of Global Information Management7, no. 3 (1999): 30–40.
[8]R. Dholakia and N. Kshetri, “Factors Impacting the Adoption of the Internet among SMEs,”Small Business Economics23, no. 4 (2004): 311–22; ibid.
[9]R. Schware and P. Kimberley, “Information Technology and National Trade Facilitation,” World Bank Technical Paper No. 317, 1995.
[11]M. Melitz, “The Impact of Trade on Intra-Industry Reallocations and Aggregate Industry Productivity,”Econometrica71, no. 6 (2003): 1695–725.
[12]M. Roberts and J. Tybout, “The Decision to Export in Colombia: An Empirical Model of Entry with Sunk Costs”American Economic Review87, no. 4(1997): 545–64.(for Columbia); B. Aw, S. Chung and M. Roberts, “Productivity and the Decision to Export: Micro Evidence from Taiwan and South Korea,”World Bank Economic Review14, no. (2000): 65–90 (for Taiwan and South Korea); S. Clerides, S. Lach and J. Tybout, “Is Learning by Exporting Important? Micro-dynamic Evidence from Colombia, Mexico, and Morocco,”Quarterly Journal of Economics113, no. 3 (1998): 903–47 (for Colombia, Mexico, and Morocco); A. Bernard and J. Wagner, “Export Entry and Exit by German Firms,”Review of World Economics137, no.1 (2001): 105–23 (for Germany); A. Bernard and J. Jensen, “Exceptional Exporter Performance: Cause, Effect, or Both?”Journal of International of Economics47, no. 1 (1999): 1–25 (for the USA); G. Alessandria and H. Choi, “Do Sunk Costs of Exporting Matter for Net Export Dynamics?”Quarterly Journal of Economics122, no. 1 (2007): 289–336 (for the USA); J. Campa, “Exchange rates and trade: How important is Hysteresis in Trade?”European Economic Review48, no. 3 (2004): 527–48 (for Spain); M. Padmaja and S. Sasidharan, “Sunk Costs, Firm Heterogeneity, Export Market Entry and Exit: Evidence from India,”Journal of Quantitative Economics15, no. 2 (2017): 367–93.(for India); X. Bai, K. Krishna and H. Ma, “How You Export Matters: Export Mode, Learning and Productivity in China,”Journal of International Economics104 (2017): 122–37 (for China).
[13]V. Ghosal, “The Effects of Uncertainty and Sunk Costs on Firms’ Decision-Making: Evidence from Net Entry, Industry Structure and Investment Dynamics,” inThe Economics of Imperfect Markets, eds. G. Calcagnini and E. Saltari (London: Physica-Verlag, 2010), 167–82; A. McCallum, “The Structure of Export Entry Costs,” Paper in ASSA Annual Meetings, Econometric Society, 2015,http://www.heinz.cmu.edu/AppliedMicro/McCallum.pdf.
[14]Roberts and Tybout; E. Sinani and B. Hobdari, “Export market participation with sunk costs and firm heterogeneity,”Applied Economics42, no. 25 (2010): 3195–207; Padmaja and Sasidharan.
[16]C. Arkolakis, “Market Penetration Costs and the New Consumers Margin in International Trade,”Journal of Political Economy118, no. 6 (2010): 1151–99.
[18]H. Yong, L. Jun-yang, W. Xue-pin and J. Jiao-jiao, “Impact of e-Commerce on International Trade-Based on an Iceberg Cost Model,”International Journal of Trade, Economics and Finance2, no. 3 (2011): 175–78.
[19]N. Yadav, “The Role of Internet Use on International Trade: Evidence from Asian and Sub-Saharan African Enterprises,”Global Economy Journal14, no. 2(2014): 189–214.
[20]H. Meijers, “Does the internet generate economic growth, international trade, or both?”International Economics and Economic Policy11, no. 1 (2014): 137–63; ibid.
[21]R. Najarzadeh, F. Rahimzadeh and Michael Reed, “Does the Internet Increase Labor Productivity? Evidence from a Cross-Country Dynamic Panel,”Journal of Policy Modeling, 36, no. 6 (2014): 986–93.
[22]C. Bianchi and S. Mathews, “Internet marketing and export market growth in Chile,”Journal of Business Research69, no. 2 (2015): 426–34; S. Mathews, C. Bianchi, K. Perks, M. Healy and R. Wickramasekera, “Internet Marketing Capabilities and International Market Growth,”International Business Review25, no. 4 (2016): 820–30.
[24]Y. Kurihara and A. Fukushima, “Impact of the Prevailing Internet on International Trade in Asia,”Journal of Sustainable Development Studies3, no. 1 (2013): 1–13.
[25]B. Hoekman,The Global Trade Slowdown: A New Normal? (London: CEPR Press, 2015); G. Hong, J. Lee, W. Liao and D. Seneviratne, “China and Asia in Global Trade Slowdown,” IMF Working Paper WP/16/105, 2016,https://www.imf.org/external/pubs/ft/wp/2016/wp16105.pdf.
[26]G. Krishna and R. Kumar, “Indian Exports: Loss of Global Competitiveness,”Economic and Political Weekly50, no. 34 (2015): 20–3.
[27]Prowess offers an alternative source of data that can be used for the current exercise. However, the coverage of Capitaline, in terms of number of firms, is much broader than Prowess.
[28]There is a possibility that firms may not incur expenditure on computers every year. To ensure that the definition of e-commerce adoption is not erroneous because of this issue, we also check the pattern of expenditure on computers for a period of three years before the start of the sample period.
[29]Ideally, employment is a better proxy for size as it is a real variable. But, in our dataset, the information on employment is missing for many firms.
[30]M. Bertrand, P. Mehta and S. Mullainathan, “Ferreting out Tunneling: An Application to Indian Business Groups,”Quarterly Journal of Economics117, no. 1 (2000): 121–48.
[31]The ratio of total revenue to total expenditure is a crude proxy for productivity. More nuanced proxy would require data on employment, which is missing for many firms in the dataset.
[32]HHI provides an indication of the level of concentration, with the maximum value corresponding to the case of the monopoly, and the minimum corresponding to perfect competition.
[34]The EGARCH model is particularly useful in capturing asymmetric responses to positive and negative movements in a series, and it is demonstrated to have better fit compared to other asymmetric conditional variance models in many studies. See C. Alexander,Practical Financial Econometrics(John Wiley and Sons, 2009).
[36]G. Maddala,Limited-Dependent and Qualitative Variables in Econometrics(Cambridge: Cambridge University Press, 1983).
[37]Inverse Mills ratio, defined as the ratio of the probability density function to the cumulative distribution function of a distribution, is a statistical construct that is used in accounting for selection problems. J. Heckman, “Sample Selection Bias as a Specification Error,”Econometrica47, no. 1 (1979): 153–61.
[39]S. Nickell, “Biases in Dynamic Models with Fixed Effects,”Econometrica49, no. 6 (1981): 1417–26.
[40]We have excluded the lagged e-commerce adoption as one of the explanatory variables because with its inclusion, the model tends to become deterministic.
[41]J. Choi, D. Laibson and A. Metrick, “How does the Internet Increase Trading? Evidence from Investor Behavior in 401(k) Plans,”Journal of Financial Economics64 (2002): 397–421; D. Richard and G. Willows, “Who trades profusely? The characteristics of individual investors who trade frequently,”Global Finance Journal, 2017.
[42]B. Barber and T. Odean, “Online Investors: Do the Slow Die First?”Review of Financial Studies15, no. 2 (2002): 455–88; K. Daniel and D. Hirshleifer, “Overconfident Investors, Predictable Returns, and Excessive Trading,”Journal of Economic Perspectives29, no. 4 (2015): 61–88.
[43]D. Kahneman and A. Tversky,Choices, Values and Frames(Cambridge University Press, 2000).
The views expressed above belong to the author(s). ORF research and analyses now available on Telegram! Click here to access our curated content — blogs, longforms and interviews.

 PDF Download