-
CENTRES
Progammes & Centres
Location
 PDF Download
Sakthivel Selvaraj, “Ensuring Access to Medicines in East Africa: Lessons from India”, ORF Occasional Paper No. 201, July 2019, Observer Research Foundation.
INTRODUCTION
With an estimated population of 1.2 billion, Africa accounts for approximately 16 percent of the global population[1] but almost 24 percent of the global disease burden. Seventy percent of all HIV patients and 90 percent of malaria fatalities are recorded in African countries.[2] The lack of access to essential life-saving medicines is thus a major challenge in the continent. Africa faces various barriers in ensuring equitable access to drugs, including inadequate public expenditure, insufficient financial-risk protection, ineffective public procurement systems, exorbitant drug prices, and low availability of essential medicines at public health facilities. These countries rely primarily on imported pharmaceutical products to meet local needs, due to the lack of a robust domestic pharmaceutical industry. According to the World Health Organization (WHO), more than 90 percent of the 54 national medicines regulatory authorities (MRAs) across Africa have minimal or no capacity[3] to regulate various aspects of medicine manufacture and delivery.
This paper studies the pharmaceutical sector in five East African countries: Ethiopia, Kenya, Tanzania, Rwanda and Mozambique, discussing domestic pharmaceutical production, drug-procurement processes, medication availability and prices, and pharmaceutical regulations. The final section of the paper examines the successes of India’s pharmaceutical industry in specific states and concludes with an exploration of what the East African countries can learn from the Indian experience.
I. PHARMACEUTICAL MARKET AND PRODUCTION
East African countries have a limited capacity for manufacturing pharmaceutical products. Thus, they rely mostly on imports—of finished products, raw ingredients and active pharmaceutical ingredients (APIs)—to meet the rapidly growing local demands. Much of the East African market is dominated by generics and medicines imported from India. Given the rapid growth in the market, there is immense scope for existing local manufacturers, with government support, to enhance their capacities and for new manufacturers to emerge. However, the sustainability of large-scale local production is predicated upon its efficacy and the extent of government subsidies provided. With populations ranging between 11 million and 100 million in the five countries discussed in this paper, domestic production can thrive if handled correctly.
The Ethiopian healthcare market has an annual growth rate of 25 percent, valued at US$400–500 million per annum. The country has approximately 200 importers and 22 local industries of pharmaceutical products and medical consumables. Of the 22, nine are involved directly in the manufacture of products, only two of which are Good Manufacturing Practices (GMP) certified. Local manufacturers supply only about 20 percent of the local demand and 90 of the 380 drugs on the national essential medicine list (EML).[4] Moreover, no local company manufactures APIs in the country.[5][6]
Despite government support, the Ethiopian industries face several challenges, such as limited access to foreign currency, difficulties in procuring raw materials, and constraints in human-resource capacity.[7],[8] A 2013 survey by Ewen M. et al. indicated that 55.4 percent of the products across all sectors were manufactured in Ethiopia and the remaining imported from India (17.6 percent), Cyprus (seven percent), Germany (5.1 percent), France (2.1 percent) and South Korea (1.9 percent). The availability of branded generics, INN generics and originator brands in Ethiopia was 74.6 percent, 20.7 percent and 4.7 percent, respectively.[9]
In 2014, Kenya was the largest and fastest-growing pharmaceutical market (US$740 million) in East Africa, with an estimated compound annual growth rate (CAGR) of 15 percent from 2007.[10] The market share of locally produced pharmaceutical products by value increased from 28 percent in 2010[11] to 30 percent in 2014. Around 70 percent of the pharmaceutical products were imported from other countries, particularly India and China, which together accounted for 50 percent of the total imports. The market was dominated by generics (62 percent), and almost 50 percent of the market by value was made up by anti-infective immunological and cardiovascular agents.[12] The pharmaceutical market in Kenya is significantly concentrated: about 80 percent of the total production comes from the 10 biggest manufacturers.[13]
According to the Kenya National Bureau of Statistics, the imports of pharmaceutical products rose to US$604.50 million in 2016 from US$396.50 million in 2011, mainly on account of generic drugs and raw materials. While the country’s domestic manufacturers depend on imports for APIs,[14] amongst East African countries, Kenya leads in the export of pharmaceutical products. In 2015, nearly 50 percent of its pharmaceutical exports went to Uganda and Tanzania.[15],[16] The export value increased from US$74.46 million in 2011 to US$131.90 million in 2016.[17] The total value of pharmaceutical exports in 2015 was US$71,200,000 (1.20 percent of the total exports), while the total value of pharmaceutical imports was US$572,533,000.[18] Further, data from the Kenya Pharmacy and Poisons Board (KPPB) show that pharmaceutical sales in the country increased from US$826 million in 2016 to US$919 million in 2017.
Despite the increase in export and local sales, the overall contribution of Kenya’s pharmaceutical industry to the GDP remains negligible (1.22 percent in 2017).[19] Pharmaceutical companies have now started joint ventures or buyouts with leading Indian (Strides, Cipla) and South African (Aspen Pharma) companies, and are using their own funds (e.g. CDC Capital’s investment in Abacus Parenteral Drug Ltd.) to expand operations and improve manufacturing standards. However, companies are yet to invest in research and development, which is crucial for the development of the sector.[20]
Tanzania has a robust pharmacy system: 88.9 percent of its health facilities have a functional pharmacy department, and 92.9 percent of the essential medicines are generally available.[21] Branded drugs constitute 46 percent and generics, 54 percent of the market in the country. Eight of all Tanzanian pharma companies are registered manufacturers, and their local production meets 31 percent of the national demand. The remaining 69 percent is imported, mainly from India. Raw ingredients, too, are mostly imported from other countries.[22] In 2013, local production decreased to 15 percent of the pharmaceutical market share (US$48.7 million), from 35 percent in 2009 (from US$49.2 million). Pharma exports declined as well, from US$7.9 million to US$1.7 million. Consequently, the import value of pharmaceutical products increased from US$99.4 million in 2009 to US$286 million in 2013.[23]
Rwanda’s pharmaceutical market was estimated to be worth US$75 million in 2014, with a CAGR of 12.85 percent from 2007 to 2014.[24] The country has only one domestic pharmaceutical factory, which manufactures a few essential medicines.[25],[26],[27] The total local production comprises three percent of the overall market, of which 56 percent are generic drugs and 44 percent are branded. More than 95 percent of the drugs are imported to meet local demands, along with most of the manufacturing ingredients. In 2015, the total import value of pharmaceuticals was US$83.1 million.[28] Of Rwanda’s total exports, pharmaceutical products make up only 0.04 percent, at US$242,000.[29]
Mozambique has a single pharmaceutical producer, which started its operations in 2013, with support from the Brazilian government.[30] Public expenditure on pharmaceuticals increased from US$78 million to US$122 million between 2004 and 2012.[31] In 2012, Mozambique’s pharmaceutical imports were valued at approximately US$140 million, a per-capita drug expenditure of US$5.55. The share of public-sector imports is 85 percent (US$122 million) of the total market value, mainly supported by external funds and donations and managed by the Ministry of Health (MoH). Mozambique has 54 formally registered private importers, but more than 50 percent of the imported drugs in 2012 came from the four biggest importers. Private operators import 2,572 registered pharmaceutical products in Mozambique from India (55 percent), Portugal (12 percent) and Brazil and Germany (combined, five percent).[32]
II. PUBLIC-SECTOR PROCUREMENT OF DRUGS
A reliable procurement system ensures access to medicines in sufficient quantities at the lowest possible rates, so as to secure maximum value for the most number of beneficiaries possible. This requires an Essential Medicines List (EML), quantity and quality assessment, regular procurement of medicines, supply-chain management and timely payment to suppliers. An inefficient system can lead to exorbitant prices and medicine shortages at the point of delivery.
The Ethiopian government procures almost 70 percent of the country’s pharmacological requirement through the Pharmaceutical Fund and Supply Agency (PFSA), via centralised international tenders. Procurement through the PFSA increased from US$27 million in 2007 to US$310 million in 2014. The government offers a 25-percent price preference to local manufacturers and makes an advance payment of 30 percent. Additionally, tax-free loans are provided for new investment and upgrading local production, 70 percent and 60 percent, respectively.[33],[34] Procurement prices for locally produced products are higher than imported products, at 1.20 times and 0.84 times the international reference prices (IRPs), respectively.[35],[36] Locally produced products are also priced 45 percent higher than imported products.[37]
Centralised and decentralised procurement of pharmaceutical products happens through tender bids (not publicly available). The Kenya Medical Supplies Agency (KEMSA), a semi-autonomous primary public procurement agency, is responsible for centralised procurement.[38],[39] The KEMSA receives funding from the Government of Kenya and other development partners, to procure medical supplies for rural health facilities.[40] Around 70 percent of Kenya’s pharmaceutical products are imported from other countries, with India and China together accounting for 50 percent of the total imports.[41] The Kenyan government gives 15-percent price preference for all medicines produced in Kenya and 10 percent for all imported medicines traded by companies with at least 51 percent Kenyan ownership.[42] Under special circumstances, Kenyan law has provisions for the importation of unlicensed drugs.[43]
All public facilities in Tanzania use either an allocated financial budget or an established budget ceiling for the procurement of medicines and medical supplies. The budget allocated for pharmaceuticals in the public sector was increased from US$14.1 million to US$28.5 million from 2000 to 2007, and the spending on essential drugs was increased by almost 50 percent from 2002 to 2005.[44] However, this was not enough to meet the national need for medicines.[45] In 2005, approximately 75 percent of the total spending on drugs was borne by the Ministry of Health and Social Welfare (MoH&SW) of Tanzania, and the remaining 25 percent by donors. Government allocation included donations and funding from other agencies, e.g. the Global TB Fund and Global Alliance for Vaccines and Immunisation. The MoH&SW obtains funding from donors through the Ministry of Finance (MoF), and the MoF allocates a quarterly share of resources to the MoH&SW, which then distributes resources for drugs to the Medical Stores Department (MSD). The MSD must follow the Public Procurement Act no. 21, 2004, in the process of procurement. [46]
For essential drugs, internal resources are the main sources of funding. In 2005–06, funds were reported to be underutilised due to delays in the allocation of money, stock-out of drugs at the MSD, and the inflexibility of the system to adapt to such delays.[47] The procurement of essential medicines is the responsibility of the MSD tender board at the central stores; the managers at the zonal level; and individuals such as supplies officers, nursing officers and pharmacists. Over 80 percent of the essential medicines and supplies are procured through international competitive bidding, 10 percent through selective bidding and five percent through national competitive bidding. Once procured, the essential drugs are stored at the MSD and then distributed to primary health facilities and hospitals via zonal stores.[48] Public wholesalers give a 15-percent price preference to the local manufacturers.[49] A 2017 survey by Ewen M. et al. indicated that the Tanzanian government pays 0.69 and 1.34 times the IRPs for local and imported products, respectively.[50]
In addition to the drugs on the EML, the MSD also procures medicines requested by health institutions. Similarly, only about 52 percent of health facilities procure medicines within the EML. Three main reasons for non-compliance were recorded: a) the prescribers did not agree with the Standard Treatment Guidelines (STG); b) local needs were not addressed; and c) suppliers did not have stocks for the EML products.[51]
In Rwanda, the Medical Production and Procurement Division (MPPD), referral hospitals (BUFMAR) and private pharmacy wholesalers are responsible for procuring pharma products. Public procurement of health commodities is done through international competitive biddings.[52] To import drugs, the WHO prequalification and the approval of the Stringent Regulatory Authority is required.[53] There is a provision in the law to import unlicensed medicines in special circumstances.[54]
Mozambique’s pharmaceutical market is dominated by the public sector and a highly concentrated group of private wholesalers and importers. In the public sector, drugs are procured—local and imported—and distributed through the MoH’s Central Drugs and Medical Supplies Agency (CMAM). The CMAM uses an open-tender procedure for the procurement of pharmaceuticals. Occasionally, it buys drugs from private importers/wholesalers.[55] APIs are exempt from import duties to promote local production in Mozambique.[56] The Mozambique government gives a 15-percent price preference to the local producers, over the cheapest competing international bid. In case of emergencies and drug stock-outs, procurement is done through local producers to shorten the regular drug-acquisition cycle.[57]
III AVAILABILITY OF ESSENTIAL MEDICINES
The success of a government procurement system can be measured by, amongst others, the availability of medicines at the point of delivery. Where patients rely on the private sector, drug availability in private pharmacies is crucial as well.
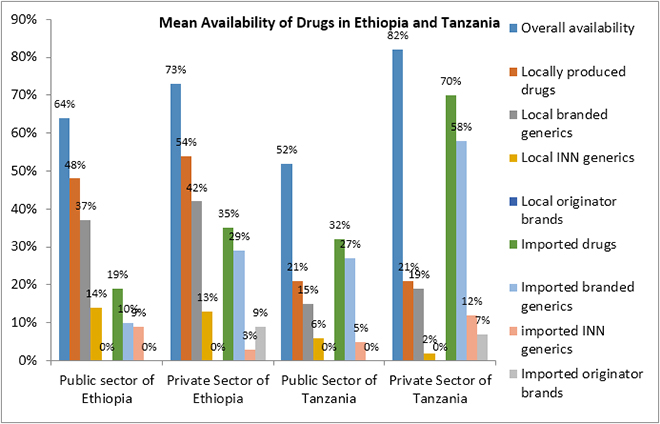
A 2013 survey conducted in Ethiopia found that the mean availability of medicines in the public sector was 64 percent,[58] with locally produced drugs being more available than imported ones, at 48 and 19 percent, respectively. The mean availability of branded generics was 37 percent (local) and 10 percent (imported) and that of INN generics was 14 percent (local) and nine percent (imported). No originator brand was found in the public sector.[59],[60]
In the private sector, the mean availability of imported and local pharma products, together, was 73 percent. Local products had greater availability than imported products, at 54 percent and 35 percent, respectively. Branded generics (local, 42 percent; imported, 29 percent) were more easily available than INN generics (local, 13 percent; imported, three percent). The availability of imported originator brands was nine percent, and no local originator brand was found in the private sector.[61],[62]
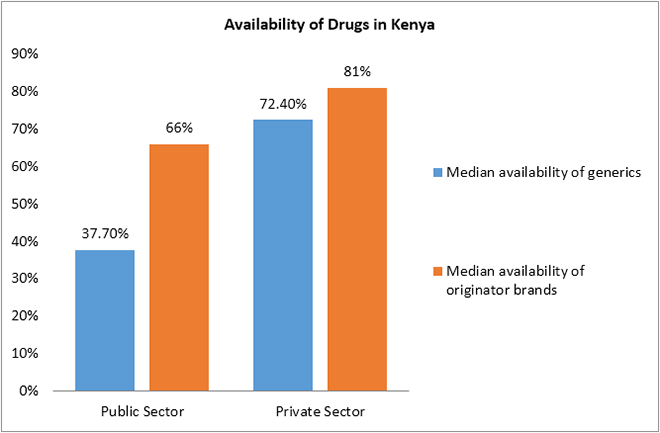
The WHO/HAI pricing survey conducted in Kenya in 2004 reported that the mean availability of generics (37.7 percent) was lower in the public sector than in the private sector (72.4 percent), and the mean availability of originator medicines, too, was lower in the public sector (66 percent) than in the private sector (81 percent).[63]
The availability of essential drugs across Tanzania’s MSDs varied significantly in 2005–06. The central MSD had 97 percent availability of drugs, while at some zonal stores, it was 51 percent. The availability of essential drugs at district hospitals was very low and varied between 51.3 percent and 59.5 percent. The average availability of drugs was lower at primary health facilities than in hospitals, at 52.8 percent and 74.6 percent, respectively.[64]
In 2008, the MoH&SW conducted a survey in public healthcare facilities to assess the medicines supply management system. The overall availability of stock at the facility level was 65 percent and ranged from 52 to 96 percent per category of product.[65] In 2007–13, the median availability of selected generics in the public and private healthcare sectors was 37.8 percent and 50 percent, respectively.[66] Ewen M. et al. reported that in the public sector, the availability of imported products was greater, at 32 percent, than that of local products, at 21 percent. The mean availability of both was 52 percent. Branded generics (local, 15 percent; imported, 27 percent) had higher availability than INN generics (local, six percent; imported, five percent). The availability of imported originator brands was only four percent in the public sector.
In the private sector, the mean availability of medicines (local and imported) was 82 percent, with the availability of local products at 21 percent and imported at 70 percent. Branded generics (local, 19 percent; imported, 58 percent) had greater availability than INN generics (imported, two percent; local 12 percent). The availability of imported originator brands was seven percent.[67]
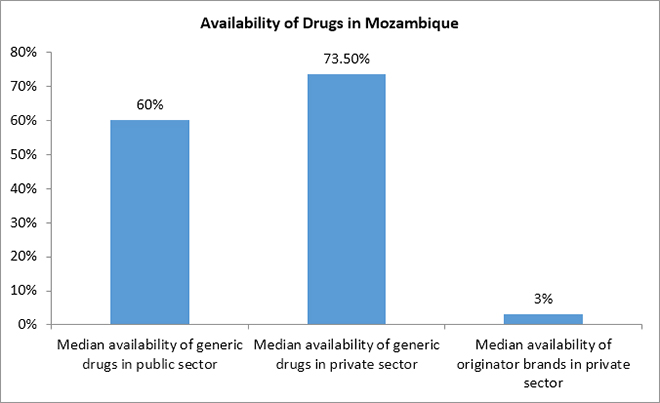
Russo G. et al. (2010) reported that in Mozambique, the median availability of generic drugs was 60 percent in the public sector and 73.5 percent in the private sector. Originator brands were available only at three percent of private pharmacies.[68]
IV PRICING AND PRICE REGULATION
Affordable pricing is crucial for ensuring equitable access to pharmaceuticals. In East Africa, prices for domestic products are generally higher than for imported products across sectors, and higher for most drugs in the private than in the public sector. The lack of price regulation makes medicines unaffordable in these countries, often resulting in patients forgoing treatment.
In the public sector, local branded generics are priced 23 percent higher than imported branded generics, while in the private sector imported branded generics are priced 153 percent higher.[69] The median price ratio (MPR) of branded generics was 1.41 for local products and 1.14 for imported products. For INN generics, too, the MPR for local products are slightly higher than for imported products.[70],[71] Neither drug prices nor supply-chain mark-ups are regulated in Ethiopia. The government does not levy value-added tax (VAT) or goods and services tax/general sales tax on medicine, but an import duty of five percent is applicable to all imported products and APIs.[72],[73] The Ethiopian government applies a 53-percent mark-up on imported products, but only a 17-percent mark-up on local products, thereby supporting the local manufacturers.[74],[75]
In the private sector, the MPR is lower for local products than for imported products, at MPR 1.8 and 5.44, respectively. Consumers have to pay 193 percent more for imported products. Imported branded generics (MPR 4.33) were 153 percent more expensive than local products (MPR 1.71). For INN generics, the MPR of local products was slightly higher than for imported products, at MPR 2.17 and 2.08, respectively. Originator brands were available at higher prices than the generics.[76],[77]
For branded generics in all sectors of healthcare, consumers pay approximately 13 percent less for local products (MPR 1.44) than for imports from India (MPR 1.64), 60 percent less than for those from Cyprus, and over 90 percent less than those from Germany. INN generics imported from India (MPR 1.57) are only slightly more expensive than those produced in Ethiopia (MPR 1.45).[78]
The WHO/HAI pricing survey (2004) showed that the public procurement prices of generics (MPR 0.65) were below the International Reference Prices (IRPs) in Kenya, while prices paid by consumers were greater than the IRPs. In the government facilities, patients paid 1.99 times the IRPs for generics and 3.6 times the IRPs for originator medicines. In the private sector, consumers paid 3.33 and 18.1 times higher prices for generics and originator drugs, respectively.[79]
Public-sector patients in Tanzania frequently need to pay OOP to buy drugs and supplies. About 44.4 percent patients pay for drugs either directly through OOP spending (64.2 percent) or indirectly through the payment of user charges or prepayment for health insurance plans, such as the NHIF (16.5 percent), the CHF (11 percent) or other schemes (8.3 percent).[80] According to Ewen M. et al., 2017 consumers pay seven percent more for local products (MPR 1.44) than for imported products (MPR 1.35). Additionally, consumers pay 135 percent and 65 percent more than the government procurement prices for local and imported products, respectively.
In the private sector, consumers pay similar prices for local and imported products, 2.27 and 2.29 times the IRPs, respectively.[81]
The prices of health commodities in Rwanda are steep and unaffordable to the majority of the population as the country has no pharmaceutical pricing policy in either the public or the private sector.[82]
Russo G. et al. conducted a study to investigate medicine prices in urban Mozambique and the forces influencing them. They collected data on the wholesale and retail prices for 25 originators/innovators and generic drugs from 10 public and 34 private pharmacies. Sixteen drugs were selected out of the 25 on the HAI/WHO list and adapted to the country’s context, and the remaining nine drugs were those prescribed most frequently in Mozambique.[83]
The study demonstrated that retail prices for generic medicines in Mozambique’s government urban outlets are lower than the MSH reference prices,[84] while in the private sector, prices are four to five times that of the MSH reference prices. Originator brands available only in the private sector are 23 times the MSH reference prices. The study noted intercity price variations for both generics and originator brands. In the private sector, branded versions of the same drug are four to five times more expensive than the generic version. However, even the lowest priced generics are, on average, 10 times more expensive in the private sector than in the public sector. Treatments for acute conditions are more affordable than treatments for chronic conditions such as diabetes, hypertension and psychiatric illnesses in both sectors.[85]
V. PHARMACEUTICAL REGULATION
Pharmaceutical regulation at different stages of production, importation, distribution and dispensing is essential to ensure the availability of quality drugs.
Ethiopia has a comprehensive law for the regulation of drugs, to safeguard public health from unsafe and substandard medicines. Based on Proclamation 661, 2009, the medical legislation of Ethiopia aims to ensure that all drugs (local or imported) available in the market are safe, effective and consistently meet the acceptable quality standards. The governing body of medicine regulation in Ethiopia—the Food, Medicine and Healthcare Administration and Control Authority—applies numerous controls at all levels of pharmaceutical activities to regulate the manufacturing, distribution, marketing, prescription, labelling and dispensing of pharmaceutical products.[86]
Kenya’s national medicine policy document is the Kenya National Pharmaceutical Policy (KNPP), last updated in 2010. The KNPP addresses important issues related to the selection of essential medicines, medicine financing, pricing, procurement, distribution and regulations, as well as the rational use of medicines, pharmacovigilance and research.[87],[88],[89] The MRA, monitored by the Pharmacy and Poison Board under the MoH, is involved in the African Medicines Regulatory Harmonisation and the Harmonisation of Medicines Registration in the East African Community. All pharmaceutical products (domestic or imported) must be registered with the MRA before being sold in Kenya. Pharmaceutical manufacturers are required to be registered under the MRA and comply with GMP, while wholesalers and distributors must comply with Good Distributing Practices. The country has a WHO-prequalified medicines quality-control laboratory (QCL) for the testing of medicines.[90],[91],[92]
For imported products, Kenya has legal provisions for their testing and inspection at the authorised port of entry[93] as well as for the promotion and/or advertisement of medicines.[94] Custom duty and VAT are not levied on the import of pharmaceutical products or ingredients,[95],[96] only on some packaging materials[97] and locally procured products.[98] The country has national STGs for most common illnesses and a national EML comprising 359 drugs.[99] The copy of EML and STG are available in 42 percent and 39 percent of public health facilities, respectively.[100]
In 2001, Kenya modified the Intellectual Property (IP) Act, its national patent law, to comply with the Trade-Related Aspects of Intellectual Property Rights (TRIPS) Agreement.[101] The country allows patent protection for products and processes for a 20-year period. The law incorporates all flexibilities and safeguards in line with the TRIPS Agreement, namely, compulsory licensing, Bolar exemptions and parallel importation. However, as of 2010, the government had not yet utilised these flexibilities to improve access to drugs.[102] There are legal provisions for data exclusivity for pharmaceuticals, but none for patent extension or linkage between patent status and marketing authorisation.[103]
Tanzania has national medicines policies (NMPs), based on the WHO’s recommendations, such as evidence-based selection, proper supply-chain management, rational use of medicines, affordable medicines, appropriate financing, human resource development, monitoring and evaluation, research, technical cooperation amongst countries, and legislative and regulatory frameworks for pharmaceuticals.[104]
The country has several pharmaceutical legislations: the Tanzania Food, Drugs and Cosmetic Act, 2003 (amendments in 2004 and 2014); Pharmacy Act, 2011; Traditional Medicines Act, 2002; Procurement Act, 2011; and Industrial and Consumer Chemical Act, 2003. The Tanzania Food and Drug Authority—a semi-autonomous supervisory body—regulates food, medical devices, cosmetics and herbal drugs in addition to pharmaceutical products.[105],[106] Medicine registration requires mandatory compliance with the national GMP (based on the WHO’s guidelines).[107] The country has a WHO-prequalified medicines QCL, part of the national MRA.[108],[109] Under special circumstances, an external laboratory may be contracted for the quality check of medicines.[110]
In 1991, the government enforced a first national drug policy, an STG and a national EML for Tanzania (NEMLIT), revised in 1997. According to a survey, the 2007 revised draft of NEMLIT was available at the MSD, but treatment guidelines were available only for tuberculosis (in the version last reviewed in 2005–06). It was found that the EML was available in 80 percent of zonal stores and 38 percent of health facility pharmacies.[111]
Rwanda started work on its national medicines policy in 2009, which is yet to be approved.[112] Currently, the medicine regulatory function is performed by the MoH,[113] and the Pharmacy Task Force under the MoH acts as the legislative authority. The country also has a WHO pre-qualified functional QCL under the Rwanda Standards Board of the Ministry of Trade, Industry and EAC Affairs.[114],[115] Some challenges currently affecting the pharmaceutical sector include the lack of an autonomous MRA,[116] high production and transportation costs, inadequate financial support, the lack of an investment strategy, a shortage of skilled personnel, and a dearth of information on market size.[117] As of 2016, pharmaceutical products were expected from patentability to take advantage of the flexibilities in the TRIPS.[118]
In Mozambique, pharmaceutical functions are regulated as per the Medicines Act under Law 4/98 and are supported by other regulations and norms. The Pharmaceutical Department under the MoH acts as the regulatory authority and all pharmaceutical products must be registered under it for quality and price control.[119],[120] The Pharmaceutical Department is supported by the Inspection Directorate and the National Laboratory for Medicines Quality Control.[121] The national EML of the country (last updated in 1999) comprises 415 medicine formulations.[122] Mozambique has no autonomous MRA.[123]
While some East African countries have comprehensive laws and policies for the regulation of medicines, others are still working towards the introduction of such policies. However, legal provisions alone are not sufficient; it is crucial to ensure their implementation at all levels to strengthen the public health institutions and ensure equitable access to quality pharmaceuticals.
VI. LESSONS FOR EAST AFRICA
India is often referred to as a “global pharmacy” due to its sprawling pharmaceutical industry, which not only meets local needs but also exports medicines across the globe. During the first half of the 20th century, India was dependent on countries such as the UK, France and Germany for pharmaceutical products. With the establishment of the Hindustan Antibiotics Ltd. in 1945 and the Indian Drugs and Pharmaceuticals Ltd. in 1961, the Indian government took its first steps towards self-reliance in pharmaceuticals. However, the local industry did not develop substantially during this period, and the Indian pharmaceutical industry consisted almost exclusively of multinationals.[124] Further, until the 1970s, multinationals were not keen on manufacturing in India, and the product patent regime prevented Indian firms from manufacturing. This resulted in an underdeveloped domestic industry, on the one hand, and exorbitant drug prices due to monopolies on the other.[125]
In 1972, the Patents and Designs Act, 1911, which provided product patent protection for pharmaceuticals, was replaced by the Indian Patent Act, 1970.[126] The new Act recognised only process patents, abolishing patents on breakthrough products that could help in the development of the domestic industry. This allowed domestic firms to legally produce and sell medicines that were patented in other parts of the world. The local industry then established a reverse-engineering capacity to develop and market copies of patented medicines at lower prices.[127] This encouraged the domestic production of pharmaceuticals, in addition to measures such as restrictions on the import of finished formulations, high tariff rates, the requirement for firms to match the import of bulk drugs to the purchase from domestic sources at a fixed ratio, and equity ceilings on foreign participation. By 1991, Indian firms were producing 80 percent of the total formulations in the country.[128]
Today, India has over 10,500 manufacturing units and 3,000 pharmaceutical companies. The country exported pharmaceuticals (APIs, generics and alternative systems of medicine) worth US$16.8 billion in 2016–17 and accounts for almost 42 percent of the generic medicines produced globally, which is the combined market size of Africa and the Middle East. North America is India’s largest export market for pharmaceuticals and buys 34 percent of India’s total exports, followed by Africa, which receives over 19 percent of India’s exports.[129]
East African countries, on the other hand, are struggling to establish in-house manufacturing capacity. Currently, there are nine local pharmaceutical manufacturers in Ethiopia, eight in Tanzania, 42 in Kenya, and one each in Rwanda and Mozambique. These countries rely primarily on imports to meet local needs. Building more factories, creating and training human resources, and fostering technical collaborations with countries that have well-established local pharma industries should be a top priority for East Africa. This will ensure the sustainability of the industry in the long run as well as improved and equitable access to essential and life-saving medicines.
Indian states follow different models of procurement and supply-chain management. Tamil Nadu, for example, pioneered the system of pooled procurement by establishing the autonomous Tamil Nadu Medical Services Corporation in 1994. The model is that of centralised procurement and free decentralised distribution of medicines at public health facilities, wherein medicines on the state’s EML are sourced into every health facility through district warehouses, using passbooks with monetary entitlements. All district warehouses are linked to a central computer at the head office, and all issue and receipt of medicines are computerised under the Drug Distribution Management System. Rajasthan replicated Tamil Nadu’s model in 2011 and established the Rajasthan Medical Services Corporation. In both states, a two-bid process is undertaken, comprising a technical bid and a financial bid.
Tamil Nadu and Rajasthan have thus managed to ensure efficient procurement and supply-chain management, while some states still struggle with the availability of medicines at the point of care. An assessment of the procurement systems in different Indian states[130] showed that for a common basket of medicines, the mean availability on the day of the survey was the highest in Tamil Nadu (81 percent), followed by Rajasthan (79 percent) and the lowest in Jammu and Kashmir (38 percent). Further, the availability was generally low at primary health centres and increased with the level of care.
Ethiopia, Tanzania, Kenya and Mozambique have established EMLs and systems of procurement. However, the outcomes have been substandard so far, with low mean availability of drugs in the public sector. The countries can benefit from studying and adopting Tamil Nadu’s model of centralised procurement and decentralised distribution, with the help of autonomous procurement agencies. Smaller countries may benefit from setting up regional procurement agencies to exploit monopsony power in buying medicines from other countries, including India. East Africa can also learn from the Indian patent regime for pharmaceuticals, which successfully incorporates TRIPS flexibilities. India transitioned to the product patent system to comply with the TRIPS Agreement in 2005, which allows the signatory countries certain flexibilities in defining the scope of patentability to safeguard their public interest. The Indian Patents Act, 1970 makes good use of this provision by discouraging frivolous patenting. When Novartis, a Swiss multinational corporation, attempted evergreening for its blockbuster medicine “Imatinib” (marketed under the brand name Glivec), used for the treatment of Chronic Myeloid Leukaemia, its patent application was rejected by the Government of India. The government’s decision was later challenged by the company in the Supreme Court of India, which upheld it.[131]
Compulsory licensing (CL), another flexibility allowed under TRIPS, lets governments authorise the production of a medicine by a company other than the originator/patent holder, in the interest of public health. The Indian government utilised this flexibility by issuing a compulsory licence to the Indian generic manufacturer Natco, for producing German pharmaceutical company Bayer AG’s cancer medicine Sorafenib tosylate (marketed as Nexavar) in March 2012, thereby considerably driving down the price of medicine.[132]
South Africa, too, holds some valuable lessons for East Africa. In 2018, the former approved its new IP policy, which entails a substantive review of all patent applications and incorporates flexibilities, such as allowing patent decisions to be challenged and provisions for compulsory licences.[133] The international community commended the new IP policy as an important step toward safeguarding public health in the country, through improved access to medicines.
CONCLUSION
East African countries can learn from India’s successes in pharmaceuticals. They must focus on setting up a robust and sustainable domestic manufacturing industry, capable of meeting domestic needs and reducing the region’s reliance on imports from other countries. Pooled public procurement of medicines via an autonomous agency established solely for this purpose can be an important step towards improving the access situation in specific countries, with the possibility of setting up a single regional procurement agency for smaller countries.
The region must also work on improving regulation policies and ensuring their proper implementation. Better utilisation of the flexibilities under the TRIPS agreement, such as compulsory licensing and provisions for patent oppositions, will go a long way in improving access to affordable essential medicines by driving down prices of patented products.
ENDNOTES
[1] African Population (1950-2019), Worldometers, https://www.worldometers.info/world-population/africa-population/.
[2] F. Ahen and O.M.H. Salo-Ahen, “Governing Pharmaceutical Innovations in Africa: Inclusive Models for Accelerating Access to Quality Medicines,” Cogent Medicine, 13 July 2018, https://doi.org/10.1080/2331205X.2018.1500196.
[3] Margareth Ndomondo-Sigonda et al., “Medicines Regulation in Africa: Current State and Opportunities,” Pharmaceutical Medicine 31, no. 6 (2017): 383–97.
[4] National Strategy and Plan of Action for Pharmaceutical Manufacturing Development in Ethiopia (2015–25), Ministry of Health and Ministry of Industry, Ethiopia, 2015.
[5] Ibid.
[6] M. Ewen, W. Kaplan, T. Gedif, et al., “Prices and Availability of Locally Produced and Imported Medicines in Ethiopia,” Journal of Pharmaceutical Policy and Practice 10, no. 1 (2017), https://doi.org/10.1186/s40545-016-0095-1.
[7] Ibid.
[8] Ibid.
[9] Ibid.
[10] C.F. Wimmer et al., “2nd EAC Regional Pharmaceutical Manufacturing Plan of Action 2017–2027,” East African Community, 2018, http://eacgermany.org/wp-content/uploads/2018/04/2nd-EAC-Regional-Pharmaceutical-Manufacturing-Plan-of-Action-2017%E2%80%932027.pdf.
[11] Kenya Pharmaceutical Country Profile, Ministry of Medical Services (Kenya) in collaboration with World Health Organisation, December 2010, https://www.who.int/medicines/areas/coordination/kenya_pharmaceuticalprofile_december2010.pdf?ua=1.
[12] As reported in a pharmaceutical trade data report by the Kenya Pharmacy and Poisons Board and a 2016 scoping study conducted by the Clinton Access Initiative on the East African pharmaceutical market.
[13] A. Akena, “Industry Map: Kenya Pharmaceutical Manufacturing,” Asoko’s Insight, 2018.
[14] C.F. Wimmer et al., op cit.
[15] Ibid.
[16] A. Akena, op. cit.
[17] Ibid.
[18] C.F. Wimmer, op. cit.
[19] A. Akena, op. cit.
[20] C.F. Wimmer, op. cit.
[21] World Health Organisation, “In-depth Assessment of the Medicines Supply System in Tanzania,” Ministry of Health and Social Welfare, Tanzania, 2008, http://webcache.googleusercontent.com/search?q=cache:XaYSAn1dVC4J:apps.who.int/medicinedocs/documents/s16503e/s16503e.pdf+&cd=1&hl=en&ct=clnk&gl=in.
[22] J. Mashingia and A. Patel, “Pharmaceutical Policy in the East African Community: Burundi, Kenya, Uganda, Rwanda, Tanzania,” in Pharmaceutical Policy in Countries with Developing Healthcare Systems, ed. Babar ZUD, (Adis Cham, 2017), 13–24, http://link.springer.com/10.1007/978-3-319-51673-8_2.
[23] M. Mackintosh, P. Tibandebage, M. Karimi Njeru, et al., “Rethinking Health Sector Procurement as Developmental Linkages in East Africa,” Social Science & Medicine 200 (March 2018): 182–89, https://doi.org/10.1016/j.socscimed.2018.01.008.
[24] C.F. Wimmer, op. cit.
[25] Rwanda: National Pharmacy Policy, Ministry of Health, Rwanda, 2016, http://www.moh.gov.rw/fileadmin/templates/policies/Pharmacy-Policy_Rwanda-2016.pdf.
[26] C.F. Wimmer, op. cit.
[27] J. Mashingia and A. Patel, op. cit.
[28] Ibid.
[29] C.F. Wimmer, op. cit.
[30] G. Russo and G. Banda, “Re-Thinking Pharmaceutical Production in Africa: Insights from the Analysis of the Local Manufacturing Dynamics in Mozambique and Zimbabwe,” Studies in Comparative International Development 50, no. 2 (2015): 258–81.
[31] Ibid.
[32] Ibid.
[33] National Strategy and Plan of Action for Pharmaceutical Manufacturing Development in Ethiopia (2015–25), op. cit.
[34] M. Ewen, W. Kaplan, T. Gedif, et al., op. cit.
[35] Ibid.
[36] Ibid.
[37] Ibid.
[38] Kenya Pharmaceutical Country Profile, op. cit.
[39] Pharmaceutical Sector Profile: Kenya, United Nations Industrial Development Organisation, 104.
[40] Ibid.
[41] C.F. Wimmer, op. cit.
[42] Ibid.
[43] World Health Organisation, “Comparison of Medicines Legislation in the East African Community,” WHO Drug Information 30, no. 4 (2016).
[44] The United Republic of Tanzania: Drug Tracking Study, Euro Health Group, Denmark, 2007.
[45] World Health Organisation, “In-depth Assessment of the Medicines Supply System in Tanzania,” op. cit.
[46] Ibid.
[47] The United Republic of Tanzania: Drug Tracking Study, op. cit.
[48] Ibid.
[49] M. Mackintosh, P. Tibandebage, M. Karimi Njeru, et al., op. cit.
[50] M. Ewen, W. Kaplan, T. Gedif, et al., op. cit.
[51] World Health Organisation, “In-depth Assessment of the Medicines Supply System in Tanzania,” op. cit.
[52] Rwanda: National Pharmacy Policy, op. cit.
[53] L.A. Kamwanja et al., “Situation Analysis Study on Medicines Registration Harmonization in Africa,” Final Report for the Southern African Development Community, NEPAD, 2010.
[54] World Health Organisation, “Comparison of Medicines Legislation in the East African Community,” op. cit.
[55] Ibid.
[56] Ibid.
[57] Ibid.
[58] The survey covered 25 locally produced and imported medicines in 34 public-sector outlets (hospital pharmacies and health facilities) and 30 private retail pharmacies across six areas in Ethiopia.
[59] Ibid.
[60] M. Ewen, W. Kaplan, T. Gedif, et al., op. cit.
[61] Ibid.
[62] Ibid.
[63] Kenya Pharmaceutical Country Profile, op. cit.
[64] The United Republic of Tanzania: Drug Tracking Study, op. cit.
[65] World Health Organisation, “In-depth Assessment of the Medicines Supply System in Tanzania,” op. cit.
[66] Global Health Observatory Data Repository, WHO, http://apps.who.int/gho/data/node.home.
[67] M. Ewen, W. Kaplan, T. Gedif, et al., op. cit.
[68] G. Russo G and B. McPake, “Medicine Prices in Urban Mozambique: A Public Health and Economic Study of Pharmaceutical Markets and Price Determinants in Low-Income Settings,” Health Policy Plan 25, no. 1 (2010): 70–84.
[69] M. Ewen, W. Kaplan, T. Gedif, et al., op. cit.
[70] Ibid.
[71] Ibid.
[72] Ibid.
[73] Ibid.
[74] Ibid.
[75] Ibid.
[76] Ibid.
[77] Ibid.
[78] Ibid.
[79] Kenya Pharmaceutical Country Profile, op. cit.
[80] The United Republic of Tanzania: Drug Tracking Study, op. cit.
[81] M. Ewen, W. Kaplan, T. Gedif, et al., op. cit.
[82] Rwanda: National Pharmacy Policy, op. cit.
[83] Ibid.
[84] MSH reference prices are the medians of recent procurement or tender prices offered by not-for-profit suppliers to developing countries for multi-source products and can be considered a useful gold standard for procurement prices in the developing world, as published by the Management Science for Health.
[85] Ibid.
[86] S. Suleman, A. Woliyi, K. Woldemichael, et al., “Pharmaceutical Regulatory Framework in Ethiopia: A Critical Evaluation of Its Legal Basis and Implementation,” Ethiop J Health Sci 26, no. 3 (May 2016): 259.
[87] Kenya Pharmaceutical Country Profile, op. cit.
[88] Pharmaceutical Sector Profile: Kenya, op. cit.
[89] The Department of Pharmacy and Division of Pharmaceutical policies monitors this policy. See, Kenya Pharmaceutical Country Profile, op. cit.
[90] C.F. Wimmer et al., op. cit.
[91] Kenya Pharmaceutical Country Profile, op. cit.
[92] World Health Organisation, “Comparison of Medicines Legislation in the East African Community,” op. cit.
[93] Ibid.
[94] Kenya Pharmaceutical Country Profile, op. cit.
[95] Wimmer C.F. et al., 2018, 2nd-EAC-Regional-Pharmaceutical-Manufacturing-Plan-of-Action-2017–2027, Est African Community Secretariat
[96] Kenya Pharmaceutical Country Profile, op. cit.
[97] Ibid.
[98] C.F. Wimmer et al., op. cit.
[99] These were last updated in 2009 and 2010, respectively.
[100] Kenya Pharmaceutical Country Profile, op. cit.
[101] Ibid.
[102] Ibid.
[103] Ibid.
[104] J. Mashingia and A. Patel, op. cit.
[105] Ibid.
[106] World Health Organisation, “Comparison of Medicines Legislation in the East African Community,” op. cit.
[107] Ibid.
[108] World Health Organisation, “In-depth Assessment of the Medicines Supply System in Tanzania,” op. cit.
[109] J. Mashingia and A. Patel, op. cit.
[110] World Health Organisation, “In-depth Assessment of the Medicines Supply System in Tanzania,” op. cit.
[111] Global Health Observatory Data Repository, op. cit.
[112] J. Mashingia and A. Patel, op. cit.
[113] L.A. Kamwanja et al., “Situation Analysis Study on Medicines Registration Harmonization in Africa,” op. cit.
[114] Ibid.
[115] World Health Organisation, “Comparison of Medicines Legislation in the East African Community,” op. cit.
[116] J. Mashingia and A. Patel, op. cit.
[117] C.F. Wimmer et al., op. cit.
[118] Kaitlin Mara, “New Rwanda IP Policy Taps Information for Development,” Intellectual Property Watch, 2010, http://www.ip-watch.org/2010/06/08/information-the-lifeblood-of-development-flows-in-rwanda/
[119] G. Russo G and B. McPake, “Medicine Prices in Urban Mozambique: A Public Health and Economic Study of Pharmaceutical Markets and Price Determinants in Low-Income Settings,” op. cit.
[120] G. Russo and G. Banda, “Re-Thinking Pharmaceutical Production in Africa: Insights from the Analysis of the Local Manufacturing Dynamics in Mozambique and Zimbabwe,” op. cit.
[121] G. Russo and G. Banda, “Re-Thinking Pharmaceutical Production in Africa: Insights from the Analysis of the Local Manufacturing Dynamics in Mozambique and Zimbabwe,” op. cit.
[122] Country Data Profile on the Pharmaceutical Situation in Mozambique, World Health Organisation, http://webcache.googleusercontent.com/search?q=cache:WlIlg5wB-AAJ:apps.who.int/medicinedocs/en/m/abstract/Js17212e/+&cd=1&hl=en&ct=clnk&gl=in.
[123] Tânia Vuyeya Sitoie, “Regulatory Capacity Building in Mozambique: Cooperation with Brazilian Regulatory Authority,” Pharmaceutical Department, Ministry of Health, Singapore, 2010.
[124] S.E. Smith, “Opening up to the World: India’s Pharmaceutical Companies Prepare for 2005,” Asia Pacific Research Centre, Institute for International Studies, 2000.
[125] Sudip Chaudhuri, “Multinational and Monopolies Pharmaceutical Industry in India after TRIPS,” Indian Institute of Management Calcutta, WPS No. 658, 2011.
[126] Sudip Chaudhuri, “The Gap Between Successful Innovation and Access to its Benefits: Indian Pharmaceuticals,” The European Journal of Development Research 19, no. 1 (2007): 49–65.
[127] S. Chaudhari, C. Park and K.M. Gopa Kumar, “Five Years into the Product Patent Regime: India’s Response,” United Nations Development Programme, 2010.
[128] J.O. Lanjouw, “The Introduction of Pharmaceutical Product Patents in India: ‘Heartless Exploitation of the Poor and Suffering’? National Bureau of Economic Research, Working Paper 6366, 1998.
[129] Make in India, http://www.makeinindia.com/sector/pharmaceuticals.
[130] Selvaraj et al., “Access to Medicines Report,” Public Health Foundation of India and the Norwegian Embassy, 2015.
[131] K.M. Gopakumar, “Patents and Access to Medicines: Constrains for the Use of Flexibilities,” in Access to Medicines in India, eds. S. Selvaraj, D. Abrol and K.M. Gopakumar (Academic Foundation, 2014) 105–44.
[132] S. Selvaraj and A. Mehta, “Access to Medicines, Vaccines and Medical Devices in India,” in India Infrastructure Report 2013–14: The Road to Universal Health Coverage (Delhi: IDFC and Orient Black Swan, 2014).
[133] Medecins Sans Frontiers, 2018, https://www.msf.org.za/stories-news/press-releases/south-africas-new-ip-policy-welcomed-msf-and-fix-patent-laws-campaign.
The views expressed above belong to the author(s). ORF research and analyses now available on Telegram! Click here to access our curated content — blogs, longforms and interviews.

Sakthivel Selvaraj is Director Health Economics Financing and Policy at the Public Health Foundation of India (PHFI) New Delhi. He is currently engaged in research ...
Read More +