Introduction
Recent developments have given rise to perceptions of China’s interference in the Brahmaputra, one of India’s major river systems that straddles India, Bangladesh and China. These events include the commissioning in 2014 of the Zangmu hydropower project on the Yarlung Tsangpo (river Brahmaputra’s tributary in Tibet) downstream of Yangcun in Tibet; China’s plans to construct a 1,000-kilometre-long tunnel to divert the flows of the river;[1] and the blackening of the Siang in Arunachal Pradesh in 2017.[2] China is increasingly being seen as an upstream hydro-hegemon with plans for major interventions over the Yarlung river, which is an important tributary of the Brahmaputra. (Brahmaputra is the name of the combined flows of three tributaries, the Luhit, Dibang and Siang—or Yarlung—downstream of the town of Sadiya in Assam in India.)[3] [4] These interventions are projected to have a negative impact on downstream areas in India and Bangladesh.[5]
Various analysts have warned that a war over water may be imminent between India and China.[6], [7] The concern is two-fold: First, a south-to-north water diversion in China from the Yarlung Tsangpo would result in the Brahmaputra ceasing to flow altogether; and second, China has shown unwillingness to sign any binding agreement with downstream states over transnational rivers. The same analysts emphasise that the absolute sovereignty[a][8] of water overrides the realpolitik around international watercourses.[9]
Other scholars have argued another way, and observe that the precipitation levels in the north aspect of the Himalayan Arc in the Chinese (Tibetan Plateau) area are marginal, resulting in relatively low flows in the upper reaches of Brahmaputra.[10] Therefore, a diversion in those parts will have little impact on the flow of the Yarlung, the tributary to Brahmaputra, as to make it a dry river. As such, the idea of diversion of flow from the Yarlung Tsangpo also appears to be far-fetched. Moreover, the Chinese government is increasingly realising the futility of water diversion projects as a solution to water shortage.[11] President Xi Jinping’s New Foreign Policy Doctrine of bringing amity, security, and common prosperity to China’s neighbourhood is critical for China’s peaceful rise and continued economic growth. Under such circumstances, the radical Grand Western Water Diversion Plan[b][12] (GWWDP) seems even more unlikely to fructify as it directly contradicts the role that China envisions for itself in the region.[13]
As a precondition for engagement with other nations, China emphasises that outstanding issues be resolved and cooperation over shared watercourses improved, and only through bilateral engagements. Precedents have been set by certain bilateral engagements that China has entered into with neighbours like Kazakhstan and Russia.[14] While China does not have a specific transboundary river policy, it manages issues in this domain as part of its broader relations with its fellow riparian states. Bilateral joint development is a useful platform for enhancing cooperation with China while leveraging the nation’s increasing willingness to abide by internationally accepted norms of behaviour.[15]
For India, there is an existing Memorandum of Understanding (MoU), first signed in 2002, on the sharing of flow data on the Yarlung Tsangpo (tributary to the Brahmaputra flowing from China to India). The MoU is aimed at facilitating advance warning for flooding in the Brahmaputra during monsoon. The importance of early warning in this region cannot be overemphasised, as floods in the Brahmaputra system have been responsible for substantial losses of life and property in Assam.[16] The MoU was operational between 2008 and 2012; a follow-up MoU was signed in 2013 for extending this exchange of flow data of the Yarlung Tsangpo during flooding seasons.[17] The MoU was renewed in June 2018, and a provision has been added for data sharing if the water level comes close to the warning level during non-flood seasons. For its part, India is required to share information regarding data utilisation in flood forecasting and mitigation. The exchange works in conjunction with the establishment of an institutional mechanism, the India-China Expert Level Mechanism (ELM) on Trans-border Rivers.
Despite the MoU, however, China in 2017 declined to share data with India, saying that the instruments and installations in the measuring stations have been destroyed. Some Indian analysts theorised that much of the damage due to the Assam floods that year could have been avoided if the data has been supplied by China.[18]
In July 2019, China did share satellite data with India on different flood-hit regions in the country, including Assam, aiding in relief efforts. The sharing was done upon the request of the Indian Space Research Organisation (ISRO) on July 17 to the 32 countries that are signatories to the International Charter Space and Major Disasters.[19] The sharing of satellite data from the China National Space Administration, as well as the nodal remote sensing agencies of France and Russia, helped India in its relief efforts in the districts of Dhubri, Marigaon, Barpeta, Dhemaji and Lakhimpur in Assam.[20]
The Yarlung-Tsangpo/ Brahmaputra system: An Overview
Flowing along the north aspect of the Himalaya, the complex drainage system of Yarlung Tsangpo/Brahmaputra drains parts of Southern Tibet, India’s northeast, Bhutan, and a large part of Bangladesh. Of its total length of 2,880 kilometers, 1,625 Km flows through Tibet as the Yarlung Tsangpo, 918 Km in India as the Siang/Dihang and Brahmaputra, and the other 337 Km in Bangladesh as the Jamuna until it merges into the Padma near Goalando. The Brahmaputra is identified as the flow downstream of the meeting of three tributaries—namely, Luhit, Dibang, and Siang/Dihang, near Sadiya in Assam.[21]
This geographical distribution of length gives the impression that the Yarlung-Tsangpo has a substantial contribution to the total flow of the Brahmaputra, thereby fueling concerns in the downstream riparian nations. In India, for example, there was palpable worry after the partial operationalisation in 2014 of the Zangmu hydropower project, which was essentially a run-of-river project. This is despite reassurances from China that “to transfer Tibet’s electricity out, the exploitation of hydropower resources in the region is likely to be mainly concentrated on the Jinsha River, Lancang River and Nujiang River, which are located close to the border area between Tibet and other Chinese provinces.”[22]
Figure 1 : Map of Yarlung Tsangpo / Brahmaputra basin depicting its transnational nature and important discharge monitoring stations.

Source: Map prepared by authors, data on administrative boundaries sourced from GADM,[23] data on basin boundary sourced from CEO Water Mandate[24]
Understanding the hydro-meteorology of the concerned area
The Brahmaputra is fed by both rainfall, as well as snow and glacial melts. The Normalised Melt Index (NMI)[c] of the Brahmaputra is in the low range of 0.15-0.2, signifying that snow and glacial melt, the main source of run-off in the Tibetan region, contribute little to the total flow.[25]
The precipitation varies across the Brahmaputra sub-basin due to variability of climate, altitude, temperature, pressure, latitude, and orography, and variable interactive impacts of different prevailing winds. The Tibetan component of the basin, i.e. the longer stretch of the Yarlung, being located on the north aspect of the Himalaya, receives much less rainfall as compared to the south aspect. This is primarily because of the Himalayan orogeny and its influence on the movement of moisture-laden air currents. Rainfall over eastern Tibetan Plateau (TP), caused by the moisture laden winds originating in the Bay of Bengal, is connected to this part of the plateau through a moisture corridor. This corridor extends along the Brahmaputra and Siang rivers until Arunachal Pradesh, and thereafter, through the Yarlung into Tibet.[26] The Tibetan plateau and the higher reaches of the basin over 3,000 m.a.s.l receive snowfall during the winter months of December to February. The southeastern part of Tibet receives the monsoon rains during the months of July and August.[27]
However, the overall annual precipitation in the trans-Himalaya averages about 300 mm. As the flow moves to the south aspect of the Himalaya, the annual average precipitation (that includes mainly rainfall) reaches about 4,500 mm.[28] The foothills are frequently fed by anomalous precipitation of magnitude that is capable of causing great floods.[29]
Within the Brahmaputra valley in Assam, the average annual rainfall is higher in the north-eastern areas, which gradually decreases towards the western parts. In the peak flow periods, the Brahmaputra is fed by the monsoon rainfall. However, during the lean period, the contribution of snow and glacier melt is higher in Yarlung and consequently, the Brahmaputra. Table 1 shows the precipitation across the various stations in the basin, and reveals how Shigatse and Lhasa in the northern aspect of the Himalaya receives much less rainfall compared to the regions in the southern aspect of the Himalaya in India (Tuting and Guwahati), and in Bangladesh (Bahadurabad).
Table 1 : Mean monthly rainfall across five stations within the Brahmaputra sub-basin
| Station |
Shigatse[30] |
Lhasa[31] |
Tuting[32] |
Guwahati[33] |
Bahadurabad[34] |
| Month |
Rainfall (mm) |
Rainfall (mm) |
Rainfall (mm) |
Rainfall (mm) |
Rainfall (mm) |
| January |
1 |
3 |
29 |
10 |
10 |
| February |
1 |
13 |
44 |
4 |
13 |
| March |
4 |
8 |
78 |
25 |
33 |
| April |
13 |
5 |
84 |
145 |
88 |
| May |
19 |
25 |
71 |
236 |
283 |
| June |
24.5 |
53 |
66 |
312 |
439 |
| July |
41 |
122 |
98 |
312 |
428 |
| August |
34 |
89 |
112 |
261 |
370 |
| September |
21 |
66 |
73 |
167 |
306 |
| October |
8 |
13 |
49 |
71 |
164 |
| November |
1 |
3 |
32 |
14 |
15 |
| December |
2 |
0 |
31 |
4 |
2 |
| Total |
169.5 |
400 |
767 |
1561 |
2151 |
Figure 2: Isohyet map showing distribution of precipitation in the Yarlung Tsangpo / Brahmaputra basin at the Great Bend and adjacent areas.

Source: Authors’ own, based on Bookhagen’s compilation of TRMM data (1998 to 2009)[/caption]
Such differences in precipitation have resulted in huge variations in the flow regimes across the basin. As such, a large component of the total annual flow of the Brahmaputra is generated in the southern aspect of the Himalaya in India by tributaries from Buri Dihing in the East to Teesta in the west. The total annual outflow of the Yarlung from China is estimated to be about 31 BCM (billion m3) while the annual flow of Brahmaputra at Bahadurabad, the gauging station near the end of the sub-basin in Bangladesh, is about 606 BCM.[35] These figures do not support the linear algebraic thinking that the flow in a river is proportional to its length inside a country. Further, while the peak flows at Tsela Dzong and Nuxia in Tibet are about 5,000 and 6,000 cumecs, respectively,[36], [37] the peak flow at Pandu (Guwahati) is approximately 60,000 cumecs.[38] (See Fig. 3) The lean season flow in Nuxia, as identified from a hydrograph given in the volume Rivers and Lakes of Xizang (Tibet) (in Chinese) and also by Cai et al (2017) is pegged at 500 cumecs, while the lean flow at Bahadurabad in Bangladesh is about 5,000-odd cumecs[39] (See Fig. 4A and Fig. 4B). This is due to the intense monsoon precipitation on the southern aspect of the Himalaya. While Nuxia receives around 405 mm of rainfall during monsoon,[40] as the flow of the Yarlung reaches the southern aspect, the annual rainfall in a location like Pasighat on the plains touches about 4,500 mm.
Figure 3: Relative Hydrographs of Brahmaputra sub-basin[41]

Figure 4: Relative Hydrographs
(A) Nuxia (Tibet)[42]

(B) Pandu (Guwahati) and Bahadurabad[43]

Table 2 : Discharge at various sites on the Yarlung Tsangpo, Siang, Brahmaputra, Jamuna river
| Stretch |
Observation Site |
Mean Annual Discharge (in BCM) |
Source of Data |
| Yarlung Tsangpo |
Nuxia |
31.2[44] |
a. Jiang et. al. (2015) |
| Yarlung Tsangpo |
Point leaving China |
135.9[45] / 78.10[46] |
Huang et al. (2007), as seen in Cuo et al. (2014)[47] / MOWR (2012)[d] |
| Siang |
Pasighat |
185.1[48] |
Sharma (2003) |
| Brahmaputra |
Bechamara, Majuli |
278.4[49] |
Brahmaputra Board (1995) |
| Brahmaputra |
Pandu |
526.1[50] |
WAPCOS (1993) |
| Jamuna |
Bahadurabad |
605.49[51] |
Brahmaputra Board (1995) |
Data Sharing on Yarlung Tsangpo/Brahmaputra for Advanced Flood Warning
Under the direct exchange mechanism of the MOU, China is supposed to provide India with hydrological information (including water level, discharge, and rainfall) for three stations on Yarlung: Nugesha, Yangcun and Nuxia located in Tibet (See Fig. 1). This information is to be provided twice a day at 08:00 hrs and 20:00 hrs (Beijing Time) during the high flow season of May 15 to October 15 every year.
However, given the data on hydro-meteorological variation of the Brahmaputra system, it is likely that the present data-sharing mode can help only minimally in providing early flood warning for Brahmaputra. Figures 1 and 2 show that the three designated hydrological stations for data exchange—namely, Nugesha, Yangcun and Nuxia—are located in the rain-shadow area, with annual average precipitation in the range of 0-500 mm. Nuxia is in the downstream of the other two, with the maximum flow during high season being 4,500 cumecs (See Fig. 4), as stated earlier, with an average flow of around 1,000 cumecs. An important left-bank tributary – Parlung Tsangpo—joins the Yarlung further downstream of Nuxia. This substantially increases the flow downstream of Nuxia. On the other hand, the precipitation also increases substantially downstream of their confluence. Therefore, there is a compounded effect on stream-flow.
This is corroborated by the discharge data (See Table 2) which shows that the discharge of Yarlung increases by more than twice as the river crosses Nuxia, undertakes the ‘great bend’, and enters India. India is most concerned of the area between Nuxia, the last hydrological station from which India receives flood-period data, and Tuting, the first hydrological station within Indian territory between which the river traverses approximately 320 km. On this rain-rich part of the journey of the river, however, no data is available.
Figure 5: Distribution of avalanches, landslides, and debris flows in the lower Yarlung Tsangpo basin[52]

Figure 6: Map showing the distribution of Extreme Events at the Great Bend.
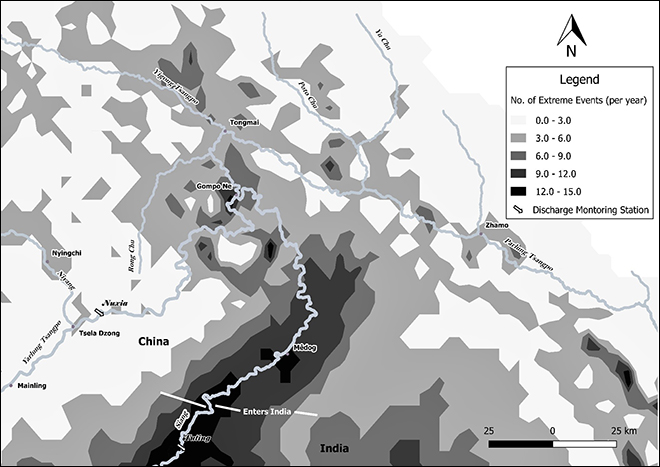
Source: Authors’ own, based on Bookhagen (2010)’s compilation of TRMM data (1998 to 2009)[/caption]
The distance traversed by the Yarlung from Nuxia to Bome County (where it is joined by Parlung) is approximately 130 km. As seen in Fig. 2 and Fig. 5, the regions comprising the basins of Yigong Tsangpo, Parlung Tsangpo, and the Lower Yarlung (entailing the Great Bend), exhibit high monsoonal precipitation with strong possibilities of landslides and avalanches that could lead to flash flood events. This is corroborated by the fact that in many of the patches, 10 or more instances of such hazardous events occur yearly, increasing the hazard risk further downstream. Fig. 6 shows that the entire region experiences at least three extreme events[e][53] throughout the year.
This raises questions over the effectiveness of choice of stations for data exchange for early flood warning, given that it is the downstream districts of Arunachal Pradesh and Assam that are most vulnerable to floods in that region. By virtue of its location at the foothills of the Himalaya and the abrupt decline in the river’s gradient, East Siang especially becomes a potentially vulnerable zone. This can also seriously affect the neighbouring districts of Dhemaji and Dibrugarh in Assam, with the travel time of flood wave from Pasighat to Dibrugarh being only 12 hours.[54]
Conclusion
This brief set out to reorient the discourse on advance flood warning for Brahmaputra by offering a more nuanced discussion informed by science. Any incident, anthropogenic or natural, on the north of the Himalayan crestline has little substantial impact on the flow regime (water and sediments) in the downstream, but the same is not true once the river crosses the Himalayan crestline.[55] [56] This finding has a bearing on both, the scare with supposed Chinese interventions on the north of the crestline, and the MoU between India and China on data-sharing on flood warnings.
There is enough information to suggest that the two countries have coordinated in the past for creating emergency response arrangements at the instance of any landslide-induced damming of waters in the region downstream of Nuxia and upstream of Tuting. On at least two such instances in 2018, on 16 October and 28 October, Chinese officials had reported about such an occurrence. In the former case, a temporary observation site was also opened at the site of blockade from where hourly observations were noted and relayed to Indian officials. Mathematical models and dam break modelling were employed by India’s Central Water Commission to draw the likely impact of the flow of water and carry out immediate preventive measures in the states of Arunachal Pradesh and Assam.[57]
Therefore, there is an ardent requirement to identify hydrological stations between Nuxia and Tuting, particularly within the great bend of the Yarlung /Brahmaputra. Infrastructure for hydrological observation needs to be created where it is lacking within this stretch. Mêdog, located about 50 km upstream of Tuting and at the confluence of Chimodro Chu, and Gompo Ne which is located about 150-odd km upstream of Tuting and at the confluence of Parlung, could be the sites of these stations (See Fig. 2). These stations would provide a more realistic observation and will be representative of the high rainfall regions at and below the great bend of the Yarlung Tsangpo.
Addressing this issue within a bilateral setting will clear the air of scepticism and improve future engagements pertaining to the Yarlung/ Brahmaputra River. The institutional mechanism of Expert Level Mechanism (ELM) for trans-border rivers could be leveraged for raising this issue and making concerted efforts at resolving it.
Endnotes
[a] The ‘Harmon Doctrine’ or absolute territorial sovereignty reflects the generally favoured view of most upstream states. It holds the view that a country has an absolute territorial sovereignty over the waters of an international watercourse that is located within its borders which effectively means that it is free to exploit the waters located within its territory as it desires (Mc Caffrey, 1996).
[b] The GWWDP intends to divert water from the upstream sections of six rivers in south west China, including the upstream of the Mekong, the Brahmaputra River, and the Salween, to the dry areas of northern China through a system of reservoirs, tunnels, and natural rivers (Guo, 1993)
[c] Normalised melt index (NMI) is defined as the volumetric snow and glacier upstream discharge divided by downstream natural discharge.
[d] 135.9 BCM is a data derived from hydrological modelling and has been peer reviewed. 78.10 BCM is a figure provided by the Government of India without specifying the period for which the data has been collected. Both these estimates buttress the central argument of the paper that bulk of the discharge is generated in the region downstream of Nuxia.
[e] Following Bookhagen (2010), an extreme event is defined as the daily rainfall magnitude whose probability of occurrence exceeds the 90th percentile, with percentiles being identified from the probability density function of the 3-hour rainfall data collected over a 11-year period (1998 – 2009).
[1] “China planning 1,000km tunnel to divert Brahmaputra water from Tibet to Xinjiang”. Livemint, October, 2017.
[2] “Secret Chinese tunnel or natural phenomenon: What explains the Brahmaputra waters turning black“? Scroll, December, 2017.
[3] Jayanta Bandyopadhyay, Nilanjan Ghosh, Chandan Mahanta. 2016. IRBM for Brahmaputra Sub-basin: Water Governance, Environmental Security, and Human Well-Being. New Delhi. Observer Research Foundation.
[4] Nilanjan Ghosh, “The Brahamaputra: floated myths and flouted realities”. The Third Pole, December 19, 2017.
[5] Brahma Chellaney, Water: Asia’s New Battleground (Georgetown University Press, 2011).
[6] Mark Christopher, “Water Wars: The Brahmaputra River and Sino-Indian Relations”, CIWAG Case Studies, 7 (2013).
[7] See (5)
[8] Stephen C. McCaffrey, “The Harmon Doctrine one hundred years later: Buried, not praised”, Natural Resources Journal 36 (1996): 965–1007.
[9] Hongzhou Zhang, "Sino?Indian water disputes: the coming water wars"? WIREs Water 3 (2016): 155-166. 10.1002/wat2.1123
[10] See (3)
[11] See (9)
[12] Kai Guo, “Brief review of Shuotian Canal project,” Optim Capital Constr 13 (1993) :1–5
[13] See (9)
[14] Selina Ho,"River politics: China's policies in the Mekong and the Brahmaputra in comparative perspective", Journal of Contemporary China 23, no. 85 (2014): 1-20.
[15] Ibid.
[16] See (9)
[17] Amit Ranjan, "India-China MoU on Transboundary Rivers," Indian Council if World Affairs, (November 2013)
[18] See (4)
[19] “International Charter Space and Major Disasters”. UN-SPIDER, accessed November 30, 2019.
[20] “China, Russia, France share satellite data on Assam floods”. The Hindu, July 26, 2019.
[21] Datta, B. and V.P. Singh, “Hydrology,” in The Brahmaputra Basin Water Resources, ed. V.P. Singh, N. Sharma, C. Shekhar and P Ojha (Boston: Kluwer Academic Publishers, 2004) 139-95
[22] Hu Weijia, “India needn’t be overly sensitive to Tibet’s plan to develop hydropower resources,” Global Times, November 22, 2017
[23] Global Administrative Areas. 2012. GADM database of Global Administrative Areas, version 2.0. (online).
[24] CEO Water Mandate. 2016. Interactive Database of the World's River Basins.
[25] Walter. W. Immerzeel, Ludovicus P. H. van Beek, and Marc F. P. Bierkens, “Climate change will affect the Asian water towers.” Science 328, 5984 (2010): 1382-1385. 10.1126/science.1183188
[26] Wenhao Dong, Yanluan Lin, Jonathon S. Wright, Yi Ming, Yuanyu Xie, Bin Wang, Yong Luo, Wenyu Huang, Jianbin Huang, Lei Wang, Lide Tian, Yiran Peng, and Fanghua Xu, “Summer rainfall over the southwestern Tibetan Plateau controlled by deep convection over the Indian subcontinent,” Nature communications 7, 10925 (2016). 10.1038/ncomms10925
[27] See (4)
[28] See (4)
[29] See (4)
[30] World Weather Online. Date for the period between 2009 and 2018. Accessed May 22, 2018.
[31] See (4)
[32] See (30)
[33] See (4)
[34] Ibid.
[35] Chong Jiang, Linbo Zhang, Daiqing Li, and Fen Li, “Water discharge and sediment load changes in China: change patterns, causes, and implications," Water 7, no. 10 (2015): 5849-5875
[36] See (21)
[37] Mingyong Cai,Shengtian Yang ,Changsen Zhao, Qiuwen Zhou, and Lipeng Hou,“Insight into runoff characteristics using hydrological modeling in the data-scarce southern Tibetan Plateau: Past, present, and future”. PLOS ONE 12, 5 (2017).
[38] See (21)
[39] See (37)
[40] Leilei Zhang, Fengge Su, Daqing Yang, Zhenchun Hao, and Kai Tong. "Discharge regime and simulation for the upstream of major rivers over Tibetan Plateau”. Journal of Geophysical Research: Atmospheres, 118,15 (2013): 8500-8518.
[41] See (21)
[42] Friedrich-Schiller University, “Twinning European and South Asian River Basins to enhance capacity and implement adaptive management approaches”, September 2008.
[43] See (21)
[44] Chong jiang, Linbo Zhang, Daiqing Li, and Fen Li, "Water discharge and sediment load changes in China: change patterns, causes, and implications.," Water 7, no. 10 (2015): 5849-5875
[45] Junxiong Huang, Xu Zongxue, and Gong Tongliang, “Characteristics and driving factors of the runoff variations in the Yarlung Zangbo River,” Journal of China Hydrology. 27,5 (2007): 31–35 (in Chinese)
[46] Standing committee on water resources (2011-2012), Ministry of Water Resources. Augmentation of depleted ground water level, sustainable development, conservation, management, use of ground water and prevention of water pollution. March 2012.
[47] Lan Cuo, Yongxin Zhangb, Fuxin Zhua and Liqiao Lianga, “Characteristics and changes of streamflow on the Tibetan Plateau: A review,” Journal of Hydrology: Regional Studies. 2 (2014): 49-68
[48] J. N. Sharma, “Rivers, Water resources of the Brahmaputra: Viabilities and apprehensions.” Proceedings of the National Seminar on Linking the Major Rivers of India: Possibilities and Apprehensions (2003).
[49] Brahmaputra Board, “Part-1: Main stem.” In Additional Volume for Master Plan of Brahmaputra basin. India: Brahmaputra Board (1995)
[50] WAPCOS [Water and Power Consultancy Services (India)], Morphological Studies of the River Brahmaputra. New Delhi: North Eastern Council. Govt. of India (1993).
[51] See (49)
[52] Zhaoyin Wang, Zhiwei Li, Mengzhen Xu, and Guoan Yu, River Morphodynamics and Stream Ecology of the Qinghai-Tibet Plateau (Florida: CRC Press, 2016)
[53] Bodo Bookhagen, "Appearance of extreme monsoonal rainfall events and their impact on erosion in the Himalaya," Geomatics, Natural Hazards and Risk, 1,1(2010): 37-50
[54] See (21)
[55] See (3)
[56] “China cannot rob us of Brahmaputra”. The Hindu Business Line, November, 2017.
[57] Central Water Commission,“Jalansh – The Monthly Newsletter of Central Water Commission,” Issue 4, 2018.
The views expressed above belong to the author(s). ORF research and analyses now available on Telegram! Click here to access our curated content — blogs, longforms and interviews.

 PDF Download