-
CENTRES
Progammes & Centres
Location
 PDF Download
N Vedachalam, “Building Resilience in India’s Power Sector,” ORF Occasional Paper No. 363, August 2022, Observer Research Foundation.
Image Source: Building Resilience in India’s Power Sector
Despite current policies and regulations limiting the use of hydrocarbon resources, the worldwide energy-related greenhouse gas (GHG) emissions are expected to reach 45 Million Metric Tons (MMT) by 2040—a 46-percent increase over the 2010 level. Based on states’ commitments spelt out in the United Nations Framework Convention for Climate Change (UNFCCC) and operationalised by the Kyoto protocol, the Copenhagen Accord, and the Cancun agreement, developed countries have agreed to assist developing countries by mobilising funds towards reducing GHG emissions and implementing adaptation measures to climate change. During the Paris convention in 2015, 187 countries—responsible for more than 97 percent of the world’s historical GHG emissions—announced their Nationally Determined Contributions (NDCs) towards emissions reduction.[1] The convention set the minimum obligations of signatories and held them accountable for their commitments. UNFCCC bodies[a] were mandated to develop accounting rules for the parties to follow and track public climate finance to countries including India that will deliver the mitigation actions needed to meet the 2 °C target.[2]
Global investments in clean energy technologies increased six-fold to US$ 282 billion between 2004 and 2019, and could surpass US$ 1 trillion by 2030.[3] However, governments must tailor their post-pandemic economic recovery programmes to incorporate the phase-out of fossil fuels and the parallel deployment and use of renewable and cleaner fuels. The UN Climate Change Conference in Glasgow (COP26) in 2021 reiterated the pillars of a global strategy that will advance the implementation of the Paris Agreement through more sustainable and low-carbon pathways (see Fig. 1). These elements include reducing cost of low-emission technology and promoting an economy-wide green transition. New deals and announcements at COP26 include the halting and reversal of forest loss and land degradation, a pledge to reduce methane, the promotion of zero-emission vehicles, nurturing a low-carbon economy, and encouraging private finance to fund technology and innovation.
Fig. 1. Key COP26 Announcements

Source: United Nations Climate Action[4]
For achieving clean energy targets, the global priority areas and technologies underlined by the World Economic Forum in a white paper include technologies such as smart power grids (see Table 1).[5] This present paper refers to the India Energy Security Scenarios (IESS), 2047, an energy scenario building tool developed by the Indian government policy think-tank NITI Aayog[6] to analyse current trends in the country’s power sector.
Table 1. Global Priority Areas and Technologies

Source: Word Economic Forum White paper on Globalization 4.0.
Electricity falls under the Concurrent list of the Seventh Schedule of the Constitution of India, mandating both the Union Government and State Government to legislate on the matter. Following Independence, the sector was predominantly governed by State governments through the State Electricity Boards (SEB) created under the Electricity Act of 1948. The SEBs were tasked to enhance transmission infrastructure, increase power generation, and improve electricity access across the country. However, due to various structural, operational, financial and political reasons, the SEBs started incurring heavy losses by the 1970s. Among these factors was political interference in the form of heavy subsidies to the agricultural sector.[7]
Following the opening of the economy in 1991 and subsequent reforms in the electricity sector, independent regulatory commissions were established at the state level.[b] The commissions were tasked to regulate the tariff for the Generation, Transmission and Distribution Companies within their jurisdiction. Close to 20 years of having a regulated regime since the implementation of the Electricity Act 2003, financial challenges caused by legacy issues continue to beset the sector.
There are efforts, both at policy and implementation level, to enhance the efficiency of the power sector by cutting down subsidies to consumers and charging a cost-reflective tariff. Some of the ways by which policymakers have attempted to deliver on this objective include Direct Benefit Transfer, infusing competitive bidding for tariff determination, and privatisation of utilities. However, such reforms require acceptance by the public and a credible plan of action to address concerns, particularly from the point of view of consumer interest.
All these efforts aimed at a financial overhaul of the sector are also facing externalities. The increased push for adoption of renewable energy, amidst the growing consensus on climate action, will also affect the future of the sector. The goal-post has shifted from merely enhancing the efficiency of the sector and promoting public welfare, to doing so while using bigger shares of renewable energy and integrating the strategy with India’s development goals.
The National Electricity Policy enacted in 2021[8] is testimony to this paradigm shift. The policy lists the following key objectives:
India’s goals for the energy sector are in consonance with global trends towards cleaner and more sustainable power. According to a report by the World Resources Institute (WRI) in 2017, India is responsible for 6.65 percent of total global carbon emissions, ranked fourth next to China (26.83 percent), the United States (US, 14.36 percent), and the European Union (EU, 9.66 percent). However, while India may rank high in total emissions, its measure per capita stands at 1.83 MT CO2—the lowest amongst economies of comparable size such as China (7.72 MT CO2), the EU (6.97 MT CO2), and the US (15.74 MT CO2).[9] Moreover, as reported by Oxfam International and Stockholm Environmental Institute, the wealthiest one percent of the global population accounted for 15 percent of total emissions in 2020, while the poorest 50 percent contributed 7 percent.[10] Another study, this time of India conducted by the Research Institute for Humanity and Nature in Japan, reported that the top 20 percent of high-expenditure households in the country contributed seven times more carbon emissions than the poorest households.[11]
India’s energy resources and their exploitation levels are shown in Table 2. India has 7.1 percent, 0.33 percent, and 0.07 percent of global reserves of conventional coal, oil, and natural gas (NG), respectively. Without import substitution, and with the present rate of fossil resource consumption, domestically available coal will last for only 77 years, oil for 4.5 years, and NG for 19.6 years.
Table 2. Energy Resources in India and Utilisation[12],[13],[14]
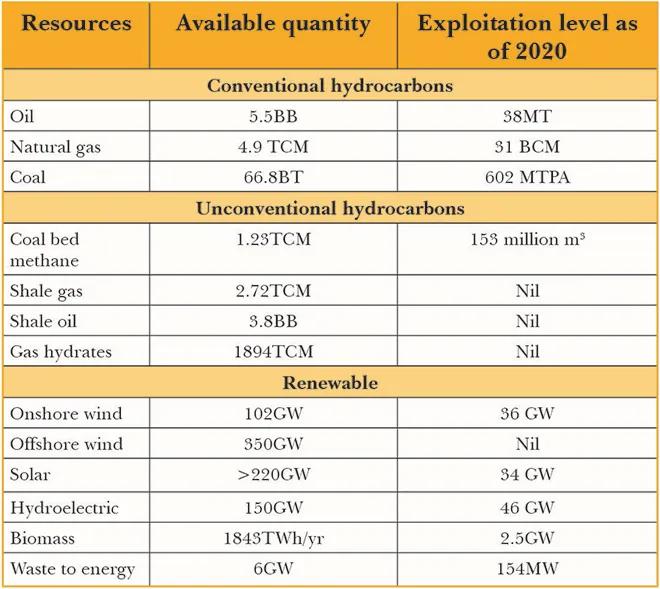
Note BB: Billion Barrels; BT: Billion Tons; MT: Million Tons; BCM: Billion Cubic Meters; TCM: Trillion Cubic Meters; MTPA: Million Tons Per Annum; MW: Megawatt; GW: Gigawatt; TWh: Terawatt-Hour
During the Paris convention, India committed to increase its cumulative installed non-fossil-fuel-based electricity generation capacity in the national power generation portfolio (PGP) to 40 percent by 2030. It also made a commitment to reduce emissions intensity by 35 percent from 2005 levels.
Towards achieving SDG 7, India needs to achieve 100-percent national electrification[c] through grid connections or mini- and off-grid systems by 2040. It will also need to address electricity demand as it works to reach a national GDP target of US$17 trillion by 2040—a goal that will require reliable power supply for the manufacturing sector; increase the reliability of the power supply networks by reducing power outages from a current level of 20 times per month; and improve living standards by increasing per-capita energy consumption from 200 kWh closer to the world average of 950 kWh.[15] Indeed, India requires sustained efforts to fulfil the commitments it made at COP26 in the areas of renewable energy addition, and emissions and carbon intensity reduction (see Fig. 2).
Fig. 2. India’s COP26 Commitments

Source: United Nations Climate Action[16]
Amidst the pandemic, where global funding is inadequate, reconciling the climate goals with limited national investments requires vision, involvement of latest technology, management, monitoring, and time-bound regulatory reforms. These reforms should aim to increase the efficiency, reliability and quality of the power generation and transmission systems through the use of low-carbon fuels, GHG emission control techniques, grid-connected energy storage, powering electric mobility, and smart power grids (see Fig. 3).
Fig. 3. Key Requirements and Technology-Solution Relationship

Source: Author’s own
Various central and state agencies involved in the power sector have their own roles to play in achieving these objectives (see Table 3).
Table 3. Agencies in India’s Power Sector

Source: Author’s own
1. India’s per-capita emissions are 60-percent lower than the global average (see Figure 4). However, energy generation is highly emission-intensive.
Fig. 4. Per-capita Emissions and Electricity Generation, Select Countries

Source: International Energy Agency [17]
2. India stands at the cusp of a solar takeover: solar is expected to be the dominant source of power generation in the next three decades (see Figure 5).
Fig. 5. Installed and Power Capacities of Solar and Coal-Based Generation

Source: India energy security scenario calculator 2047[18]
3. India will make up the biggest share of global energy demand growth at 25 percent over the next two decades, as it overtakes the EU as the world’s third-biggest energy consumer by 2030. At present, India is the fourth-largest global energy consumer behind China, the US, and the EU.
4. India’s energy consumption is expected to nearly double as the nation’s Gross Domestic Product (GDP) expands to approximately US$ 8.6 trillion by 2040.
5. Fossil fuels continue to play a significant role in India’s primary energy requirements, at 51 percent by 2030 (Coal, 45 percent and Natural gas, 6 percent) and 36 percent by 2047 (Coal, 30 percent and Natural gas, 6 percent) (see Table 4).
Fig. 6. Share of Fossil Fuels in Power Generation (2021 and 2047)


According to the India Energy Security Scenario 2047 (IESS 2047), an energy scenario modelling and simulation tool developed by NITI Aayog, the Power Generation Portfolio (PGP) under IESS determined effort scenario till 2047 are shown in Table 4. The national installed power generating capacity is expected to reach 1145GW in 2047.
Table 4. Power Generation Installed Capacity (2020-2047)

Source: India energy security scenario calculator 2047[20]
The efforts in the emission reduction undertaken for achieving cleaner generation include the deployment of renewable energy systems such as solar and wind, implementation of the supercritical, Integrated Gasification Combined Cycle (IGCC), and Carbon Capture and Sequestration (CCS) technologies in the coal-based power generation (see Fig. 7). They also involve the increased use of natural gas produced from the onshore and offshore unconventional hydrocarbons for gas-based power generation.
Fig. 7. GHG Emission Reduction in the Power Generation Sector

Source: Hydrocarbon Resources in India’s Energy Security and Climate Goals[21]
Each of these elements in GHG emission control are discussed in turn in the following paragraphs.
India hosts approximately 66.8 billion tons of coal, which is nearly 7 percent of the global reserves of the resource. With the present domestic rate of coal production at around 0.6 billion tons per year, the reserve can last for more than a century. Considering the abundance of resource and its affordability in India and in Southeast Asia, the coal-fired power generation policies of India are enacted considering trade-offs in the future coal usage, resulting GHG emissions, and import expenditure. Other considerations include import stability, use of appropriate techno-economic emission reduction technologies, increased domestic coal mining, limitations of domestic coal in terms of calorific value, the benefaction needs, and the lack of technologies for deep underground mining. In order to engage foreign collaboration, the government is inviting foreign direct investments (FDI) in the coal mining sector.[22]
The coal-based power generation capacity in India is projected to reach some 380GW by the year 2047 with the commercialisation of IGCC (see Fig. 8) in 2027. The IGCC is expected to contribute 50 percent of the capacity added during the period 2042–47, and the share of the supercritical plants is expected to be at 55 percent in 2047.[23] Although the net-generation efficiency of the IGCC is far higher than that of supercritical and subcritical power plants, a crucial challenge is the reduction in energy efficiency during the lifecycle due to higher plant auxiliary power. The challenges are expected to be overcome by the higher economies of scale, use of higher temperature gas turbines, and by precise measurement of the gasifier temperature.[24]
The Carbon Capture and Sequestration (CCS) technologies reduce the amount of CO2 released into the atmosphere from the power plants by capturing the CO2 and storing them permanently in underground or marine formations. CCS is expected to provide a near-term pathway to rapidly reduce the impacts of existing emissions-intensive infrastructure and processes, while zero-carbon alternative solutions mature.
According to the International Energy Agency (IEA), the mass CO2 captured globally will increase from 40 million tons per annum (MTPA) in 2022 to 5635 MPTA by 2050. The contribution of various technologies to Certified Emission Reduction (CER) of approximately 750Gt by 2050 (see Fig. 8) indicate that CCS could contribute to 13 percent of the CER, of which CCS contribution to power generation and industry is 62 Gt and 33 Gt, respectively.[25]
Fig. 8. Expected Contribution of CCS in Various Sectors

Source: Global CCS Institute Report[26]
Indeed, CCS is considered an essential technology for the global effort to achieve net-zero GHG emissions by 2050. CCS can reduce emissions across most industry sectors directly, both as a retrofit technology for existing industrial and energy facilities, as well as being incorporated into new developments. The interest in the CCS and the technical readiness of the countries with the highest energy consumption are mapped in Figure 9.[27]
Fig. 9. Interest and Readiness of CCS, Select Countries

Source: Global CCS Institute Report[28]
Globally, the development of technology for removing CO2 from large point sources that satisfy requirements of safety, efficiency, and economy are in the advanced stages. In India, there are 105Gt of CO2 storage capacities in deep saline aquifers, 360Gt in deep waters, and 200Gt in the basalt formations. Despite its lower costs, globally onshore storage of CO2 in geological structures has received public opposition owing to perceived health risks from leaks, effects on local geology, as well as a resistance to what may be seen as waste disposal. Therefore, many countries are opting to explore offshore storage.
Current research also suggests that the probability of CO2 leaks from offshore CCS schemes in shelf sea waters is low. If they do occur, their spatial scale of impact is small, and the potential environmental impact is low, too. Although the direct impact on local communities is not a principal concern for offshore CCS schemes, public perception should be considered when developing offshore CCS. Such public acceptance (of both offshore and onshore CCS) depends on the scientific evidence presented to the public and the trust they have in the regulatory bodies. There is a need, therefore, for national marine monitoring and management agencies to have a sound scientific understanding of the entire system related to CCS.
According to the IESS-determined effort scenario, India should realise approximately 1 GW of CCS-based power generation capacity by 2022, and 35 GW by 2047. With the contribution of clean coal-based technologies, the overall efficiency of the national coal-based electricity generation could reach approximately 38 percent by 2047, with a further increase as the subcritical plants are retired after 2030 in a phased manner.
Electricity generation from coal-fired plants in India faces manifold challenges, including their aging infrastructure,[d] sub-critical technologies with operating efficiencies of < 34 percent,[e] and the geographical mismatch between the coal mines and the power generating plants.[f] There are other issues, too: lack of technology for mining deep coal reserves, the ecological impacts of open cast mining, a lower calorific value of domestically mined coal,[g] beneficiation needs for domestically mined coal, and the unavailability of CCS due to the socio-ecological implications of safe storage.
Fig. 10. Coal Import Dependence: Normal (blue line) and Determined Efforts (red line)
Source: Ministry of Mines
The coal import dependence calculated during normal and determined efforts scenarios using IESS are shown in Figure 10. It indicates that coal imports continue to be in the uptrend and are projected to reach 58 percent in 2047. With the objective of encouraging cleaner production from coal-based generation and to mobilise funds for supporting the renewable energy developments through the National Clean Energy and Environment Fund (NCEEF), the coal CESS has been increased from US$0.8/ton in 2010 to US$1.6 in 2015, US$3.2 in 2016 and US$ 5.7 under the new taxation law enacted in 2017. As of 2017, the clean energy CESS translates to a carbon price of nearly US$4 per ton CO2 levied at the point of power production. The revenue collected in the form of clean energy CESS on coal production between 2010 and 2018 was US$12 billion.[29]
From the IESS, if the new CESS regime is maintained, it is expected to generate US$373 billion till 2047 (from 31 billion tons of coal imports and 25 billion tons of local production). At present, India imports coal from Australia, Indonesia, South Africa, and the United States. In order to ensure consistent supply during disruptions caused by geopolitical events, subsequent to acquisition of an exploratory coal block in Mozambique, Coal India is also looking for stakes in the operational coking coal mines in Russia, Canada and Australia by using internal accruals to finance such acquisitions.[30]
Natural gas (NG) is the most environment-friendly combustible hydrocarbon resource, which helps bridge the deployment delays in the renewable energy sector. The sedimentary basins in India contain approximately 1.24 trillion m3 (TCM) of technically recoverable NG. The quantity is only 0.1 percent of the global NG reserves. At present, some 30 percent of the domestic NG production is from onshore fields and 70 percent from offshore. During 2018-19 and 19-20, the domestic NG production was 33 billion and 31 billion m3 (BCM), respectively. During the same period imports were 20 and 34 BCM, respectively, which were 47 percent and 53 percent of the NG demand.[31] More than 40 percent of the NG imports were from Qatar in the form of liquefied natural gas (LNG) shipped through LNG carriers. The imported LNG are handled through six LNG terminals with the total capacity of 42.5 Million Ton Per Annum (MTPA). The Dahej terminal in Gujarat has the capacity of 17.5MTPA with a capacity utilisation of 70 percent. For facilitating the transfer of LNG, the NG pipeline network is 17,000 km, handling 360 million m3 /day.[32]
In order to meet the widening demand-supply gap, India has planned to increase NG imports through cross-border pipelines.[h] The projects, if realised, could together deliver approximately 59 BCM of NG annually to India. The Turkmenistan-Afghanistan-Pakistan-India (TAPI) alone could save US$0.25 billion annually by avoiding the use of the LNG carriers.[33] Taking into account the geopolitics involved in realising the cross-border pipelines, ensuring supply of NG during geopolitical disruptions and refraining from paying higher spot prices, India needs to follow import diversification strategies. Following the eruption of the Russia-Ukraine conflict, the share of India’s crude imports from Russia increased from 1 percent to 18 percent.[34]
Understanding the importance of realising an NG-based economy, India needs to lay the foundations for the import of NG from countries with well-established markets such as the United States, Qatar, Russia and Australia, as well as the emerging markets in gas-endowed countries in Africa, West Asia, Southeast Asia, and the Gulf. Indian oil and gas companies are involved in the joint development of gas resources in Mozambique’s Offshore Area 1, an offshore block where there are some 75 trillion cubic feet of recoverable NG reserves.[35]
In the unconventional hydrocarbon segment, India hosts some 4 TCM of coal bed methane, 2.7TCM of shale gas, and 1,874 TCM of gas hydrate in the offshore continental margins.[36] During the period April-June 2020, approximately 153 million m3 of CBM were produced. Two shale wells have been drilled to depths up to1,300m in the Cambay basin, which produced 0.3 and 0.9 million m3/day, respectively.[37] The exploitation of shale gas could be subjected to close scrutiny due to heightened public activism, strong judicial supervision, and issues of scarcity in land and water.[38]
In the marine gas hydrate segment, the National Gas Hydrate Program (NGHP), spearheaded by the Directorate General of Hydrocarbons (DGH) and the Oil and Natural Gas Corporation (ONGC) carried out detailed offshore surveys by drilling some 80 wells in water depths ranging from 900 to 3,000m in the Krishna-Godavari (KG), Mahanadi and Andaman regions. The mammoth efforts confirmed the presence of large quantities of highly saturated gas hydrate accumulations in the KG basin. The Council for Scientific and Industrial Research-National Institute of Oceanography (CSIR-NIO) and CSIR-National Geophysical Research Institute (CSIR-NGRI) are pursuing activities towards delineation and resource estimation at prospective targets. The Ministry of Petroleum and Natural Gas (MoPNG) has planned to establish a pilot production well to ascertain the techno-economic viability of the reserves. For carrying out ground-truthing and spatial quantification of the resource, the Ministry of Earth Sciences-National Institute of Ocean Technology (MoES-NIOT) have developed exploration tools such as deep-water electric work-class remotely operated vehicle (ROV) ROSUB6000 with suitable scientific payloads and a ground-truth validation tool in the form of wire-line autonomous coring system.[i]
Reservoir-specific production strategies are to be analysed by taking into account the petro-physical properties, technological feasibility, production economics, and environmental considerations. Results from the gas hydrate reservoir production modelling and simulator IndHyd 1.1 developed by MoES-NIOT[39],[40] indicate that a gas hydrates production field development with a minimum of 40 networked wells in the Krishna Godavari (KG) basin location could be economically feasible with the current prices of Indian natural gas imports. The same study recommends the establishment of a test production well in the KG basin in the identified prospective locations to ascertain the field-specific variants that influence the productivity.[j] The study stresses the need for development of technologies for realising horizontal wells in gas hydrate reservoirs to achieve higher well reach, high capacity subsea-based pumps, subsea produced water processing, subsea gas-water separation, and subsea gas boosting systems. The economics of methane gas produced from the gas hydrate should not be compared with the natural gas import prices, as the capacity development in utilising the domestic resource could reduce the production cost in the long term and helps to achieve import reduction. Therefore, special tariffs and tax considerations could help in bringing marine methane hydrate as a significant source of natural gas in energy portfolio.
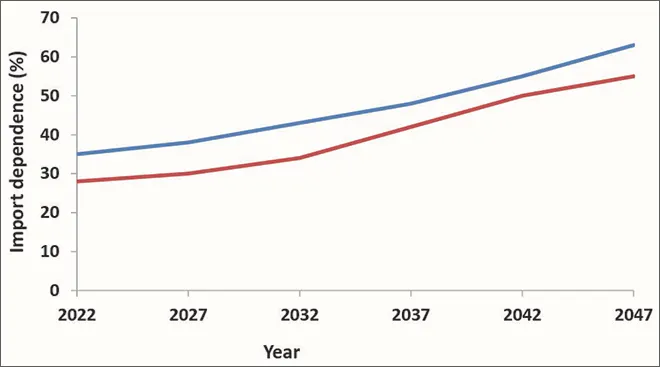
The production of NG from these domestic hydrocarbon resources is essential considering the technical and geo-political challenges in realising trans-national gas pipelines. By 2047, 10 percent of NG reserves are expected to be produced from these domestic unconventional hydrocarbon resources.[41] The advantages of the increased NG production is analysed using IESS and the results (see Table 5 and Figure 11) indicate that if 224 BCM of natural gas (with a corresponding NG production growth rate of 12 percent) is domestically produced by 2047, the country shall achieve NG import dependence and further domestic production will make India a net exporter of natural gas.
Table 5. NG Production: Scenarios and Advantages

Source: Author’s own
Fig. 11. Import Dependence with Increased NG Production (2020-2047)

Source: Author’s own
The growth of the RE generation capacity in India under IESS-determined effort scenario is shown in Figure 12. It is estimated that the onshore wind energy potential in India is approximately 300GW, spread across the states of Tamil Nadu, Gujarat, Karnataka, Maharashtra, and Rajasthan.[42] India has an offshore wind energy potential of approximately 70 GW, distributed mainly along parts of the coast of Gujarat and Tamil Nadu. The Ministry of New and Renewable Energy (MNRE) has formulated a national policy for offshore wind and is working towards the establishment of offshore wind projects in Tamil Nadu and Gujarat where offshore blocks have been delineated. The National Offshore Wind Energy Authority is carrying out a survey for identifying potential locations in the Exclusive Economic Zone (EEZ) of India for power generation. The MoES-NIOT and MNRE-National Institute of Wind Energy in the Gulf of Kutch and Gulf of Khambhat have installed LIDAR-based collection platforms to measure wind speed, direction, temperature and humidity at 10 m elevation from sea level. Studies on commercial viability are being undertaken for turbines of 3MW capacity.[43]
Fig. 12. Determined Growth of RE Capacity (2020-2047)

Source: India energy security scenario calculator 2047[44]
Meanwhile, the solar power generation potential is estimated to be approximately 756GW, with a direct normal irradiance threshold of 1,809 kWh/m2 and 229GW with a threshold of 2,000 kWh/m2.[45] With the global growth in the installed solar generation capacity and the associated mass manufacturing of solar power generation components, the cost of Photo-Voltaic (PV) modules reduces by about 20 percent with every doubling of global capacity—this is a favorable situation for the growth of solar power installations in India. The technological growth (see Fig. 13) has resulted in the doubling of the PV cell conversion efficiencies from 25 to 50 percent over the past four decades.[46]
Fig. 13. Technological Trends in Photovoltaic Cells

Source: Photovoltaic Research[47]
The advantages of accelerating the growth of the solar power installations computed based on IESS are shown in Table 6. A solar capacity addition at the rate of 8GW/year could reduce India’s hydrocarbon imports by 54 percent by 2047.[48]
Table 6. Solar Energy Capacity: Growth Scenarios and Advantages
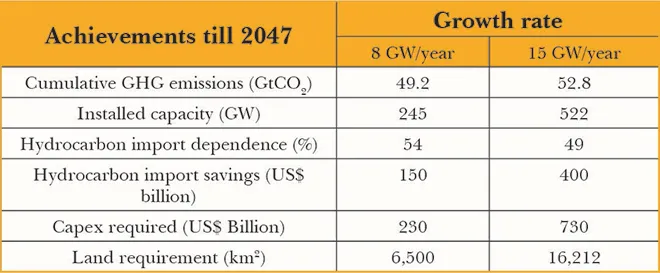
Source: The Electricity Journal [49]
The US$ 2-billion Green Energy Corridor Project for evacuating the power produced from 20GW of large-scale RE projects involving 9,400 circuit-kilometers (ckm) of intra-state transmission lines and substations of 19,000 MVA capacities are under progress.[50] The role of the RE in the GHG emission reduction till 2047, computed using IESS, is shown in Fig. 14, and the investments planned in the hydrocarbon and RE sectors are shown in Fig. 15. The PGP shall help to achieve a cumulative GHG emission reduction of 24 GtCO2 and hydrocarbon import reduction by US$ 0.7 trillion till 2047, compared to the business-as-usual scenario. The transformation will require a capital outlay of US$1.2 trillion and 34,000 km2 of land area for the conventional and RE energy sectors. The cumulative GHG emission reduction in the clean coal-based power generation till 2047 under determined effort scenario is approximately 3.2 GtCO2 compared to normal scenario.
In order to accelerate the growth of RE, the Indian Renewable Energy Development Agency (IREDA) utilises a part of the NCEEF to lend to banks at a 2-percent interest rate, which is further loaned out for RE projects at concessional interest rates.[51] In the solar energy segment, the domestic manufacturers do not have the capacity to meet an increased demand for solar panels, and so almost 90 percent of India’s solar panel needs continue to be met by imports.[52] This has a significant impact on the profit margins and confidence levels of developers and investors. Many solar projects are based on thin-film technologies which increases the dependence on specific metals mined in only a few geographical locations outside India—this creates import dependency and bottlenecks in supply of raw materials essential for development of a robust domestic manufacturing base for solar cells in India.[53] Regarding cadmium telluride thin-film modules, the production and disposal stages could cause environmental pollution, warranting comprehensive end-of-life management legislation for PV modules. A favourable tax regime will therefore favour the investment ecosystem, as will adequate debt financing, policies to boost the domestic production of RE systems, and appropriate regulatory policies.
Fig. 14. Contribution of RE in Cumulative GHG Reduction by 2047

Source: The Electricity Journal [54]
Fig. 15. Cumulative Investment Share in Generation, by Sector (2047)

Source: The Electricity Journal [55]
Under the scenario determined by the IESS, by the year 2047, nuclear and hydro plants shall contribute to 3 percent and 10 percent, respectively, of the national installed generation capacity. The growth of nuclear-based power generation will be slow due to various reasons: huge upfront capital investments, cost escalations, long lead time for construction, safety elements, nuclear fuel availability in India, varied perceptions and approaches on the part of potential nuclear fuel-exporting countries, issues on nuclear waste disposal and land acquisition, and prevailing anti-nuclear sentiments. The sector therefore requires significant government involvement. The government is yet to calm public anxiety on nuclear energy expansion, which is only likely to aggravate if a credible, sustainable and impactful strategy for nuclear education is not formulated.
Hydropower, for its part, is only partially being tapped at present from the rivers of the Indian Himalaya, where steep river gradients in combination with high seasonal run-off rates provide ideal conditions for hydropower generation. Hydropower projects are more than engineering ventures, however, and have large-scale socio-economic and environmental implications. To begin with, land acquisition is an elaborate process requiring numerous clearances from the forest department.[56] These plants also often encounter geological “surprises” during construction. Resettlement and rehabilitation issues during the realization are not only sensitive, but also entail substantial cost, which are not anticipated during proposal stages—these factors lead to time and cost over-runs. Although India ranks sixth in the world in terms of hydropower resources with an estimated 150 GW from large hydro power resources, slow expansion targets are planned amidst the social, economic, financial and ecological impacts of these plants.
Adequate energy storage is essential for the Indian power grid.[k], The incorporation of the upcoming stochastic distributed RE resources and Electric Vehicle (EV) charging infrastructure of varying capacities will likely introduce instabilities in the power grid. These instabilities need to be mitigated using adequate electrical energy storage (EES) systems such as batteries and pumped hydro storage (PHS) systems. The share of the energy storage requirements in India in various stationary and mobility sectors in 2022 and 2032 are shown in Table 7. By 2047, the electrochemical-based EES requirements for grid support will reach 120GWh.[57]
Table 7. EC ESS Installed Capacity

Source: Indian Energy storage alliance [58]
The cumulative capital cost requirements for realising the EC-based ESS for the power grid support applications is computed based on IESS 2047 simulations and the capital cost model for various battery chemistries provided by the World Energy Council (see Figure 16).[59] The results indicate that Li-Ion and Na-S chemistries will be cost-effective in the EC segment in the long term. In India, about 10MWh of Li-battery-based energy storage is operational in the North Delhi substation and 50MWh capacity is expected to get online by early 2023.
Fig. 16. Comparative Investments in EC-Based Storage

Source: The Electricity Journal [60]
The comparative capital investment requirement in the EC-based energy storage capacity till 2047 is shown in Figure 16.[61] The electricity generation sector requires a cumulative capital outlay of approximately US$200 billion in the PHS and US$80 billion in the electrochemical-based systems through to 2047 to achieve improved power quality and grid reliability.[l] Among the various chemistries, Li-ion has a dominant position in China, while Na-S batteries are dominant globally, including in Japan. The growing and sustained interest in lithium chemistry in China is due to the high amount of domestically available reserves. Driven by the demand for lithium batteries, the cost of lithium has more than tripled since January 2015. The strategic investments of high-lithium demand countries in lithium mining operations domestically and globally is expected to have an impact on the pricing and competition in the fast-emerging battery sector. Thus, it is understood that the strategies of various countries are inextricable from storage capacity requirements, raw material availability, subsidies, regulatory mechanisms, and research investments.
To meet the emission targets by 2030, the Indian electricity and transportation sectors together require some 1,650GWh of lithium battery-based energy storage between 2020 and 2030. By 2030, with the present EV policies in place, the projected share of the EV in China, Japan, US, Canada and global aggregate shall be 50, 37, 30, 30 and 22 percent, respectively.
Table 8. Electric Mobility, Select Countries

Note: Top five countries where EV growth is predominant
Source: Iscience[62]
In India, the national e-mobility programme targets increased penetration of EV with due consideration of the planned economic development, domestic battery manufacturing capabilities, and grid charging infrastructure. The grid battery charging infrastructure will decide the success of the EV transition.
A key driver for the EV adoption in India is the US$14-billion Faster Adoption and Manufacturing of Electric Vehicles (FAME II) scheme which allocates US$135 million for establishing charging infrastructure with 2,636 EV charging stations across 62 cities in 24 states and Union Territories. The first phase focuses on megacities and national highways with one public charging station every 3×3 km grid or 100km in national highways. Many Indian states are also complementing EV charging infrastructure efforts by designing policies to meet their local charging requirements. The GST council has offered tax reduction for EV from 18 percent to 5 percent for the charging stations.
According to IESS 2047 simulations, the grid-supported charging infrastructure will be able to support about 10 percent of on-road vehicles with approximately 140 TWh of energy by 2030, and 33 percent by 2047 with 280 TWh of energy. The grid-supported EV transformation helps to achieve cumulative crude oil import savings of US$ 150 billion and US$530 billion by 2030 and 2047, respectively. It will also reduce CO2emissions from the road transportation sector cumulatively by 1Gt and 5.5Gt, in 2030 and 2047, respectively (see Figure 17). It will be essential to develop an EV charging infrastructure readiness plan that addresses near-, mid-, and long-term planning horizons in an integrated way and considers growing penetration of renewable generation, smart meters, demand response, energy efficiency, time-of-day tariffs, and increased wholesale market participation.
Fig. 17. Role of Grid-Based EV Battery Charging Infrastructure

Source: India energy security scenario calculator 2047[63]
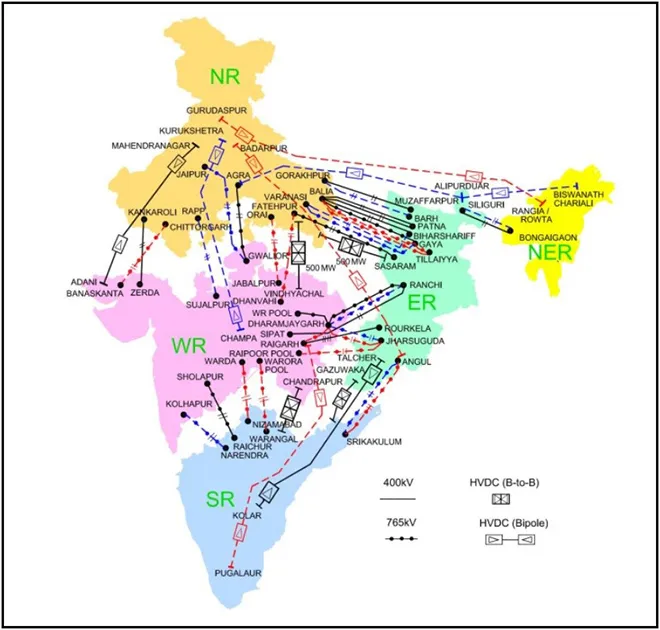
The Indian high voltage power transmission system handles approximately 750,000 MVA spanning some 370,000 circuit kilometres (ckm).[m] The five sub-grids in India and the interconnections are shown in Figure 18. Although the frequency response characteristics (FRC) of the all-India grid has improved from 6 to 9GW/Hz over the last few years, the stability and reliability is still lower than the comparable grid sizes in which FRC is of the order of 20GW/Hz. Moreover, the national transmission and the distribution losses (T&D) is 22 percent, which is significantly higher than that of China or the US at less than 6 percent. Therefore, modern technologies and improved governance is required for increasing the grid reliability and to reduce the T&D losses.
Fig. 18. Power Grid of India: Interconnections[64]
Smart Grids (SG) enable precise and wider observability, controllability, self-diagnosis and self-healing capabilities by seamless integration of Advanced Metering Infrastructure (AMI) using Information & Communication Networks and Internet of things (IoT), leading to an effective distributed management system (Fig.19).
Fig. 19. Advantages of Smart Grid

One of the important subsystems of an SG is the Phasor Measurement Units (PMU) that makes high speed measurement of the instantaneous power system parameters at identified nodal locations in the transmission system with GPS time-stamp for time-synchronisation. When the measurement is time-stamped it is called synchro-phasor. The PMU sends data through the communication network to the Phasor Data Concentrators, which collects, time-aligns and checks the data quality before sending them for processing real-time decisions. The PMU provides data for the wide area real-time grid visibility enabling oscillation detection, frequency stability monitoring, voltage stability monitoring disturbance detection, resource integration, state estimation, congestion management, islanding and rapid restoration, which are essential for improving the grid reliability.[65]
India’s power sector requires effective implementation of the SG for supporting effective bi-directional power flow in the DER based on the distributed and automated features permitting real-time balancing of demand and supply through distributed and high-speed computing and communication for efficient, reliable, safer, economical and cleaner production and distribution of energy. The availability of the high frequency grid information enables stability improvements of mini and micro-grid-connected stochastic DER comprising the captive generators, wind generator, PV arrays and battery-fed systems by implementing efficient fault-ride through algorithms.[66] They are essential for reliable integration of the distributed EV charging infrastructure which shall reach 250GWh by 2047. The transparency and the information availability enables prosumer approach by realising dynamic tariff structures based on frequency-based, time-based and historical peak loads.
The currently operating metering and Supervisory Control and Data Acquisition (SCADA) systems in India has an update rate of ~5s, which is insufficient for implementing SG. Under the Indian National Smart Grid Mission, 12 SG demonstration pilot projects involving US$30 million are undertaken in the regional grids. The North Delhi Power Limited involving private participation is the earliest adopter of the SG approach. The Power System Operation Corporation Limited (POSOCO) is implementing various projects on Wide Area Management System and Control (WAMCPS) using synchro-phasors at transmission level in which 60PMU are operational. Under the Unified Real Time Dynamic State Measurement (URTDSM) Project, the Power grid is installing 1,700PMU covering networks >400kV for enhanced dynamic security monitoring and visualisation of the overall network at 356 substations with 34 control centres. The pilot scale demonstration of the CS-DR approach is presently undertaken in the northern New Delhi region involving 167 buildings with peak loads >25 MW.[67]
As a part of the AMI program, efforts are underway for installing 38 million smart meters (against the present 0.5 million). This is the first step in SG realization and could put India on par with the developed economies where China, Europe, and the US have already installed ~350, 155 and 59 million smart meters, respectively.[68] The ICT systems are to be enhanced for effective implementation of the SG. Based on the experiences from the SG infrastructure standardisation adopted by advanced countries (Table 9), shows the ICT and AMI requirements for achieving a SG reliability of >98%. The investment requirements in realising smart grid and associated transmission and distribution networks, resulting hydrocarbon imports reduction and GHG emission reduction, analysed using IESS 2047 are summarised in Table 10.
Table 9. Requirements for Smart Grid[69]

Table 10. Investment Requirements (in US$ billion, till 2047)

Source: India energy security scenario calculator 2047[70]
To achieve the transition involving capital investments of US$ 1.2 trillion and GHG emission reduction of 24Gt CO2by 2047, India’s power sector should create a favourable ecosystem for developing in-house technologies for the effective utilisation of the abundantly available domestic renewable and hydrocarbons, efficient carbon capture, and safe carbon sequestration.
Even with the determined implementation of the energy policies, hydrocarbons will continue to contribute up to only 37 percent of the national power generation capacity by 2047, resulting in higher hydrocarbon imports. With coal being a primary contributor to India’s power sector, and as most countries have begun the phase-out of coal-based power generation, India must look to acquire stakes in the operational coking coal mines in countries like Russia, Canada, and Australia. Increased investments in the acquisition of overseas assets during the present period of low hydrocarbon prices and reduced national import expenditure are justified.
Although India’s conventional natural gas reserves are not adequate, in the unconventional hydrocarbon segment, Indian offshore is endowed with huge quantities of gas hydrates. Technologies for the commercial production of gas hydrates are, however, in the infancy stage, and site-specific technologies have to be developed for producing methane gas from the gas hydrate reservoirs in an eco-friendly manner. This presents a good opportunity to reduce natural gas imports, bridge delays in the renewable energy system deployment, and offset emissions from coal-based power generation. Further, increased production could transform India as a net exporter of natural gas, the way shale gas is for the United States.
In the renewable energy sector, efforts are underway in the effective exploitation of the abundant solar energy resource. Meanwhile, India continues to depend on the imports of solar panels due to the dependence on specific metals mined in only a few geographical locations outside India.[n] A feasibility study made for the Government of India indicates that for a Li-Ion battery production plant of 5 GWh/year capacity established in India with 66 percent of the battery cost towards raw materials, the battery production cost shall be US$ 148/kWh. The production facility requires an investment of US$ 5 billion and an establishment time of three years. The battery production cost is reported to be as low as US$ 84 for a manufacturing capacity of 200GWh/year, indicating the economies of scale. Thus, reduced domestic availability of lithium and solar panel thin-film manufacturing resources create import dependency and bottlenecks in the supply of raw materials essential for the development of a robust domestic manufacturing base for solar cells and lithium batteries. The acquisition of coal fields, lithium and solar film metal assets abroad are essential for ensuring their consistent supply during geo-political disruptions.
With respect to e-mobility, in addition to production of reliable and safe lithium batteries, the rate of growth of the grid-based EV-battery charging infrastructure with on-the-go charging capability will decide the success of the transition. At the same time, a smooth transition with minimal impact on the present legacy internal combustion-based supply chain is required from the perspectives of economics and job creation. While sustained implementation of the smart grid technologies should help to improve the efficiency and reliability of the power system, the strategic smart grids require implementation of artificial intelligence-based techniques for achieving distributed, cooperative, self-organising and self-healing capabilities. Significant enhancement in the infrastructure and standardisation is required for increasing the grid observability and control for achieving higher reliability.
The Strategies, Trends and Activities on Jointly Identified Research Topics (START) of global Mission Innovation Initiative involving 23 countries and the EU, in which India is an active member, is expected to open new horizons in the strategic clean energy and smart grid technologies. Considering the challenges in mobilising the massive US$ 1.3 trillion required for the clean and reliable transition, India has highlighted in COP26 the need for accelerated transfer of climate finance and low-cost climate technologies for developing countries for the implementation of time-bound climate actions. Thus, a clear sustainability vision with appropriate technological, institutional and policy framework for a robust investment ecosystem is essential to achieve targets.
[a] These bodies include the Subsidiary Body for Scientific and Technological Advice (SBSTA) and the Subsidiary Body for Implementation (SBI).
[b] Odisha (then Orissa) was among the first states to create such a commission, in 1995.
[c] This means ensuring electricity access to 580 million people by that time.
[d]40 percent of the plants are 25–40 years old.
[e]Supercritical plants are 41-percent efficient; ultra-supercritical, 43 percent; and IGCC plants, 42 percent.
[f]This means every ton of coal needs to travel about 500 km by rail before getting converted into electricity.
[g]At 4,500 compared to 6,000 kCal/kg for imported varieties.
[h]These include the Iran-Pakistan-India (IPI), Turkmenistan-Afghanistan-Pakistan-India (TAPI), and the Myanmar-Bangladesh-India (MBI) pipeline projects which combined are worth US$16.5 billion.
[i] Globally, the recovery of methane from natural gas hydrates is a scientific and technological challenge, and much remains to be understood on the geologic, engineering and the economic factors controlling the ultimate recovery of the deep-seated resource.
[j] These include reservoir heterogeneity, structural and lithological complexity, hydraulic isolation, and geo-mechanical effects.
[k] It is essential the effective management of the power demand shifts, peak reductions, frequency regulation, voltage support, integration of the stochastic resources and the electric vehicle (EV) battery charging infrastructure, spinning reserve management, arbitrage and to defer investments in the power handling infrastructure.
[l] Globally, the Na-S, Li-ion, lead acid, Ni-Cd and flow chemistries share 59%, 21%, 13%, 5% and 2% of electrochemical-based energy storage capacities, respectively. In China, Li-ion, lead acid and flow batteries share 74%, 17% and 9%, respectively. In Japan, Na-S, Li-ion flow and lead acid batteries share 48%, 38%, 8% and 4%, respectively.
[m] The 220kV, 400kV, 765kV and HVDC links cover 9,43,44, and 4% of the distances, respectively.
[n] Lithium is the main metal used for the manufacturing Lithium batteries mainly for improving the reliability and stability of the power grids. Out of the 62 Million Tons of the global Lithium resources, US, Argentina, Bolivia, Australia, Chile and China host 11, 24, 15, 12,14 and 7% of the resources, respectively, whereas other countries host the remaining 17%.
[1] M Joshi and Chen Han, “The Road from Paris: India’s Progress Towards its Climate Pledge“.
[2] Yamide Dagnet, et al., “Setting the Paris Agreement in motion: key requirements for the implementing guidelines.” (2018).
[3]“Clean energy investments,” World Economic Forum, June 16, 2020.
[4]United Nations Climate Action, “COP26: Together for our Planet”.
[5] R. Samans, “Globalization 4.0: Shaping a new global architecture in the age of the Fourth Industrial Revolution: A call for engagement,” in World Economic Forum, pp. 1-40. 2019.
[6]“India energy security scenario calculator,”
[7] Vasant Surdeo, “Power sector policies in India: History and evolution,” Jindal Journal of Public Policy 3, no. 1 (2017): 115-129.
[8] Sanjeev Ahuluwalia, “National Electricity Policy 2021: Making India’s Power Sector Future-Ready,” ORF Special Report no. 140, Observer Research Foundation, 2021.
[9] Kapil Subramanian, “Is India on track to meet its Paris commitments?” 2019.
[10] OXFAM International, “Carbon Emissions of Richest 1 Percent More Than Double the Emissions of the Poorest Half of Humanity,” September 21, 2020.
[11] Jemyung Lee, et al., “The Scale and Drivers of Carbon Footprints in Households, Cities and Regions Across India,” Global Environmental Change 66 (2021): 102205.
[12] N Vedachalam, et al., “An Assessment of Decarbonization in the Strategic Indian Electricity Generation Sector,” The Electricity Journal 30, no. 5 (2017): 47-53.
[13] U.S. Energy Information Administration, “International Energy Outlook 2021,” October 6, 2021.
[14] Central Electricity Authority, “Executive Summary of Indian Power Sector,” March 2019, Ministry of Power, Govt. of India. File No. CEA-CH-14-11/4/2018-Coordination Division.
[15] Central Electricity Authority. “Executive summary of Indian power sector”
[16] United Nations Climate Action, “COP26: Together for our Planet”.
[17] International Energy Agency: Coal Energy Center, “CIL Identifies Seven Coking Coal Mines in Australia for Acquisition,” March 2018.
[18] “India energy security scenario calculator”
[19] “India energy security scenario calculator”
[20] “India energy security scenario calculator”
[21] N Vedachalam, et al., “Review on the Role of Hydrocarbon Resources in India’s Energy Security and Climate Goals,” Journal of the Geological Society of India 95, no. 6 (2020): 561-565
[22] Ministry of Mines, Govt. of India, “FDI in the coal mining sector in India,” 2020.
[23] “India energy security scenario calculator”
[24] Yabo Wang, et al., “Life Cycle Analysis of Integrated Gasification Combined Cycle Power Generation in the Context of Southeast Asia,” Energies 11, no. 6 (2018): 1587.
[25] I. Havercroft and Christopher Consoli, “Is the World Ready for Carbon Capture and Storage?” Global CCS Institute Report (2018).
[26] Havercroft and Consoli, “Is the World Ready for Carbon Capture and Storage?”
[27] Havercroft and Consoli, “Is the World Ready for Carbon Capture and Storage?”
[28] Havercroft and Consoli, “Is the World Ready for Carbon Capture and Storage?”
[29] International Institute of Sustainable Development, “The Evolution of Clean Energy Cess on Coal Production in India”.
[30] International Energy Agency: Coal Energy Center, “CIL Identifies Seven Coking Coal Mines in Australia for Acquisition”
[31] Ministry of Petroleum and Natural Gas, Annual Report 2020-21.
[32] Ministry of Petroleum and Natural Gas, “Natural Gas Pipelines in India,” 2019.
[33] Hippu Nathan, et al., “Pipeline Politics—A Study of India’s Proposed Cross-Border Gas Projects,” Energy Policy 62 (2013): 145-156.
[34] Fortune India, “Russia Now Accounts for 18% of India’s Crude Imports; Up from 1%,” June 30, 2022.
[35] Oil India Limited, Conquering New Horizons, “Joint Venture Partners of Mozambique Rovuma Offshore Area 1 announces Final Investment Decision for initial two LNG train Project Development,” June 18, 2019.
[36] N Vedachalam, et al., “Review of Unconventional Hydrocarbon Resources in Major Energy Consuming Countries and Efforts in Realizing Natural Gas Hydrates as a Future Source of Energy,” Journal of Natural Gas Science and Engineering 26 (2015): 163-175.
[37] Directorate General of Hydrocarbons, “Coal Bed Methane”.
[38] Anil Kumar Jain, N.I.T.I. Aayog, and Rajnath Ram, “Shale Gas in India: Challenges and Prospects,” 2016.
[39] N. Vedachalam, M. Ravindran, and M.A. Atmanand, “Technology Developments for the Strategic Indian Blue Economy,” Marine Georesources & Geotechnology 37, no. 7 (2019): 828-844.
[40] N Vedachalam, et al., “Techno-Economic Viability Studies on Methane Gas Production from Gas Hydrates Reservoir in the Krishna-Godavari Basin, East Coast of India,” Journal of Natural Gas Science and Engineering 77 (2020): 103253.
[41] “India energy security scenario calculator”
[42] Indian Wind Energy: A Brief Outlook, 2018.
[43] Ministry of New and Renewable Energy, Offshore Wind, “National Offshore Wind and Energy Policy,” October 6, 2015.
[44] “India energy security scenario calculator”
[45] Chandan Sharma, et al., “Assessment of Solar Thermal Power Generation Potential in India,” Renewable and Sustainable Energy Review 42 (2015): 902-912.
[46] Photovoltaic Research, “Solar Cell Efficiency Trends”.
[47] Photovoltaic Research, “Solar Cell Efficiency Trends”
[48] N. Vedachalam, “Assessment of the Decarbonization Capabilities of Solar Energy in the Strategic Indian Electricity Generation Sector,” The Electricity Journal 31, no. 7 (2018): 20-25.
[49] Vedachalam, “Assessment of the Decarbonization Capabilities of Solar Energy in the Strategic Indian Electricity Generation Sector”
[50] Ministry of New and Renewable Energy, Green Energy Corridors, “Upcoming green energy corridors in India”.
[51] IREDA, Schemes for Renewable Energy Projects,
[52] Kanika Chawla, Manu Aggarwal, and Arjun Dutt, “Analysing the Falling Solar and Wind Tariffs: Evidence from India,” ADBI Working Paper 1078. Tokyo: Asian Development Bank Institute (2020).
[53] Leena Grandell and Mikael Höök, “Assessing Rare Metal Availability: Challenges for Solar Energy Technologies,” Sustainability 7, no. 9 (2015): 11818-11837.
[54] Vedachalam, “Assessment of the Decarbonization Capabilities of Solar Energy in the Strategic Indian Electricity Generation Sector”
[55] Vedachalam, “Assessment of the Decarbonization Capabilities of Solar Energy in the Strategic Indian Electricity Generation Sector”
[56] Lydia Powell, Akhilesh Sati, and Vinod Kumar Tomar, “Hydropower in India: Balancing Global Carbon Benefits with Local Environmental Costs,” ORF Expert Speak, February 2022.
[57] N. Vedachalam and M. A. Atmanand, “An Assessment of Energy Storage Requirements in the Strategic Indian Electricity Sector,” The Electricity Journal 31, no. 7 (2018): 26-32.
[58] Indian Energy Storage Alliance, Indian Smart Grid Forum, “Energy Storage System: Roadmap for India: 2019-2032,” October 8, 2020.
[59]World Energy Council, “World Energy Resources E-Storage 2018”.
[60] Vedachalam, “Assessment of the Decarbonization Capabilities of Solar Energy in the Strategic Indian Electricity Generation Sector”
[61] Felix Baumgarte, Gunther Glenk, and Alexander Rieger, “Business Models and Profitability of Energy Storage,” Iscience 23, no. 10 (2020): 101554.
[62] Baumgarte, Glenk, and Rieger, “Business Models and Profitability of Energy Storage”
[63] “India energy security scenario calculator”
[64] Power Grid Corporation of India Limited, “One Nation-One Grid”.
[65] A. Vaccaro, et al., “A Review of Enabling Methodologies for Information Processing in Smart Grids,” International Journal of Electrical Power & Energy Systems 107 (2019): 516-522.
[66] Naggar H. Saad, Ahmed A. El-Sattar, and Abd El-Aziz M. Mansour, “Improved Particle Swarm Optimization for Photovoltaic System Connected to the Grid with Low Voltage Ridethrough Capability,” Renewable Energy 85 (2016): 181-194.
[67]Department of Science and Technology, “India Country Report: Research, Development, Demonstration and Deployment of Smart Grids in India,” June 2017.
[68] Gailius J. Draugelis, et al., “Survey of International Experience in Advanced Metering Infrastructure and its Implementation,” 2018. License: CC BY 3.0 IGO.
[69] Nazmus S. Nafi, et al., “A Survey of Smart Grid Architectures, Applications, Benefits and Standardization,” Journal of Network and Computer Applications 76 (2016): 23-36.
[70] “India energy security scenario calculator”
The views expressed above belong to the author(s). ORF research and analyses now available on Telegram! Click here to access our curated content — blogs, longforms and interviews.

Dr. N. Vedachalam is Senior Scientist and Program Director at the National Institute of Ocean Technology an autonomous ocean research centre under the Ministry of ...
Read More +