-
CENTRES
Progammes & Centres
Location
 PDF Download
Nilanjan Ghosh and Debosmita Sarkar, Beyond Poverty Alleviation: Envisioning Inclusive Growth in the BRICS Countries, May 2023, Observer Research Foundation.
Introduction
The BRICS countries (Brazil, Russia, India, China and South Africa) account for almost 42 percent of the world’s population, and contribute to around 24 percent of the global gross domestic product (GDP) and 16 percent of global trade.[1] Since the inception of the BRICS forum in the early 2000s, these countries have witnessed rapid economic growth that is considerably higher compared to the Organization for Economic Co-operation and Development (OECD) countries; provided leadership to the emerging market economies (EMEs) and the developing world; and actively participated in shaping the global economic order.[2] China and India have led this phenomenal growth in the 2000-2021 period (recording average annual growth rates of about 8.6 percent and 6 percent, respectively), followed by the Russian Federation. Even the relatively slower growth rates of Brazil and South Africa are significantly higher than those of the OECD countries (see Figure 1). From the perspective of overall GDP growth and annual per capita GDP growth rates over the same period, all BRICS members, except South Africa, performed better than the OECD countries. This growth was primarily driven by private consumption in most BRICS states. Interestingly, even China, which relied largely on export-driven growth, had begun to acknowledge private consumption as the most significant growth driver in its recent plan documents.[3]
Figure 1: Average Annual GDP Growth Rates (in %, 2000-2021)
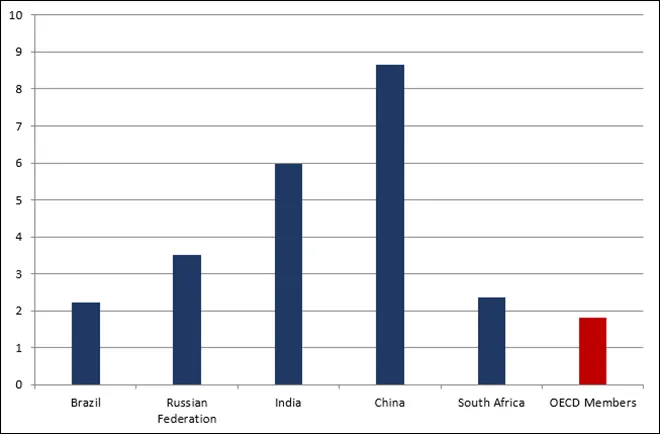
Source: Authors’ own, based on data from World Development Indicators
The rapid economic growth in these countries was also accompanied by considerable improvements in living standards and other indicators of development. Significant improvements in life expectancy at birth, educational attainment, and energy access and availability have been observed over the years. Despite these improvements, the BRICS countries lag behind the OECD members on almost all development indicators. Moreover, there are considerable disparities within the BRICS countries in terms of vast regional (urban-rural) and social divides (such as gender and race).[4],[5] While growth has marginally taken care of some developmental parameters, the inequities and social chasms indicate the existing concerns with distributive justice. This is particularly true for the most vulnerable populations in the BRICS countries. For instance, some sections of the population in the BRICS countries still do not have access to energy required to meet basic needs.[6] This not only contributes to crucial development challenges, but also hinders economic participation. Thus, to achieve sustainable growth and development, prioritising inclusivity is critical.
Figure 2: Development Indicators in BRICS and OECD (latest available)
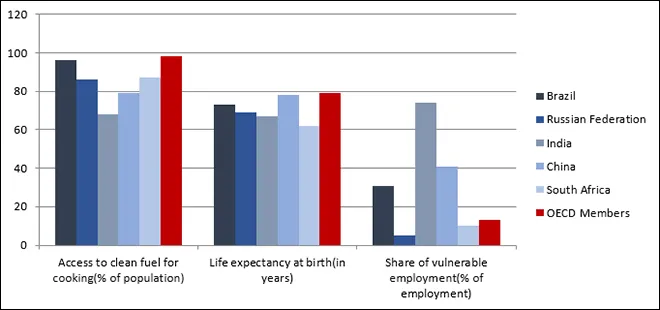
Source: Authors’ own, based on data from World Development Indicators
The OECD’s framework for inclusive growth delineates economic growth as entailing distributive justice for all sections of society. This implies that the fruits of economic growth should reach all and create economic and social opportunities.[7] Focusing on this idea of equity and distributive justice has led to a relative redistribution of its benefits to the most vulnerable populations across the world, resulting in a considerable decline in global extreme poverty over the last two decades. New and improved models have been developed that strive to ensure economic growth translates to improvements in lives and livelihoods. However, the same period has also witnessed rising income and wealth inequality levels. These factors act as disincentives for the communities and societies ‘left-behind’—and not necessarily ‘left-out’—to participate in the growth process by depriving them of a larger stake in the economic and social benefits of growth. Some estimates suggest that addressing gender inequality alone can add US$12 trillion to the global GDP by 2025.[8] As such, there is a need to ensure greater economic participation from these population shares so that the benefits of economic growth can flow to them more organic and equitably. Creating quality jobs and a ripe investment climate for small businesses, providing just governance and improvements in institutional quality, and other such efforts can feed into more cohesive societies that witness a convergence between economic prosperity and inclusion. In this aspect, inclusive growth entails progress along two key dimensions—equitable and greater participation of the most vulnerable societies/communities in driving economic growth; and ensuring that the benefits of economic growth flow to the bottom half of the population more organically by giving them a larger stake in the growth process.
Poverty (both absolute and relative) has long been a major concern for the BRICS countries. All member countries, except Russia, had large shares of populations living under absolute or extreme poverty at some point in their history. However, over the years, these countries have made outstanding progress in meeting the extreme poverty-related goals envisaged under the 2030 Sustainable Development Agenda. While there has been some success in alleviating poverty in its extreme form, the BRICS countries continue to confront challenges with respect to relative poverty and inequality in its various forms. Moreover, the COVID-19 pandemic has been instrumental in pushing millions of people across the world below the poverty line, reversing (to some extent) the improving trends in absolute poverty alleviation. Estimates suggest that two years of the pandemic have forced an additional 85 million to 93 million people worldwide to remain or fall into extreme poverty, surviving at less than US$1.90/day (in 2011 PPP).[9] Most of these people live in developing countries, without adequate social security nets to act as shock absorbers in such trying times. The impacts of the pandemic have been exacerbated by global inflationary trends and the Ukraine crisis, bearing even more pessimistic implications for poverty alleviation.
The most recent official estimates for global poverty levels are for 2019. The estimates mentioned above are based on the assumption that economic growth over the past few years has been equitably distributed among all individuals. Therefore, when factoring inequalities in distribution patterns, available wealth that can act as a shock absorber during any crisis, access to resources, social contexts, and the provision of social security nets, the divergences in earlier projections and actual poverty numbers become even more pronounced.
The other concern is with respect to increasing inequality. Generally, apart from poverty, economic inequality reveals itself in two forms—income inequality and wealth inequality. Although the two are related, their conceptual difference needs to be understood. For any economic entity (for instance, individuals, households, or firms), income entails the flow of financial resources from wages and salaries, profits, investments, transfers, direct subsidies, and the like in a particular year. On the other hand, wealth is not a flow concept, but a stock. This is composed of the same economic entity’s total savings from past incomes, accumulated assets, windfalls gains, and additional assets created, and savings accrued in the current accounting/ financial year. Wealth, therefore, measures an entity’s gross worth. Both income and wealth are important for the welfare of the economic entity. Income ensures consumption and investment flow in normal times, while wealth helps the economic agents finance their business or consumption flows even during times of crisis. In other words, wealth helps in enhancing the economic resilience of the entities under consideration.
Now, it is contended that most emerging economies have followed a consumption-driven growth pattern.[10] Economic logic and empirical evidence[11] show that the marginal propensity to consume (i.e., the rise in consumption expenditure with a unit rise in income) declines with increased incomes. In other words, the lower income groups increase their consumption expenditures at a higher proportion than the higher income groups when incomes for both increases by the same quantity. It may therefore be inferred that an increase in income or wealth of the higher income groups will result in a lower proportion entering the consumption channel compared to the same for the lower income groups. Income or wealth accrual for the lower income groups will help the consumption-driven growth phenomenon. Hence, increasing income or wealth inequality can prove inimical for future growth of the BRICS nations.
The following sections assess how the patterns of absolute and relative poverty have evolved in the BRICS economies and some key challenges and issues these countries face in poverty alleviation. Through these discussions, the paper also attempts to highlight the prospects, implications, and specific strategies that can enable inclusive growth along a sustainable development pathway.
Since the 1980s, Brazil has witnessed a considerable decline in poverty rates and the absolute number of people living below the international poverty lines. In 2012, 8.99 million (4.49 percent of the total population) lived in extreme poverty below the US$ 2.15/ day international poverty line. By 2019, this number had risen to 11.41 million (5.39 percent of the total population), before declining to its lowest levels the following year. As of 2020, the extreme poverty rate in Brazil was almost half of that in Mexico, while Colombia had poverty rates six times higher than Brazil. Therefore, among the other countries in the Latin American region, Brazil has done well in terms of extreme poverty alleviation. Similar trends have been observed at higher poverty lines of US$ 3.65/ day and US$ 6.85/ day of income or consumption.[12] However, following the COVID-19 pandemic, Brazil witnessed one of the steepest rises in poverty rates, with the number of people living in extreme poverty going up to 3 times that of the previous year.
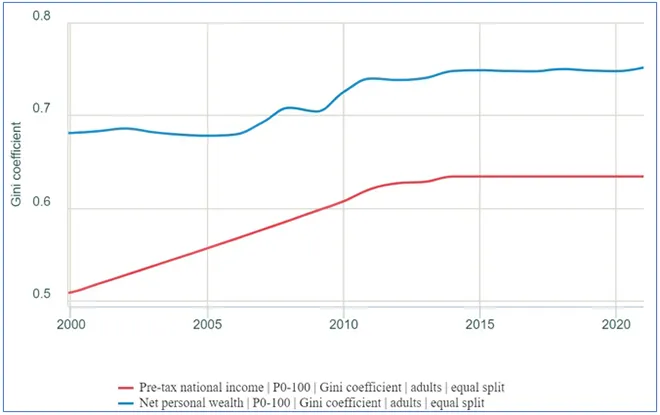
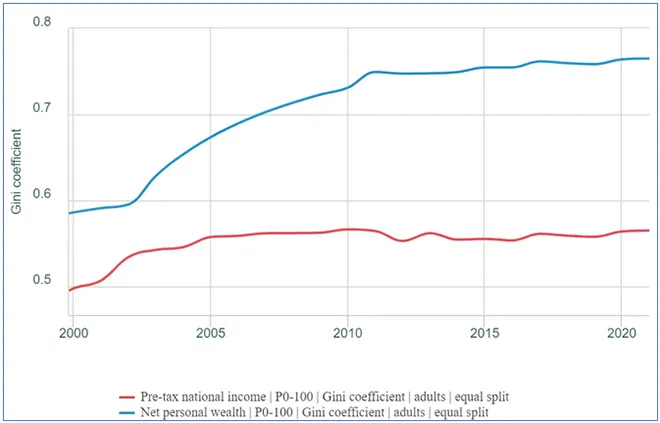
With the country performing well in terms of extreme poverty alleviation, it is important to consider the state of relative poverty among its population. Economic growth in the developing world has often been characterised by growing disparities in the distribution of resources. This is also true for Brazil, most prominently over the last decade. The disparities in distribution of economic growth are most evident in the form of income and wealth inequality among the different population shares. Despite growth and reductions in absolute poverty in Brazil, income inequality has been consistently high but stable, measured at around 0.67-0.69 (measured by Gini coefficient) over the last two decades. In 2020, in terms of income shares, the top 10 percent income earners earned 58.3 percent of the national income, the middle 40 percent earned about 32.5 percent, and the bottom 50 percent earned 9.2 percent of the national income. However, a more critical concern here is the higher levels of wealth inequality in the Brazilian economy, which increased from 0.85 to 0.90 between 2000 and 2021 (see Figure 3). In terms of wealth shares, the top 10 percent population owned 79.8 percent of the national assets in 2021, the middle 40 percent owned about 20.5 percent, and the bottom 50 percent’s share is a negative 0.4 percent, indicating a significant debt burden.[13]
Figure 3: Income and Wealth Inequality in Brazil
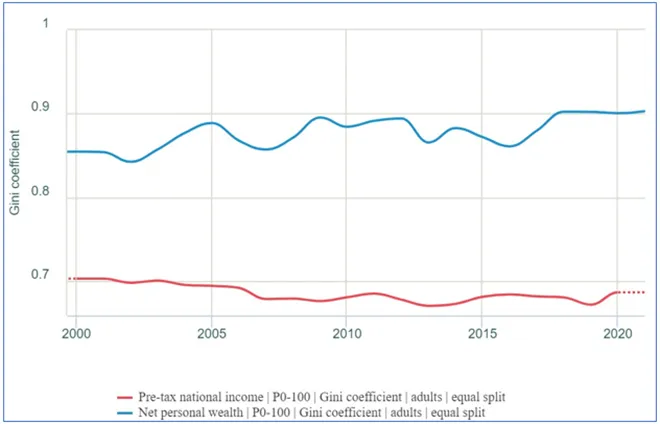
Source: World Inequality Database
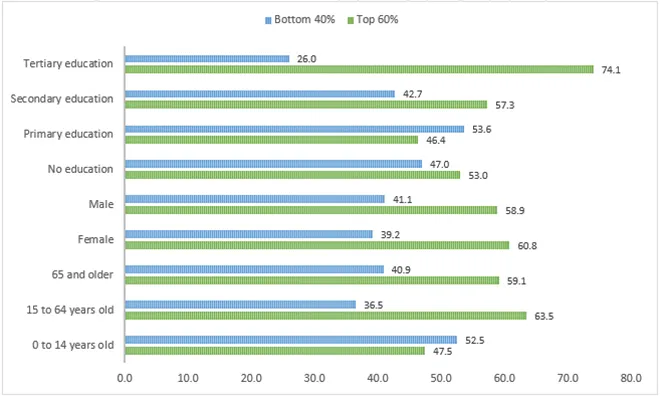
Moreover, there are significant disparities in income or consumption expenditure distribution among different groups categorised by socioeconomic indicators such as age, education, and gender. Figure 4 indicates that individuals from higher age groups or with higher levels of education mostly belong to the top 60 percent of income distribution. However, the disparities in income distribution among the Brazilian population do not exhibit a gendered pattern. This highlights the importance of targeting specific sectors, such as education, that can significantly improve relative poverty alleviation.
Figure 4: Income Distribution in Brazil, by demographic groups (2021)
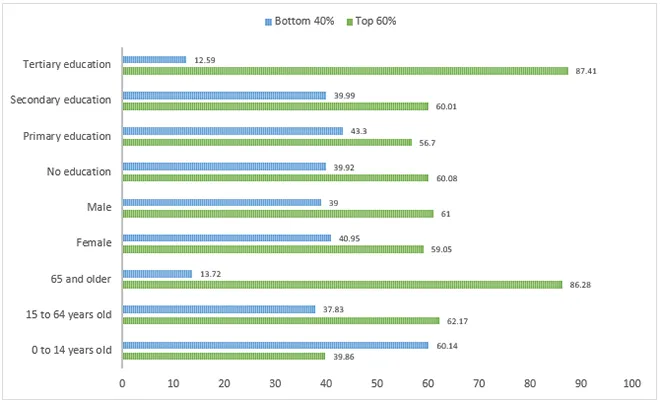
Source: Poverty and Inequality Platform, World Bank
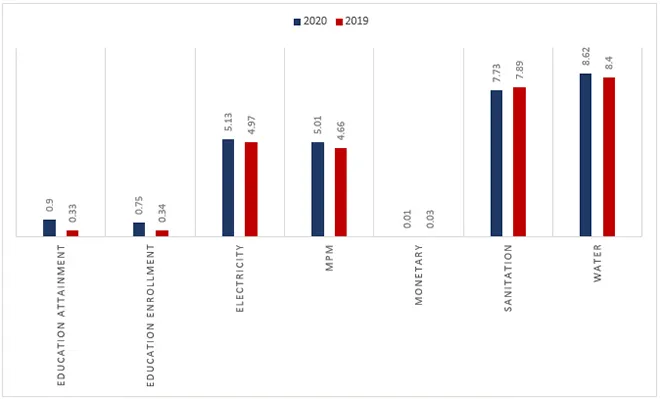
Additionally, such disparities in income and wealth distribution also translate into the deprivation of some basic needs for development, such as health, education, and food. These deprivations can limit the productive capacity of individuals, trapping them into a vicious cycle of poverty, despite ensuring equality of opportunity. Therefore, it is essential to focus on multidimensional poverty, which captures both monetary and non-monetary deprivations among individuals in a population. As of 2019, about 5.6 percent of the Brazilian population was multidimensionally poor (see Figure 5). Approximately 4.86 percent of the population was financially deprived in 2019 compared to about 4.66 percent of the population in the previous year. While the shares of population deprived in terms of access to electricity, drinking water, or even education, was very low, ranging between 0.25 percent to 2 percent, large shares of population were deprived from education attainment and sanitation. This indicates the existence of significant gaps between the provisioning and actual utilisation of resources for the Brazilian population, which must be a key focus area for the realisation of inclusive growth. Among all parameters, the deprivation is most significant with respect to limited but standard sanitation practices, with about 34.34 percent of the total population living in deprivation in 2019, although this was a slight improvement over the preceding year.[14]
Figure 5: Multidimensional Poverty in Brazil
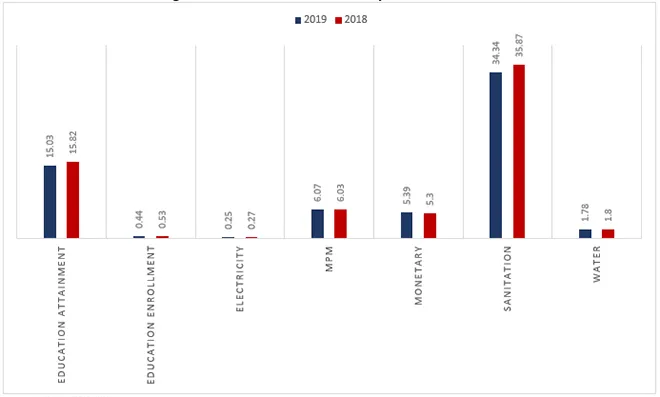
Source: Poverty and Inequality Platform, World Bank
Poverty rates based on the international extreme poverty line (US$ 2.15/day) have been historically low in Russia. According to the 2020 official estimates, Russia has almost eradicated extreme poverty, with approximately 0.01 million people living at less than US$ 2.15/day. Even with respect to the lower-middle-income international poverty line (US$ 3.65/day) and the upper-middle-income poverty line (US$ 6.85/day), the poverty rates were only 0.29 percent and 4.08 percent, respectively, of the total population in Russia. However, the national poverty line is significantly higher. In this consideration, poverty rates in Russia go up to 12.9 percent (in 2017) and about 12.10 percent (in 2020). According to its National Development Plan, Russia aims to halve the national poverty rate by 2024, setting an ambitious target for itself despite the economic slowdown following the pandemic. While official estimates are not available since 2021, the Russia-Ukraine conflict and the consequent geo-economic turmoil is likely to have impacted livelihoods across the resilient Russian economy slowing down the progress in poverty alleviation, if not exacerbating the poverty ratio.[15] Also, there are significant regional disparities in poverty rates across the country. For example, poverty rates are as low as 8 percent in Moscow, about 20 percent in the Kalmyk Republic, and up to 40 percent in other regions.[16] Moreover, despite low overall monetary deprivation, the nature of relative poverty in the country is quite complex.[17]
Wealth inequality among the different population shares in Russia has been significantly more pronounced than income inequality. Moreover, since 2008, this divergence has been growing due to a simultaneous decline in income inequality and an increase in wealth inequality (see Figure 6). Economic growth and reductions in absolute poverty have also resulted in reductions in income inequality in recent years. Expressed in terms of the Gini coefficient, income inequality has declined from about 0.61 over the 2000-2008 period to 0.55 in 2018. The income shares of the top 10 percent of income earners had declined from 50 percent in 2000 to about 45.5 percent of the national income in 2017, benefitting both the middle 40 percent and the bottom 50 percent of the population. In 2018, there was a slight increase in the income share of the top 10 percent of income earners and a simultaneous decline in income shares of the remaining population. Projections estimate a slight increase in income inequality in Russia up to 0.58 in 2021. Despite improvements in income distribution, the extremely high level of wealth inequality is a critical concern for Russia. Wealth inequality has increased from 0.61 in 2000 to 0.83 in 2021. In fact, in terms of wealth shares, the top 10 percent population owned 74.1 percent of the national assets, the middle 40 percent owned about 22.8 percent, and the bottom 50 percent’s share was just 3.1 percent in 2021.[18]
Figure 6: Income and Wealth Inequality in Russia
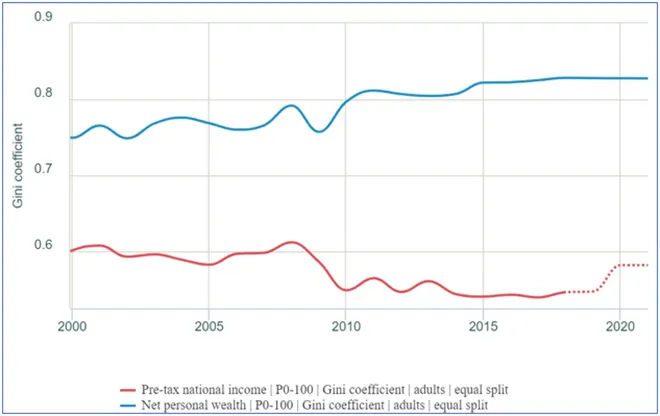
Source: World Inequality Database
Categorised by socioeconomic indicators such as age, education, and gender, Figure 7 indicates clear trends in income distribution. More than 50 percent of children (0-14 years old) belong to the bottom 40 percent consumption expenditure group; these shares are considerably lower for working adults and older age groups. This shows that children form the most vulnerable population group and demand urgent attention to ensure sustainable development. Similarly, with respect to education, a larger share of individuals with higher levels of education belongs to the top 60 percent income or consumption expenditure group. No stark gendered pattern in consumption expenditure is observed; the share of the female population in the bottom 40 percent income group is slightly lower than men.[19]
Figure 7: Income Distribution in Russia, by demographic groups (2020)
Source: Poverty and Inequality Platform, World Bank
It is essential to focus on multidimensional poverty, which captures both monetary and non-monetary deprivations among individuals in a population. The Russian case establishes this argument even more strongly; highlighting that economic growth is a necessary but insufficient condition for inclusive development. As of 2020, about 5 percent of the population was multidimensionally poor, while monetary deprivation stood at an absolute 0 percent of the population (see Figure 8). Also, in terms of both education enrolment and attainment, a significantly low share of the population is living in deprivation. However, the incidence of deprivation along education indicators increased slightly in 2020 over the 2019 levels, which can be a worrying trend if it persists. However, the largest shares of the population are deprived in terms of access to basic needs, such as electricity, drinking water, and sanitation. This indicates the need to address challenges related to the public provision of resources or even the creation of efficient and competitive markets where marginalised private players can come in. The participation of small and medium enterprises can be encouraged through suitable reforms.[20] This can also lead to job creation and further economic growth. As such, both the public and the private sectors can play an active role in achieving inclusive growth. Among all parameters, the deprivation is most significant with respect to the availability of safe drinking water, with such incidence increasing in 2020 over the preceding year.[21]
Figure 8: Multidimensional Poverty in Russian Federation
Source: Poverty and Inequality Platform, World Bank
Among the BRICS countries, India (and China) has historically had high poverty rates, though some recent estimates suggest that the country has lifted a large chunk of the population above poverty lines. In 2011 (the most recent year for which official poverty estimates are available), approximately 283.37 million (22.53 percent of the total population) lived in extreme poverty below US$2.15/day. The poverty rate with respect to the national poverty line stood at 21.9 percent (in 2011).[22] In 2011, almost 62.3 percent of the Indian population (783.47 million) lived below the US$3.65/day relative poverty line, and only about 10 percent had income or consumption expenditure higher than US$6.85/day.[23] While the official poverty estimates are dated and mostly incomparable with other BRICS nations, several studies have attempted to arrive at projections based on the National Accounts System (NAS) or estimates from the Consumer Pyramid Household Survey (CPHS) for the post-2011 period.[24] Bhalla et. al. arrive at significantly optimistic projections using the national accounts consumption growth data, indicating that India has successfully almost eradicated extreme poverty in all its forms.[25] The study also shows while the COVID-19 pandemic and the associated economic fallouts have led to income contraction for the most vulnerable shares of the population, the in-kind transfers introduced by the government have limited the rise in poverty rates. On the other hand, Roy and van der Weide estimate significantly higher poverty rates using the NAS and the CPHS data (see Figure 9). The CPHS projections indicate a 12.52 percent decline in extreme poverty rates between 2011 and 2019.[26]
Figure 9: Poverty Rate Estimates for India
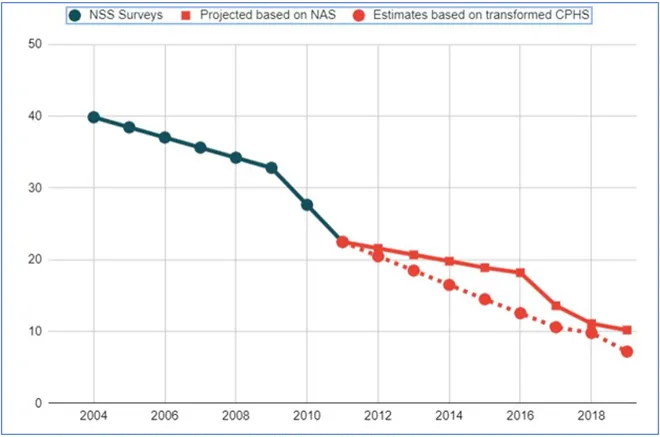
Source: Authors’ own, based on estimates from: Roy & van der Weide, 2022
Such extrapolations often assume a one-to-one translation between overall economic growth and increased income levels or consumption expenditure across individuals. However, this assumption seldom holds. Mostly, the benefits of growth accrue to population groups in a skewed manner. Over the 2004-2011 period, the annual growth in consumption of the bottom 40 percent population stood at 3.20 percent, while the median income growth for the overall population was about 3.47 percent. Hence, the shared prosperity premium was -0.5 percent.
Figure 10: Income and Wealth Inequality in India
Source: World Inequality Database
Both income and wealth inequality increased in India in the 2000-2021 period, with the concentration of wealth occurring more rapidly than income concentration (see Figure 10). Measured in terms of the Gini coefficient, income inequality increased from 0.51 in 2000 to 0.63 in 2021, and wealth inequality increased from 0.68 in 2000 to 0.75 in 2021. As of 2000, the income shares of the top 10 percent and the middle 40 percent of the population were roughly equal at 41 percent, and the remaining 18 percent accruing to the bottom 50 percent. However, over the next two decades, the income shares of the middle 40 percent and the bottom 50 percent population dropped to 30 percent and 13 percent, respectively, while the top 10 percent’s share increased. Changes in wealth distribution followed similar trajectories with relatively more fluctuations.[27]
Much like India, a significant share of China’s population lived in absolute poverty at the beginning of the 21st century. From a poverty rate of 2.88 percent in 2013, with approximately 39.3 million people living below the international extreme poverty line, China’s poverty rate (and its incidence) declined to 0.14 percent (about 2 million people) by 2019. In reference to the national poverty line, the poverty rate was almost nil in 2020. The relative declines with respect to higher international poverty lines also followed similar trajectories over this period. Among the BRICS countries, China attained the highest average growth rates in GDP and per capita GDP over the last decade. However, about 24.72 percent of its population (roughly 348 million people) continues to live on less than US$6.85/day income or consumption expenditure, despite significantly high levels of per capita GDP.[28]
The average annualised growth rate on income of the bottom 40 percent of the population in the 2005-2010 period indicates lower growth than the median income growth. However, from 2008-2012 and subsequent comparison periods, the divergence has been consistently positive. This roughly coincides with China’s strategic shift from an ‘export-driven economy’ to a ‘consumption-driven economy’ post the 2008 global financial crisis due to significant improvements in the wage shares of labour. However, in recent years, the median income growth and that of the bottom 40 percent have declined to some extent.[29]
Even in terms of income and wealth inequality, China has witnessed an increasing trend, only to stabilise in the post-2014-2015 period. As of 2000, the income shares of the top 10 percent income earners was 36 percent, about 49 percent for the middle class, and 17 percent for the bottom 50 percent. However, until 2010, income inequality in China increased sharply, with rising shares of income accruing to the top income earners and declining shares for the middle class and the bottom half of the population. The rising trends in income inequality were arrested following China’s shift to a “consumption-driven growth” strategy, which augmented the incomes of the salaried middle-class and wage earners, with a relative decline in the share of the top decile. However, the structural shift also coincides with a significant increase in wealth inequality in the Chinese economy. As of 2021, the top 10 percent of asset owners in China owns about 68 percent of the net personal wealth, the middle 40 percent owns just about 26 percent share of wealth, and the poorest half owns only around 6 percent. Thus, while economic growth and specific strategies have led to substantial reductions in poverty and arrested the rising trends in income inequality, it has also led to higher inequalities in asset ownership that may threaten the sustainability of China’s economic development. With China’s growing focus on common prosperity, addressing wealth inequality in the country will be a critical issue.[30]
Figure 11: Income and Wealth Inequality in China
Source: World Inequality Database
According to the 2014 official estimates, poverty rates based on the international extreme poverty line (US$ 2.15/day) in South Africa was almost 20.5 percent, with approximately 11.22 million people living on less than US$2.15 in consumption expenditure per day. With respect to the lower-middle-income international poverty line (US$3.65/day) and the upper-middle-income poverty line (US$6.85/day), the poverty rates were approximately 40 percent and 61.6 percent of the total population, respectively. However, the national poverty line in South Africa is significantly higher compared to the international extreme poverty line. In this consideration, poverty rates in South Africa were about 55.5 percent in 2014. Poverty rates in the country were high until 2005 and started declining significantly over the 2005-2010 period. But there was a considerable jump in the poverty rates and the absolute number of people living in poverty after 2010, attributed primarily to a slowdown in economic growth that disproportionately impacted the more vulnerable.[31]
Like the other BRICS countries, wealth inequality in South Africa has been significantly more pronounced than income inequality. However, since 2008, this divergence has been closing due to a simultaneous decline in wealth inequality and an increase in income inequality (see Figure 12). Economic growth and increases in absolute poverty have also resulted in higher levels of income inequality in recent years. Expressed in terms of the Gini coefficient, income inequality has increased from about 0.66 in 2002 to 0.75 in 2014. The income shares of the top 10 percent income earners increased from 53.5 percent in 2000 to about 65.4 percent in 2014, with a simultaneous and consistent decline in income shares of the middle 40 percent and the bottom 50 percent of the population. While wealth inequality in the country has been declining in the last decade, it is still at the highest level among all BRICS countries.[32] The extremely high level of wealth inequality and increasing income concentration is a critical concern that South Africa needs to address moving forward.
Figure 12: Income and Wealth Inequality in South Africa
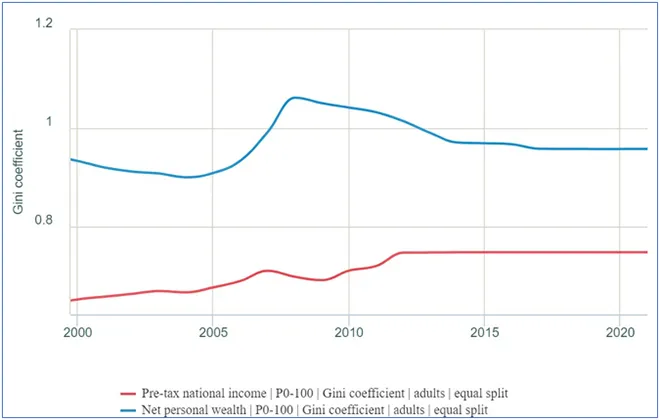
Source: World Inequality Database[/caption]
Categorised by socioeconomic indicators such as age, education, and gender, Figure 13 indicates clear trends in income distribution. Higher age groups increasingly comprise the top 60 percent of the income distribution, indicating children are the most vulnerable to inadequate consumption expenditure, affecting their food and nutritional security. Also, improvements in access to higher levels of education play a significant role in delivering higher income levels. Again, no stark gendered pattern in consumption expenditure is evident. But the share of the female population in the bottom 40 percent income group is slightly higher than men.
Figure 13: Income Distribution in South Africa, by demographic group
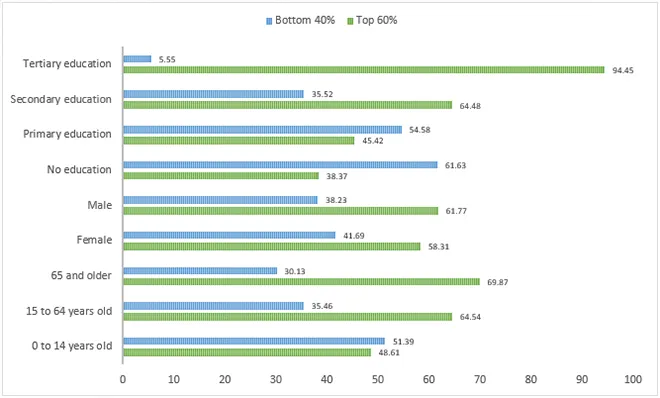
Source: Poverty and Inequality Platform, World Bank
About 20 percent of the South African population (in 2014) are multidimensionally poor, which captures both monetary and non-monetary deprivations (see Figure 14).[33] Deprivation was most significant in terms of monetary and sanitation indicators. The performance is significantly better in terms of basic access indicators, such as electricity or safe drinking water. Also, in terms of both education enrolment and attainment, a significantly low share of the population is living in deprivation.
Figure 14: Multidimensional Poverty in South Africa (2014)
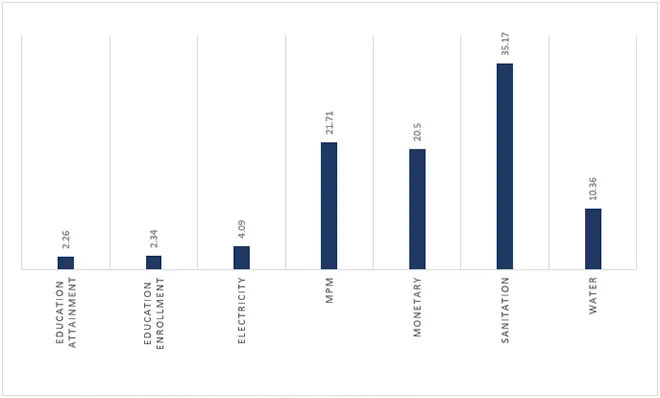
Source: Poverty and Inequality Platform, World Bank
The BRICS countries have attained outstanding economic growth and significant reductions in absolute poverty in recent years. However, the specific growth trajectories the five countries have followed have led to the emergence of other critical issues, such as income concentration and wealth inequalities, that pose a severe threat to the prospects for sustainable development. Both poverty and economic inequalities are critical pressure points and impose a social cost, while wealth inequality can impair the consumption-driven growth phenomenon of the BRICS nations. It is, therefore, important to pose the framework of development in terms of an ‘inclusive wealth’[34] approach rather than looking at things merely from the perspective of GDP growth.
The ‘inclusive wealth’ perspective brings much-needed holism to the development agenda driven by the UN Sustainable Development Goals (SDGs). The SDG agenda rests largely on the four forces of capital—human capital (SDGs 1-5), physical capital (SDGs 8 and 9), natural capital (SDGs 14 and 15), and social capital (SDGs 10 and 16). The United Nations Environment Programme’s Inclusive Wealth Report 2018 explores the changes in the social values of three of these capital assets—natural, human, and produced or physical capital—over the 1990-2014 period. As per this report, between 1990 and 2014, physical capital and health- and education-induced human capital grew at 3.8 percent and 2.1 percent per annum, respectively, globally, at the cost of natural capital, which declined at 0.7 percent per annum. India's ‘inclusive wealth’ increased at barely 1.6 percent per annum during this period, driven by human and physical capital growth.
Similarly, for Brazil, the inclusive wealth increased at 0.7 percent, mainly triggered by human and physical capital (both rising at 0.5 percent annually), but a decline in natural capital by 0.3 percent. In China, inclusive wealth increased by 2.4 percent (the highest among the BRICS countries), triggered by human capital (1.4 percent) and physical capital (1.1 percent), but at the cost of natural capital (-0.2 percent). South Africa witnessed an increase in inclusive wealth by 1.6 percent and a consequent decline in natural capital by 0.1 percent during the same period. If inclusive wealth is taken as the factor or fundamental basis for development, then such a decline raises serious questions about the sustainability of the development process. Only Russia recorded a nominal 0.2 percent annual growth in inclusive wealth and a consequent growth rate of natural capital by 0.1 percent, thereby reversing this trade-off. Ghosh et al. have shown that addressing the four capitals helps create an enabling business environment and enhances business competitiveness.[35]
The following strategies can play a key role in driving inclusive growth in the five BRICS developing economies:
Conclusion
Economic growth in the BRICS countries has been instrumental in driving down international inequalities in recent years. Moreover, the spectacular material progress witnessed by these countries has also shifted the global power balance to favour a more equitable dynamic between the developed and the developing world. However, the pursual of ‘mindless’ economic growth has also generated negative externalities, evident in the rising within-country income (in some cases), and the significant wealth inequality and resource disparities. At this juncture, the BRICS countries can come together to address these inequalities as ‘leaders’ of the developing world. A synergised effort towards addressing inequalities between and within the BRICS can provide the Global South and the world with a reference framework for addressing shared concerns over rising global inequalities. Such efforts towards inclusive growth can create a ripe ground for sustainable development.
For three of the five BRICS countries, consumption-led economic growth has emerged as an organic outcome of their structural features. However, addressing inequalities in asset distribution has been the missing link that threatens the sustainability of consumption-driven growth.[38] The stock of wealth acts as a buffer that supports or sustains consumption levels, particularly during periods of economic downturn and fall in incomes. This prompts populations with low asset bases and a higher propensity to consume to compromise on their consumption levels and, as such, acts as a cyclical force to perpetuate the decline in growth rates. Therefore, consumption-led growth can be synonymous with inclusive growth, provided it follows a more integrated approach to tackle the problems of development. Wealth inequalities in the BRICS economies are substantially high, despite improvements in poverty alleviation and some progress in arresting the rising trends in income inequalities. This demands urgent attention. Efforts towards asset redistribution within the population[39] and asset securitisation among the most vulnerable should complement the generation of enabling market forces, leading to job creation and human capital formation to ensure inclusive growth in the long run.
While sustainability and inclusion have been priority areas of the BRICS development paradigm, a diverse set of challenges for each member country—in terms of their specific domestic sociopolitical contexts, international relations, and global economic participation—and the increasing impacts of climate change have necessitated a rethinking and realignment of the development pathways that each of these economies have embarked upon. This entails a more holistic development thinking triggered by the SDGs and the inclusive wealth approaches rather than merely looking at reductionist economic growth as the panacea of all development problems.
Endnotes
[1] Rajiv Bhatia, “Is BRICS still relevant?”, Gateway House, Indian Council on Global Relations, September 2, 2021.
[2] Deepak Nayyar, “BRICS, developing countries and global governance”, Third World Quarterly, Vol.37 (4), Pp. 575-591, March 2016.
[3] Nicholas R. Lardy, “China: Toward a Consumption-Driven Growth Path”, in Seeking Changes
The Economic Development in Contemporary China. Y. Zhou (ed.) (World Scientific, Singapore, 2016).
[4] Oscar J Mujica, et. al., “Socioeconomic inequalities and mortality trends in BRICS, 1990-2010”, Bulletin of the World Health Organization, Vol. 92 (6), Pp. 405-412, June 2014.
[5] Courtney Ivins, “Inequality Matters: BRICS Inequalities Fact Sheet”, Oxfam and BRICS Policy Center, March 2013.
[6] Charles K. Ebinger and Govinda Avasarala, “The Energy-Poor BRIC”, Brookings, October 19, 2012.
[7] “Introduction to Inclusive Growth”, Organisation of Economic Cooperation and Development, accessed on May 29, 2022.
[8] “The power of parity: How advancing women’s equality can add $12 trillion to global growth”, McKinsey Global Institute, September 1, 2015.
[9]Daniel Gerszon Mahler, Nishant Yozan, Ruth Hill, Christoph Lakner, Haoyu Wu and Nobuo Yoshida, “Pandemic prices and poverty”, World Bank Blogs, The World Bank Group, April 13, 2022.
[10] Jonathan Woetzel et al. Outperformers: High-Growth Emerging Economies and The Companies that propel them. McKinsey Global Institute. September 2018.
[11] Jonathan Fisher, David S. Johnson, Timothy M. Smeeding, and Jeffrey P. Thompson, “Estimating the marginal propensity to consume using the distributions of income, consumption and wealth”. Working Papers, No. 19-4, Federal Reserve Bank of Boston, Boston, MA. 2019.
[12] “Country Profile: Brazil”, Poverty and Inequality Platform, The World Bank Group, accessed on May 27, 2022.
[13] “Country Profile: Brazil”, World Inequality Database, accessed on May 27, 2022.
[14] “Country Profile: Brazil”, Poverty and Inequality Platform, The World Bank Group, accessed on May 27, 2022,
[15] Alexander Marrow, “Analysis: Russian economy holding up but the road back to prosperity may be long”, Reuters, February 23, 2023,
[16] Renaud Seligmann and Vedomosti, “To Reduce Poverty, Russia Must Ensure More Inclusive Growth”, The World Bank Group, February 9, 2020,
[17] “Country Profile: Russian Federation”, Poverty and Inequality Platform, The World Bank Group, accessed on May 27, 2022,
[18] “Country Profile: Russian Federation”, World Inequality Database, accessed on May 27, 2022,
[19] “Country Profile: Russian Federation”, Poverty and Inequality Platform, The World Bank Group, accessed on May 27, 2022,
[20] Renaud Seligmann and Vedomosti, “To Reduce Poverty, Russia Must Ensure More Inclusive Growth”, The World Bank Group, February 9, 2020,
[21] “Country Profile: Russian Federation”, Poverty and Inequality Platform, The World Bank Group, accessed on May 27, 2022,
[22] “Poverty headcount ratio at national poverty lines (% of population) – India”, World Development Indicators, World Bank,
[23] “Country Profile: India”, Poverty and Inequality Platform, The World Bank Group, accessed on May 27, 2022,
[24] Justin Sandefur, “The Great Indian Poverty Debate, 2.0”, Center for Global Development, April 19, 2022.
[25] Surjit Bhalla, Karan Bhasin and Arvind Virmani, “Pandemic, Poverty, and Inequality: Evidence from India”, IMF Working Paper No. 2022/069, International Monetary Fund, April 2022.
[26] Sutirtha Sinha Roy and Roy Van Der Weide, “Poverty in India Has Declined over the Last Decade But Not As Much As Previously Thought”, Policy Research Working Paper No. 9994, The World Bank Group, April 2022.
[27] “Country Profile: India”, World Inequality Database, accessed on May 27, 2022,
[28] “Country Profile: China”, Poverty and Inequality Platform, The World Bank Group, accessed on May 27, 2022,
[29] “Country Profile: China”, Poverty and Inequality Platform, The World Bank Group, accessed on May 27, 2022,
[30]Frank Tang, “China’s wealth inequality has worsened in pandemic, highlighting ‘alarming’ global trend, Oxfam finds”, China Macro Economy, January 23, 2022,
[31] “Country Profile: South Africa”, Poverty and Inequality Platform, The World Bank Group, accessed on May 27, 2022,
[32] “Country Profile: South Africa”, World Inequality Database, accessed on May 27, 2022,
[33] “Country Profile: South Africa”, Poverty and Inequality Platform, The World Bank Group, accessed on May 27, 2022,
[34] UNEP, Inclusive Wealth Report 2018, (UNEP, Nairobi. 2018)
[35] Nilanjan Ghosh, Soumya Bhowmick and Roshan Saha, “SDG Index and Ease of Doing Business in India: A Sub-National Study”, ORF Occasional Paper No. 199, June 2019, Observer Research Foundation.
[36] “Making Growth Inclusive in BRICS Countries: Issues, Challenges and Policies”, Institute for Human Development, September 2016,
[37] Nilanjan Ghosh, “Promoting a ‘GDP of the Poor’: The Imperative of Integrating Ecosystems Valuation in Development Policy,” ORF Occasional Paper No. 239, Observer Research Foundation, March 2020,
[38] Nilanjan Ghosh, “Is increasing wealth inequality coming in the way of economic growth in India?,” ORF Expert Speak, Observer Research Foundation, October 21, 2021,
[39] Maitreesh Ghatak, “India's Inequality Problem”, The India Forum, June 23, 2021,
The views expressed above belong to the author(s). ORF research and analyses now available on Telegram! Click here to access our curated content — blogs, longforms and interviews.

Dr Nilanjan Ghosh is Vice President – Development Studies at the Observer Research Foundation (ORF) in India, and is also in charge of the Foundation’s ...
Read More +
Debosmita Sarkar is an Associate Fellow with the SDGs and Inclusive Growth programme at the Centre for New Economic Diplomacy at Observer Research Foundation, India. Her ...
Read More +