Author : Arpan Chatterji

Occasional PapersPublished on Dec 18, 2020 PDF Download
ballistic missiles,Defense,Doctrine,North Korea,Nuclear,PLA,SLBM,Submarines

Air Pollution in Delhi: Filling the Policy Gaps

  • Arpan Chatterji

    Delhi, a Union Territory that is home to India’s capital, New Delhi, is among the world’s urban agglomerations with the most toxic air. The magnitude of air pollution is massive. It causes devastating impacts on people’s health, the city’s environment, and economic well-being. Despite overwhelming evidence of the severity of air pollution and its consequences, however, India’s policy measures remain weak. This paper identifies the most crucial gaps in policies and outlines a framework for creating more focused targets that will improve air quality in Delhi.

Attribution:

Arpan Chatterji, “Air Pollution in Delhi: Filling the Policy Gaps,” ORF Occasional Paper No. 291, December 2020, Observer Research Foundation.

Introduction

Twenty-one of the world’s 30 cities with the worst levels of air pollution are in India, according to data compiled in IQAir AirVisual’s 2019 World Air Quality Report; six Indian cities are in the top ten.[1] Indeed, air pollution is pervasive in many parts of India, causing massive public health and environmental crises. The economic cost of fossil fuel air pollution alone is estimated at INR 10,700 billion, or 5.4 percent of the country’s annual GDP. An estimated one million deaths each year, and 980,000 pre-term births, are attributed to air pollution from fossil fuel in India.[2]

Among all the cities in India, some of the worst levels of air pollution are seen in its capital territory, Delhi. The impacts are devastating, including in the degree of particulate matter concentrations in the air (environmental), reduction in life expectancy (health), and high costs that the state is incurring to resolve the crisis (economic). The main sources of air pollution in Delhi include vehicle exhaust, heavy industry such as power generation, small-scale industries like brick kilns, suspended dust on the roads due to vehicle movement and construction activities, open waste burning, combustion of fuels for cooking, lighting, and heating, and in-situ power generation via diesel generator sets.[3] Compounding the problem are seasonal emissions from dust storms, forest fires, and open field fires during harvest season. Extreme air pollution from these sources affects millions of people in densely populated regions who are exposed to thick, toxic smog for long periods of time.[4]

As the state government starts organising more policy measures to combat this recurring problem, this paper seeks to provide an analysis of the situation in Delhi to explain how air pollution impacts public health and the economy, and what the government has done so far to mitigate the problem. The paper analyses the Union government’s flagship National Clean Air Program (NCAP), as well as the initiatives taken by the Delhi government, to combat air pollution.

Air Pollution Trends

India has been particularly vulnerable to air pollution over the last two decades, owing to population growth, increasing numbers of vehicles, use of fuels, inefficient transportation systems, poor land use patterns, industrialisation, and ineffective environmental regulations.[5] Among Indian cities, the capital, New Delhi, is one of the worst-affected. New Delhi has the highest ambient particulate matter pollution exposure in the country. As of 2019, the average annual PM 2.5 concentration across India was 58.1 micrograms per cubic meter; Delhi’s average PM 2.5 concentration for the year 2019 was 98.6 micrograms per cubic meter. The startling aspect of that statistic is that the recorded level is not just the highest for any capital city in India, but for any capital city in the world.[6]

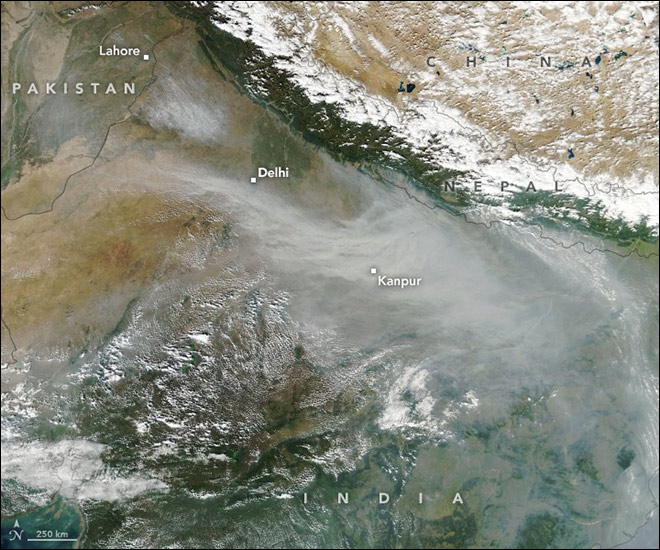
Figure 1. Satellite Image showing Haze across Delhi in November 2019

In 2019, NASA Earth-observing satellites began to detect significant numbers of fires in mid-October. By the end of the month, large numbers of fires were detected across much of the state of Punjab, as well as parts of northeastern Pakistan. The Moderate Resolution Imaging Spectroradiometer (MODIS) on NASA’s Aqua satellite captured this natural-color image on the afternoon of November 4, 2019, when a plume of smoke that had been emitted a few days earlier was sweeping through Delhi. The haze had pushed levels of fine particulate matter (PM2.5) to hazardous levels in Delhi.[7]

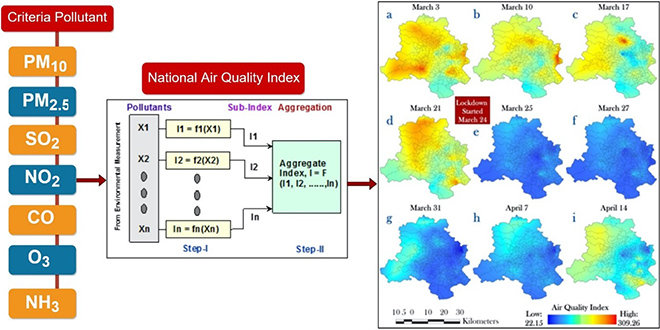
After Delhi went into lockdown in the wake of the pandemic, the pollution levels decreased drastically, and the air quality index returned to the ‘satisfactory’ level.[8] Before this, Delhi’s air was cleanest on 29 September 2019, when the AQI measured 60, which is ‘satisfactory’. As shown on the Real-Time Air Quality Index, in Delhi, particulate matter (PM2.5) dropped from 165µg/m3 on 21 March 2020, a level considered unhealthy to everyone, to 64µg/m3 on 29 March 2020, ‘moderate’ or ‘acceptable’.[9] This is a sharp drop in air pollution for Delhi which usually records ‘poor’ to ‘severe’ levels of air quality with the AQI ranging from 100 to 300, and even higher in colder months.[10]

Table 1: Levels of PM10 and Air Quality Index during and after Lockdown

Phase of Lockdown PM10 levels and AQI
First Three Phases (March-May 2020) The first three phases of the national lockdown, which started on March 25, led to large declines in air pollution in Delhi. In April 2020, the concentration of PM 10 fell to 71.7 μg/m3, less than half the concentration observed during the same month over the previous three years.[11]
Fourth Phase (May-October 2020) The concentration of PM 10 rose to 96.4 μg/m3 during the fourth phase of the lockdown, which expanded exemptions and permitted interstate movement starting May 18.[12] But, shortly after lockdown restrictions were eased after May 18, a spike was recorded, and records indicated that Delhi’s pollution patterns started climbing again.[13] Delhi’s air pollution levels increased by 43 percent in comparison to its best levels of air quality during the lockdown.[14]
Post-Lockdown (October 2020 onwards) To make matters worse, air quality in the Indian capital plummeted to an eight-month low on October 17, 2020.[15] The air quality index (AQI) crossed 350 at various places, hovering between “very poor” and “severe” since then.[16]

The city experienced relatively cleaner air during the COVID-19 lockdown as industrial activity came to a halt. However, a drop in temperatures, coupled with the resumption of industrial operations and stubble burning by farmers after the harvest season, have raised pollution levels back up to dangerous levels.  As Delhi has reopened, vehicles are back on the road, construction is restarting, and factories are reopening—air pollution, which had fallen to half the usual levels at this time of the year, is again rising.[17]

Fig 2. Change in NAQI in the NCT Delhi (3 March to 14 April 2020)[18]

Air Quality in Delhi: Key Factors

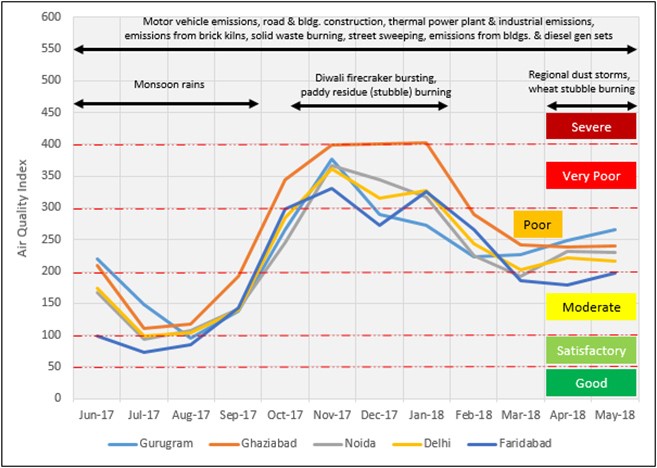
The most crucial reasons for the alarming levels of air pollution in Delhi include the city’s landlocked geographical location, crop burning in neighbouring states (Punjab, Haryana and Rajasthan), vehicular emissions, industrial pollution, and large-scale construction activities. 

Figure 3: Climatic Conditions, Sources of Air Pollution, and Air Quality Index (AQI) in NCR Cities (June 2017 to May 2018)[19]

Crop Burning

The national capital territory of Delhi is landlocked between the states of Haryana, Rajasthan and Uttar Pradesh, and the Himalayas in the north. Much of the air pollution in Delhi is blamed on crop-burning—especially in the states of Punjab and Haryana, where rice and wheat are widely grown. Burning typically peaks during the first week of November, a time when many farmers set fire to leftover rice stalks and straw after harvest, a practice known as stubble or paddy burning, a cost-effective measure for clearing out fields.[20] As the new harvest season starts, paddy is burnt on a large scale, resulting in a dense layer of smog over the Northern Plains, including Delhi NCR. Farmers in the states of Haryana, Punjab, Rajasthan and Uttar Pradesh grow rice on 10.5 million hectares (26 million acres), producing about 48 million tonnes of straw a year of which about 39 million tonnes are burnt.[21]  The problem has become more acute due to various reasons including types of seeds used and government policies that encourage late harvesting to save groundwater.[22] The burning often coincides with falling temperatures and slow wind speeds—meteorological conditions that can lead to temperature inversions, which trap smoke in place.[23] There is also a mistaken belief among farmers in neighbouring states that burning the stubble will take the nutrients back to the soil.

Industrial Pollution

Delhi has the highest cluster of small-scale industries in India. Assessments made by the Central Pollution Control Board (CPCB) show that the national capital is home to and surrounded by highly pollutive industrial clusters that do not meet limits on air, water or soil emissions. The Najafgarh drain basin in Delhi, for example—which includes the Anand Parbat, Naraina, Okhla and Wazirpur industrial areas—is the second most polluted cluster in India: its air and water are in the “critical” category in toxic content, and its soil, “severe”.[24] With as many as 3,182 industries located across the Delhi-National Capital Region (NCR), industrial pollution adds about 18.6 percent to the poor air quality. Emissions in the order of 200-1000 tonnes/year is found over industrial zones next to the most used arteries of roads.[25] Compounding the situation is the federal government’s inefficient carbon tax policy. Since carbon tax is levied exclusively on coal, major industries have switched to cheaper fossil fuel-based alternatives to avoid such levy.[26]

To the relief of the capital territory, the Supreme Court in 2017 banned the use of cheaper alternatives in the NCR, including petroleum coke[a] and furnace oil; the tribunal suggested that similar steps be taken in other States.[27] However, these same fuels continue to be used in neighbouring states, and their emissions contribute to Delhi’s Air Quality Index.[b]

Vehicular Emissions

The transport sector is the main source of PM2.5 emissions in Delhi (28 percent of all PM2.5 emissions). Vehicular contribution also makes up 80 percent of nitrogen oxides and carbon monoxide in Delhi’s air.[28] Data on vehicular pollution in Delhi shows the following: trucks and tractors generate 9 percent of emissions; 7 percent from two-wheelers; 5 percent from three-wheelers; 3 percent each from cars and buses; and 1 percent from light commercial vehicles. In all, these vehicles are responsible for 41 percent of the total pollution load in Delhi.[29]

The number of vehicles in Delhi was 10.9 million in March 2018, including over 7 million two-wheelers. While the annual growth rate of vehicles dropped from 8.13 percent in 2005-06 to 5.81 percent in 2017-18, the number of vehicles per thousand population increased from 317 to 598 during the period.[30] The total number of motor vehicles plying the roads of the national capital territory was 10.986 million as of 31 March 2018.[31]

Emissions from four-wheelers registered in other states also contribute to the overall emissions from cars in Delhi.[32] In 2018, cars from outside Delhi contributed to nearly 25-45 percent of overall emissions from four-wheelers.[33]

Construction

Construction sites generate high levels of pollutants that can travel long distances over time; this is true for Delhi NCR.[34] The outskirts of NCT have roughly 360 brick kilns, mostly in the Jhajjar, Faridabad and Ghaziabad regions, whose peak business months are from December to June. Their emissions rise during the winter months, because in summer and spring, the winds are relatively faster, and gases do not stay suspended in one place.[35] Fine dust from construction activities is a significant contributor to the poisonous mixture referred to as ‘smog’. According to Delhi Pollution Control Committee (DPCC) officials, 30 percent of air pollution in the territory is caused by dust from construction sites.[36] The government and local municipal corporations have not adequately ensured compliance of the construction industry with environmental regulations such as covering up debris and waste management. Compounding the problem is that infrastructure projects do not bother to publish timelines, rendering their construction teams without accountability.

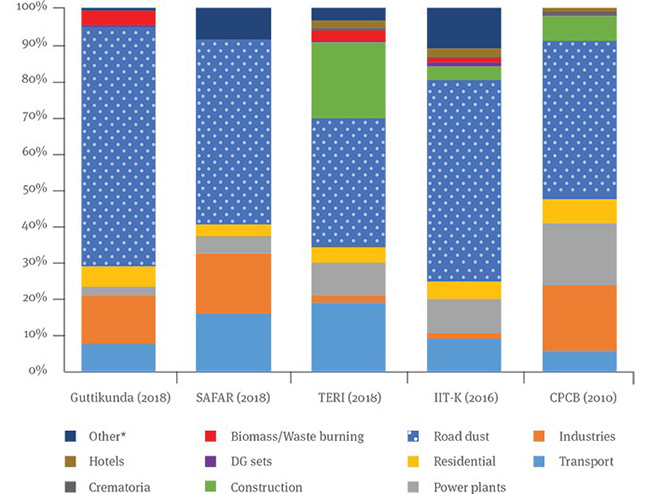
Figure 4. Sector-Wise Contribution to PM 2.5

Source: CEEW analysis, 2019[37]

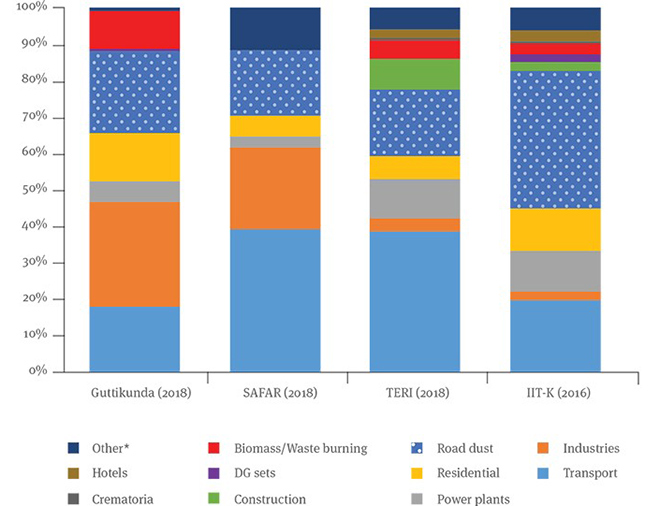
Figure 5: Sector-Wise Contribution to PM 10

Source: CEEW analysis, 2019

Table 2. Summary of variation in the emissions inventory for PM10 and PM2.5 in five key sectors

Sector Variation
PM 2.5(%) PM 10(%)
Transport 5.5-19.0 17.9-39.2
Industries 1.3-18.3 2.3-28.9
Power Plants 2.5-17.0 3.1-11.0
Road Dust 35.6-65.9 18.1-37.8
Construction 3.6-21.0 2.2-8.4

Source: CEEW analysis, 2019

Table 3 Sources of Air Pollution[38]

POLLUTANT SOURCE CONDITIONS
Particulate matter Traffic Summer and winter
Forest fires
Wood smoke
Infiltrates indoors
Ultrafine particulate matter (< 0.1 μm in diameter) Diesel traffic Close to busy roads
Ozone Secondary to aero-chemical reaction to nitrogen oxides and volatile organic compounds Summer afternoons; heat and sunshine
Nitrogen dioxide Traffic Close to busy roads
Carbon monoxide Traffic Close to busy roads
Sulfur dioxide Industrial plants—combustion and refining of coal, oil, and metal-containing ores Close to industrial sources
Gasoline, although sulfur content has recently been reduced
Impacts of Poor Air Quality

The Global Burden of Disease Report ranked outdoor air pollution as the fifth leading cause of death in India in 2017. From a demographic perspective, high Particulate Matter (PM) concentration is responsible for reducing life expectancy by 3.2 years for 660 million Indians living in urban agglomerations.[39] In 2017, India had 18 percent of the global population but a share of 26 percent of global disability affected life years (DALY) attributable to air pollution.[40],[c]

As of 2016, India had 1887.6 DALYs per 100,000 individuals from ambient air pollution, as compared to 1088.62 in China and 419.59 in the US. Of the total 480·7 million (441·7–526·3) DALYs in India in 2017, 38·7 million (34·5–42·4) or 8·1% (7·1–9·0) were attributable to air pollution. In Delhi, total DALYs due to particulate matter concentration increased from 339296.03 to 750320.60 from average year 1995 to 2015[41]. The estimated economic cost of PM 10 pollution for Delhi, at a constant, 2005 price, increased from USD 2.714. billion to 6.394 billion from 1995 to 2015.[42]

Furthermore, Delhi residents could see 9.4 years added to their life expectancy if pollution were reduced to meet guidelines set by the World Health Organization (WHO).[43] This potential increase in life years would have been highest in north India that have a high dual burden of ambient particulate matter and household air pollution.

Health

Fine particles (PM2.5) pose the greatest health risk, as they are minuscule and can get deep into a person’s lungs and bloodstream.[44] Exposure to fine particles can affect lung function and worsen medical conditions such as asthma and heart disease.[45] Long-term exposure to fine particulate matter has been linked with an increased rate of chronic bronchitis, reduced lung function, and increased mortality from lung cancer and heart disease.[46] The Centre for Chest Surgery & Lung Transplantation at Sir Ganga Ram Hospital in Delhi has observed a disturbing trend of young, non-smoking individuals getting diagnosed for lung cancer for those who were admitted to the center. Indeed, the share of non-smokers with lung cancer has risen from just 10 percent in the 1980s to 50 percent in the last decade.[47] PM10 are particularly dangerous because these are particles in the air with a diameter of less than 10 micrometres, small enough to pass through the throat and nose and enter the lungs.[48] Inhalation of these particles can result in a number of health issues, ranging from coughing and wheezing to asthma attacks and bronchitis, as well as hypertension, heart diseases, strokes, and premature death.[49]

Economy

The economic cost of air pollution for India is extremely high. India spends around 1.28 percent of the GDP on health, while air pollution from burning fossil fuels results in the loss of 5.4 percent of the country’s India’s GDP.[50]

A report by the Indian Institute of Technology in Bombay has found that air pollution cost Delhi some US$10.66 billion in 2015 alone. Delhi reels from these economic costs as the territory is an essential destination for product manufacturing and enterprises and is one of the most lucrative places for foreign direct investment (FDI).[51],[d] According to the industry group ASSOCHAM, Delhi’s poor air quality could drive away top corporate heads and push work to other urban communities in India or abroad. This translates to increased difficulty in sourcing top-level talent in the NCR, increased costs for air purification systems and maintenance in office places and decreased workplace efficiency during periods of acute pollution due to employee sickness and absences.[52] For example, exposure to pollution from fossil fuels leads to around 490 million days of work absence due to illness.[53]

Environment

Air pollution, particularly sulphur and nitrogen emissions, as well as ground-level ozone—affects the ability of natural ecosystems to function and grow. In turn, the negative consequences on the environment affect human populations. For example, harmful concentrations of pollutants can directly enter drinking water through groundwater seepage. Air pollution also diminishes the ability of the ecosystem to capture carbon—a role that it plays in climate change mitigation.[54]

Impact of Ozone

One of the biggest environmental concerns posed by air pollution is the emission of ozone gas.[e] According to the air quality index (AQI), released everyday by the CPCB, ozone is emerging as a dominant pollutant along with PM, especially in the Delhi and NCR regions.[55] The non-government Centre for Science and Environment (CSE) tracked the daily ozone data released by the CPCB for Delhi and the National Capital Region (NCR) for the period April 1-June 15, 2019—when the capital witnessed a searing heat wave, and found that average ozone levels exceeded the prescribed standard of 16 percent of the days overall.[f],[56] While the eight-hour average standard for ozone exposure is 100 micrograms per cubic metre (cu. m.), the highest concentration in Delhi in 2019 was 122 micrograms per cu. M.[57]

Air pollution also results in acid rain and crop damage. The nitrogen oxide and sulfur oxides released in the environment as a result of burning fossil fuel form acids. These acids fall on Earth’s surface in either wet form (rain, snow, fog) or dry precipitation (gases and particulates). Acid rain damages trees and makes water unsuitable for aquatic life, and harms wildlife, too.[58] Ground-level ozone also affects the agricultural and forest yields, which further stuns the growth and sustainability of tree seedlings.[59]

Table 4: Effects of Air Pollution on Health and Environment[60]

Table 4a. Revised Indian National Air Quality Standards (INAQS)

Pollutants Time-weighted average Industrial, residential and other areas Ecologically sensitive area (notified by GoI)

Concentration of ambient air

PM10 (μg/m3) 24 h 100 100
PM2.5 (μg/m3) 24 h 60 60
SO2 (μg/m3) 24 h 80 80
NO2 (μg/m3) 24 h 80 80
O3 (μg/m3) 8 h 100 100
CO (mg/m3) 8 h 02 02
1 h 04 04
NH3 (μg/m3) 24 h 400 400

Source: CPCB (2015)

Table 4b. National AQI classes, range, health impacts and health breakpoints for the seven pollutants (scale: 0–500).

AQI class
(Range)
Health impact PM10
24 h
(μg/m3)
PM2.5
24 h
(μg/m3)
SO2
24 h
(μg/m3)
NO2
24 h
(μg/m3)
O3
8 h
(μg/m3)
CO
8 h
(mg/m3)
NH3
24 h
(μg/m3)

Concentration range

Good (0–50) Minimal impact 0–50 0–30 0–40 0–40 0–50 0–1 0–200
Satisfactory (51–100) Minor breathing discomfort to sensitive people 51–100 31–60 41–80 41–80 51–100 1.1–2 201–400
Moderately polluted (101–200) Breathing discomfort to the people with lung disease 101–250 61–90 81–380 81–180 101–168 2.1–10 401–800
Poor (201–300) Breathing discomfort to people on prolonged exposure 251–350 91–120 381–800 181–280 169–208 10–17 801–1200
Very poor (301–400) Respiratory illness to the people on prolonged exposure 351–430 121–250 801–1600 281–400 209–748* 17–34 1200–1800
Severe (401–500) Respiratory illness to the people on prolonged exposure >430 >250 >1600 >400 >748 >34 >1800

Source: CPCB (2015)

Table 4c. Mean concentrations and variation of criterion pollutants during 2nd March to 21st March (before the lockdown) and 25th March to 14th April (during the lockdown) in NCT Delhi, India.

Pollutants Type of station
Before lockdown During lockdown Overall variation
NCT Delhi avg. Industrial locations avg. Transport locations avg. Residential and other locations avg. NCT Delhi avg. Industrial locations avg. Transport locations avg. Residential and other locations avg. Net %
PM10 176.07 190.74 195.77 160.48 84.79 91.25 90.11 76.48 −91.28 −51.85
PM2.5 80.51 88.05 94.83 72.67 37.75 39.67 44.23 31.09 −42.76 −53.11
SO2 16.08 15.48 14.56 14.17 13.19 14.07 12.53 11.20 −2.89 −17.97
NO2 42.59 34.81 47.35 48.75 20.16 18.80 23.38 18.79 −22.44 −52.68
CO 1.03 1.33 1.13 1.01 0.72 1.04 0.71 0.64 −0.31 −30.35
O3 34.05 26.37 35.07 37.36 34.32 31.00 38.87 37.97 0.27 0.78
NH3 33.93 38.43 38.02 30.66 29.75 35.84 33.06 25.97 −4.18 −12.33
NAQI 185.99 196.38 215.29 174.78 72.64 92.45 87.29 79.8 −113.36 −60.95

Source: CPCB (2015)

Anti-Pollution Policy Measures: An Evaluation

Graded Response Action Plan (GRAP)

The Supreme Court in 2017 mandated the CPCB to come up with an emergency, comprehensive action plan, which was mapped out and submitted to it in December 2016. After proper analysis and deliberation, it was accepted, thus introducing the Graded Response Action Plan to the city of Delhi and the National Capital Region. The programme is referred to as a ‘graded’ plan, as it functions according to stages. There are specific actions to be taken for certain pollution concentration levels, which can bring about a gradual form of pollution control.[61]

There are various specified limits in the plan, dealing with air pollution levels or, in particular, the PM concentration. At any point in time, if the authorities determine that the concentration has reached or exceeded a certain level, proper actions to control the pollution from the source, which is specific to that level, will be taken immediately.[g]

So far, the steps taken by the authorities under the GRAP have not only been merely piecemeal; they are also largely delayed. The GRAP has not been implemented holistically in all parts of NCR. Moreover, the aspects of GRAP that were done came too late, when the pollution had already peaked.[62]

Table 5: Impact of Actions under GRAP based on Air Quality

Air Quality Index Policy and Regulatory Actions Inadequacies
Poor

(a)    ban on use of diesel generators sets

(b)   parking fees were to be enhanced

(c)    ) increase in frequency of bus and metro services

(a)    ban on use of diesel generators sets was affected only in Delhi but not in other NCR towns

(b)   parking fees were to be enhanced but not done due to non-finalisation of base charges

(c)    increase in frequency of bus and metro services was in-sufficient

Severe

(a)    blanket ban on hot-mix plants

(b)   ban on coal-based power plants

(a)    blanket ban on hot-mix plants came into effect late on November 2, 2019

(b)   ) ban on coal-based power plants not implemented in other towns of NCR — Delhi’s Badarpur power plant alone was shut towards end of October 2019

Emergency

a)      entry of trucks into Delhi (except those carrying essential commodities) to be banned

b)      blanket ban on construction activities came into effect

c)      odd-even scheme implementation

(a)    entry of trucks into Delhi (except those carrying essential commodities) should have been banned, but it was not implemented

(b)   blanket ban on construction activities came into effect only on November 5

(c)    odd-even scheme implemented only in Delhi (not entire NCR) and that too with many exemptions — for example, not enforced on about 70 lakh two-wheelers that account for two-thirds of the transport pollution produced

Source: ‘Why air pollution in Delhi-NCR hasn’t been tackled effectively’[63]

According to a study by the Delhi Integrated Multi-modal Transit System (DIMTS), the overall traffic on roads was only 2-percent less while the odd-even scheme was in place, and the average peak hour speed of vehicles increased by only 5 percent.[64]

Suggestions are now being made that the air pollution problem should be tackled throughout the year because even in the summer and rainy seasons pollution is in ‘moderate’ category. The imperative is for innovative thinking so that the solutions that are created are more holistic, long-term, and sustainable.

In early October this year, a Supreme Court-mandated body announced the implementation of GRAP beginning 15 October 2020, as well as a ban on the use of diesel generators, except for essential and emergency services in Delhi and the neighbouring cities of Ghaziabad, Noida, Greater Noida, Faridabad and Gurgaon.[65]

National Clean Air Program

In January 2019, the government launched the National Clean Air Program (NCAP), a five-year action plan to curb air pollution, build a pan-India air quality monitoring network, and improve citizen awareness.[66] The programme focuses on city-specific action plans that will be developed for 102 cities in India that exceed national air quality safeguards. It aims to reduce PM2.5 levels by 20-30 percent by 2024 (compared to 2017 levels).[67] The NCAP underlines the need for close collaboration and cross-sectoral coordination among central ministries, state governments, and local bodies.[68] The plan aligns with existing policies and programmes, including the National Action Plan on Climate Change, initiatives on electric vehicles, and the Smart Cities Mission.[69]

The NCAP also provides specific interventions for key sectors that are known to contribute to air pollution in many cities. These include re-suspended road dust control, construction and demolition related dust, power sector and industrial emissions, transport sector emissions, agricultural emissions, and emissions from unsustainable waste management practices. The NCAP has been allocated a budget of INR 300 crore/USD 42.6 million for the first two years.[70]

According to CarbonCopy’s NCAP dashboard (based on information obtained under the Right to Information Act), the CPCB has disbursed INR 280 crores to 28 cities that have failed to attain pollution limits, including Varanasi, Lucknow, Hyderabad, Mumbai, Kolkata and Bengaluru. Delhi has not made it into this list so far.[71]

So far, the spending on NCAP has been limited to expansion of air quality monitoring, source assessment studies, and dust-control measures. The latest Economic Survey conducted by the Government of India has highlighted spending by the Union government to control agricultural crop burning, as well as efforts in Delhi to recycle construction and demolition waste.[72] Moreover, there are significant questions that must be raised about this policy initiative. The absence of clarity on funding provisions, non-legal binding and lack of legal framework might dilute the effectiveness of the programme.

Odd-Even Scheme

The odd-even scheme is a traffic rationing measure begun by the Arvind Kejriwal-led Delhi government, under which private vehicles with registration numbers ending with an odd digit are allowed on roads on odd dates, and those with an even digit can ply on even dates.[73] The rules will also apply to vehicles with registration numbers obtained from other states but using Delhi roads.

In its introductory phase (1 to 15 January 2016), the odd-even scheme succeeded in curbing air pollution in Delhi.[74] At the time, Delhi experienced the lowest pollution peaks compared to previous high smog episodes in the winter season.[75] PM and nitrogen oxide load from cars dropped by as much as 40 percent while the scheme was operational. However, the second phase (15-30 April 2016) saw some counter-intuitive trends: air pollution levels dipped in the first nine days, but then spiked beginning 22 April. The PM2.5 levels increased by 23 percent and PM10 by 22 percent compared to the previous fortnight.[76]

According to air quality data for the second and third-round of the scheme (April 2016 and November 2017) accessed from Berkeley Earth, air quality in Delhi, in fact, deteriorated during the odd-even programme.[77] For instance, the average concentration of PM2.5 in Delhi during the second run of the drive from 1 to 15 April 2016 was 116 µg/m³ whereas it was 82 µg/m³ and 92 µg/m³ during the same period in 2017 and 2018, respectively when there was no special pollution control plan. Similarly, during the third round (13 to 17 November 2017), average PM2.5 stood at 218 µg/m³; it was 171 µg/m³ in 2016 and 140 µg/m³ in 2018 without any traffic restrictions.[78]

In spite of these numbers, the odd-even scheme was again implemented from 4 to 15 November 2019. An analysis of AQI statistics revealed that Delhi’s air quality did not improve during odd-even days that year: the average AQI from 4 to 15 November was 362, whereas in 2018, the average AQI for the same period in absence of odd-even was 335.[79] In other words, Delhi’s air quality was 8 percent worse in odd-even days compared to the previous year.[80]

For a city like Delhi which faces such a massive air pollution problem, the odd-even scheme is merely a stop-gap solution. Even then, the compliance from citizens poses a hurdle towards meeting the objectives. Instead of these temporary solutions, more permanent structures are required with a strong institutional setup.

Recommendations

Policy Initiatives

Control of ambient particulate matter pollution requires action in several sectors and the linkage of these actions for greatest impact. Various studies have estimated the contribution of different sources to PM pollution in Delhi, which can be useful in informing the efforts that are needed to address these sources.[81] Various government initiatives have been launched in the past few years to reduce air pollution.

Table 6: Policy Measures Undertaken by Union Ministries

Ministry Initiative
Ministry of Power a reduction in PM emissions by coal power plants, and in energy consumption by energy-intensive industries
Ministry of Environment setting emission standards for the brick manufacturing industry and facilitating management of agricultural residues to reduce stubble burning
Ministry of Road Transport and Highways Ministry of Petroleum and Natural Gas stricter vehicle emissions regulation and upgrading of vehicles to more fuel-efficient standards
Ministry of Urban Development enhancing availability of public transport

To deal with the problem of hazardous air quality, the AAP government in 2015 announced a series of steps towards improving urban transport system. With vehicular pollution being the most crucial issue in Delhi with up to 30 percent of particulate pollution, the government proposed to run more buses, restrict movement of trucks in the city, and introduce cleaner fuels for all vehicles.[82] With around 5,000 buses against the requirement of 15,000, the AAP government announced to acquire as many as 5,000 new buses and allow private operators to run 800 cluster buses to improve public transport.[83] State-specific policies such as use of compressed natural gas by commercial vehicles in Delhi, subsidies for alternative technologies to compost agricultural waste instead of burning it in Punjab, and mandatory use of fly ash bricks in the construction industry within 100 km from coal or lignite thermal plants in Maharashtra could be expanded to other states to efficiently control PM emissions.[84]

Another initiative is the Clean Air for Delhi Campaign launched in early 2018. It subsequently led to the launch of the National Clean Air Program that aims to sensitise the public and enhance coordination between the implementing agencies for control of air pollution. Other initiatives are encouraging, such as the Intended Nationally Determined Contributions aimed at reducing particulate matter emission intensity by 33–35 percent by 2030, the promotion of electric public transport fleets, and the upgrade of vehicles to Bharat Stage VI (which is equivalent to Euro-VI standard) vehicle emission standards.

Capacity Building

Public and media discussions on air pollution largely focus on the high ambient PM levels in north India in the winter season and the impacts on people’s health. Similar discussions are needed for the longer-term adverse health effects of chronically high pollution levels throughout the year.[85]

More awareness needs to be created among policymakers and the general public about the slow but substantial impact of ambient particulate matter and household air pollution. Government initiatives to reduce solid fuel use for tackling household air pollution include a scheme initiated by the prime minister in May 2016—the Pradhan Mantri Ujjwala Yojana, which aims to provide clean and safe cooking fuel (liquefied petroleum gas) to 50 million low-income households by March 2019.[86],[h] It targeted the addition of 10,000 distributors, increasing access, and covering nearly all the upfront costs of switching for low-income households.[87]

Another imperative is a viable public transport system strategy. While the Metro has provided massive relief to Delhi’s commuters, it is not viable for all economic classes. Therefore, Delhi needs an active bus service that runs on electricity.[88] Regardless of the high initial cost, such vehicles offer other advantages like low maintenance cost, longer service life and lower operational costs per kilometre. More importantly, they reduce pollution levels.[89]

Electric mobility is a definitive way towards cleaner air, without compromising functionality. Continuing with the ICE (internal combustion engine) vehicles in the same way as in the past would make it difficult to see a satisfactory AQI in Delhi. A shift to electric mobility is long-overdue in Delhi.[90]

Financing

The first year of NCAP (2019-20) was hobbled by its modest budget. In FY 2020, the newly-allocated performance-based grants linked to air quality from the 15th Finance Commission (FC) substantially increases the resources available to the large cities. On 1 February 2020, Union finance minister Nirmala Sitharaman in her Budget speech announced ₹4,400 crores ($600 million) for clean air in cities with a population of more than one million.[91] The fund was to be made available by the Ministry of Housing and Urban Affairs (MoHUA) to 46 cities across India. Soon after, the finance ministry published a document detailing the funds to be disbursed to these cities, with separate fund allocations for the Swachh Bharat Mission and air pollution mitigation.[92]

The Delhi government announced the much-awaited Delhi Electric Vehicle (EV) Policy on 7 August 2020. In order to address the high-upfront cost of EVs (ICE vehicles), the Delhi EV Policy provides demand incentives for purchasing electric two-wheelers, cars, auto-rickshaws, e-rickshaws, e-carts and goods carriers (L5N and N1 vehicles[i]).[93] The incentives—in the form of upfront purchase incentives, scrapping bonus[j], and loan interest waivers—help bring EVs to cost parity with their ICE counterparts. These incentives provided by the Delhi EV Policy are in addition to those outlined in the Faster Adoption and Manufacturing of Hybrid and Electric Vehicles (FAME II) scheme of the Union government. The scheme has a budget of INR 8,500 crore ($1.15 billion) for demand incentives for EVs from 2019–20 to 2021–22).[94] If the policy achieves its target of 25 percent registration of EVs in new vehicle sales by 2024, approximately 500,000 EVs of various kinds will be operating in the city.[95] This would translate to a reduction of 159 tonnes of PM 2.5 in Delhi and a reduction of 4.8 million tonnes of CO2 emissions, equivalent to avoiding CO2 emissions from nearly 100,000 petrol cars over their lifetime.[96]

Effective utilisation of these funds needs significantly greater efforts by state and municipal governments to engage with civil society in prioritising actions. Further, the grants need to be sustained over the 2021-26 period of the 15th FC and shift together with NCAP towards managing air quality at the regional level.[97] At the same time, investments in sustainable infrastructure, and improvements in public services that will lead to cleaner air will need to be undertaken along with developing the knowledge base on sources and air quality monitoring.[98]

Conclusion

The restrictions on non-essential movement in the first few months of the COVID-19 pandemic led to a significant decline in air pollution levels across India. It helped achieve 95 percent of National Clean Air Program targets for 2024 in just 74 days in Delhi, Mumbai, Kolkata and Chennai,[99] as emissions from the transport, construction and industrial sectors almost stopped and those from power plants reduced significantly.[100] Air pollution, however, is not a one-time, short-term crisis; it is a recurring problem that requires long-term, holistic solutions. If the lockdown showed anything, it is that air pollution levels can be brought down dramatically if India focuses its energy towards a green recovery model that is less emissions-intensive.

In the post-COVID-19 era, the urgency of reviving the economy must not sideline the implementation of NCAP. The key mitigation measures will reduce greenhouse gas emissions and thereby provide opportunities for climate co-benefits. These include transitioning to cleaner fuel for household use that would eradicate household emissions, switching to Bharat Stage VI vehicles and fuels, strict compliance for industrial, power plant and brick kiln emissions, and a sustained programme to stop open crop-waste burning. In the long term, NCAP also needs to be scaled-up in a significant manner to ensure that rapid economic growth and meeting National Ambient Air Quality Standards (NAAQS) are aligned.[101]

While current ambient PM2.5 monitoring in Delhi reveals high levels in urban areas, remote sensing, comprehensive air quality modeling, and emission inventories suggest large-scale excess above the NAAQS, also in rural areas.[102] It is important to coordinate urban-rural and inter-state responses, as emissions from urban and rural regions compound one another.[103] While the measures that have been taken by the Union and state governments have sought to address many of the key issues related to Delhi’s toxic air, the challenge is complex and will require sustained, multi-sectoral approaches that will be implemented over the long term.


About the Author

Arpan Chatterji is a Research Intern at ORF. He is a student of Resource Economics at the University of Massachusetts Amherst.


Endnotes

[a] Or petcoke, which is solid-carbon, coal-like material that results from oil refining. Cheaper fuels release significantly higher quantities of greenhouse gas emissions than coal and pose greater risks to health and environment.

[b] The critically polluted towns in Delhi’s neighbouring states, namely Uttar Pradesh, Haryana, and Rajasthan, are Mathura, Kanpur, Moradabad, Varanasi and Bulandshahr, Agra, Firozabad and Ghaziabad in Uttar Pradesh, Gurgaon in Haryana and Bhiwadi in Rajasthan. They continue to rely on cheaper and highly pollutive fuels, and have inadequate air quality monitoring mechanisms.

[c] DALYs refers to the sum of years of potential life lost due to premature mortality and the years of productive life lost due to disability. Firstly, the burden of disease is calculated by first combining information on the increased (or relative) risk of a disease resulting from exposure, with information on how widespread the exposure is in the population (in this case, the annual mean concentration of particulate matter to which the population is exposed). This allows calculation of the ‘population attributable fraction’ (PAF), which is the fraction of disease seen in a given population that can be attributed to the exposure, in this case the annual mean concentration of particulate matter. Applying this fraction to the total burden of disease (e.g. cardiopulmonary disease expressed as deaths or DALYs), gives the total number of deaths or DALYs that results from ambient air pollution.

[d] Delhi-NCR has a high number of global assignments, worldwide partnership workplaces, and fills in as a set up IT-BPM center, am industry whose workforce puts a high premium on everyday environments.

[e] Ozone gas occurs both on the ground level and Earth’s upper atmosphere (stratosphere). It is a highly reactive gas that merits short duration standard of only one hour to eight hours average, as opposed to 24-hour average for other pollutants.

[f] In the same period in 2018, it was 5 percent of the days overall.

[g] For instance, if PM reaches 100 micrograms per cubic meter, actions that have been identified for that level will begin, such as mechanised cleaning of roads and sprinkling of water.

[h] Liquefied petroleum gas meets the International Standards Organization and WHO recommendations for indoor air quality and can potentially help in achieving the WHO air quality standards within homes, but adoption and sustained use of clean fuels by households will be needed. The original target of 50 million households was met in August 2018, and the government has now increased the target to reach 80 million households through this scheme with a total budget of US$1·8 billion.

[i] L5N vehicles refer to three-wheel motor vehicles with a maximum speed exceeding 25kmph and motor power exceeding 0.25 kW. Their maximum weight is 1500 kilograms. N1 vehicles are light goods vehicles (maximum weight up to 3,500kgs).

[j] A scrapping bonus is a part of a government budget programme to promote the replacement of old vehicles with modern vehicles. In this scenario, people who own old vehicles are given a bonus to scrap their old vehicles for newer, more efficient vehicles.

[1] Sumit Sharma, Sumit Kumar Gautam, “Vehicular Emissions and Air Quality in India,” TERI, 2018

[2] Aidan Farrow, Kathryn A Miller and Lauri Myllyvirt. “Toxic Air: The Price of Fossil Fuels,” February 2020. Greenpeace Southeast Asia

[3] Sarath Guttikunda, “Air pollution in Indian cities: Understanding the causes and the knowledge gaps,” Centre for Policy Research, December 14, 2017.

[4] ‘A new wave of air pollution crises: what can be done?’, UN Environment Programme, November 13, 2019, https://www.unenvironment.org/news-and-stories/story/new-wave-air-pollution-crises-what-can-be-done

[5] Zhao, Pengjun, “Sustainable urban expansion and transportation in a growing megacity: Consequences of urban sprawl for mobility on the urban fringe of Beijing.” Habitat International 34, no. 2 (2010): 236-243.

[6] ‘Delhi pollution: Is air quality in the Indian capital now improving?’ BBC News, November 6, 2019, https://www.bbc.com/news/world-asia-india-49729291

[7] ‘ Haze Smothers Northern India’, NASA Earth Observatory, November 6, 2019, https://earthobservatory.nasa.gov/images/145827/haze-smothers-northern-india

[8] Srivastava S, Kumar A, Bauddh K, Gautam AS, Kumar S, ‘21-Day Lockdown in India Dramatically Reduced Air Pollution Indices in Lucknow and New Delhi, India’. Bull Environ Contam Toxicol. 2020;105(1):9-17. doi:10.1007/s00128-020-02895-w

[9] Pippa Neill, ‘Air pollution drops to record low in India following lockdown’, Air Quality News, March 30, 2020, https://airqualitynews.com/2020/03/30/air-pollution-drops-to-record-low-in-india-following-lockdown/

[10] Kritika Bansal, ‘Delhi Pollution: Air Quality Improves Marginally But Remains in Poor Category’, India.com, October 14, 2020, https://www.india.com/news/india/delhi-pollution-air-quality-index-smog-poor-category-4172532/

[11] ‘Delhi air quality: Lockdown cuts PM2.5, PM10 levels by half in national capital’, Financial Express, April 23, 2020, https://www.financialexpress.com/lifestyle/science/delhi-air-quality-lockdown-cuts-pm2-5-pm10-levels-by-half-in-national-capital/1937784/

[12] Surbhi Bhardwaj, ‘Lockdown Reduced Pollution In Delhi Temporarily, Long-Term Relief Needs Policy Changes’, IndiaSpend, June 24, 2020, https://www.indiaspend.com/lockdown-reduced-pollution-in-delhi-temporarily-long-term-relief-needs-policy-changes/

[13] Vatsala Shrangi, Soumya Pillai, ‘Air pollution dipped by 79% during lockdown in Delhi, on rise again’, Hindustan Times, June 6, 2020, ‘https://www.hindustantimes.com/cities/air-pollution-dipped-by-79-during-lockdown-in-delhi-on-rise-again/story-IiYzv36wFsqgnxQ7EdRWsJ.html

[14] Aarushi Koundal, ‘COVID-19 lockdown: Air quality in India’s major industrial cities improve by up to 60% compared to last year’, Economic Times, April 1, 2020, https://energy.economictimes.indiatimes.com/news/oil-and-gas/covid-19-lockdown-air-quality-in-indias-major-industrial-cities-improve-by-up-to-60-compared-to-last-yr/74931010

[15] Cheena Kapoor, ‘Air quality in India’s capital hits 8-month low’, AA, October 17, 2020, https://www.aa.com.tr/en/asia-pacific/air-quality-in-indias-capital-hits-8-month-low/2009820

[16] Singh, Siddharth, ‘The Great Smog of India’. Penguin Random House India Private Limited, 2018.

[17] Surbhi Bhardwaj, ‘Lockdown Reduced Pollution In Delhi Temporarily, Long-Term Relief Needs Policy Changes’

[18] Mahato, Susanta & Pal, Swades & Ghosh, Krishna (2020), ‘Effect of lockdown amid COVID-19 pandemic on air quality of the megacity Delhi, India’. Science of The Total Environment. 730. 139086. 10.1016/j.scitotenv.2020.139086

[19] Rumi Aijaz, ’The Herculean task of improving air quality: The case of Delhi and NCR’, ORF, https://www.orfonline.org/research/the-herculean-task-of-improving-air-quality-the-case-of-delhi-and-ncr-45459/

[20] Jethva, Hiren T., Duli Chand, Omar Torres, Pawan Gupta, Alexei Lyapustin, and Falguni Patadia, “Agricultural burning and air quality over northern India: a synergistic analysis using NASA’s A-train satellite data and ground measurements.” Aerosol and Air Quality Research 18, no. PNNL-SA-125481 (2018).

[21] Singh, Raghuveer, Dharam Bir Yadav, N. Ravisankar, Ashok Yadav, and Harpreet Singh, “Crop residue management in rice–wheat cropping system for resource conservation and environmental protection in north-western India.” Environment, Development and Sustainability 22, no. 5 (2020): 3871-3896.

[22] Sruthijith K K, ‘Delhi’s geography is truly cursed: Siddharth Singh, author of ‘The Great Smog of India’, Economic Times, November 19, 2019, https://economictimes.indiatimes.com/news/politics-and-nation/delhis-geography-is-truly-cursed-siddharth-singh-author-of-the-great-smog-of-india/articleshow/71985697.cms?from=mdr

[23] Lynn Jenner, ‘Smoke and haze continue to shroud most of India’, India Climate Dialogue, December 11, 2019, https://indiaclimatedialogue.net/2019/12/11/smoke-and-haze-continues-to-shroud-most-of-india/

[24] Jayashree Nandi, ‘Delhi surrounded by critically polluted industrial clusters, finds CPCB study’, Hindustan Times, November 22, 2019, https://www.hindustantimes.com/india-news/delhi-surrounded-by-critically-polluted-industrial-clusters-finds-cpcb-study/story-MSJj1Mwrep7aOMqE7dnB4L.html

[25] Srishti Choudhary, ‘Why is Delhi’s air so toxic?’, Livemint, November 3, 2019 https://www.livemint.com/news/india/why-is-delhi-s-air-so-toxic-11572782475997.html

[26] Dezan Shira et al, ‘Delhi’s Pollution Crisis and its Impact on Business’, Corporate Livewire, December 6, 2017, https://www.corporatelivewire.com/top-story.html?id=delhis-pollution-crisis-and-its-impact-on-business

[27] Samanwaya Rautray, ‘Supreme Court bans use of Pet Coke, furnace oil in Delhi-NCR’, Economic Times, October 25, 2017, https://economictimes.indiatimes.com/news/politics-and-nation/india-bans-use-of-dirtier-coal-alternative-in-new-delhi/articleshow/61205059.cms?from=mdr

[28] Bhandarkar, Shivaji, “Vehicular pollution, their effect on human health and mitigation measures.” Veh. Eng 1, no. 2 (2013): 33-40.

[29] Pankaj Jain, ‘Delhi pollution: Vehicles, not stubble burning, main cause, says Teri study’, India Today, November 1, 2018, https://www.indiatoday.in/india/story/delhi-pollution-vehicles-not-stubble-burning-main-cause-says-teri-study-1380557-2018-11-01

[30] ‘Number of vehicles on Delhi roads over 1 crore, with more than 70 lakh two wheelers: Economic survey’, Economic Times, February 23, 2019, https://auto.economictimes.indiatimes.com/news/industry/number-of-vehicles-on-delhi-roads-over-1-crore-with-more-than-70-lakh-two-wheelers-economic-survey/68128444’

[31] ‘Number of vehicles on Delhi roads over 1 crore, with more than 70 lakh two wheelers: Economic survey’

[32] ‘10.9 mn vehicles on Delhi roads, more than 7 mn two-wheelers: Report’, Business Standard, February 23, 2019, https://www.business-standard.com/article/pti-stories/number-of-vehicles-on-delhi-roads-over-1-crore-with-more-than-70-lakh-two-wheelers-economic-survey-119022300523_1.html

[33] Vishwa Mohan, ‘Why vehicular emissions are a constant in anti-pollution fight in Delhi’, Times of India, November 4, 2019, https://timesofindia.indiatimes.com/city/delhi/why-vehicular-emissions-are-a-constant-in-anti-pollution-fight/articleshow/71883289.cms

[34] Rizwan, S., Nongkynrih, B., & Gupta, S. K. (2013), “Air pollution in Delhi: Its Magnitude and Effects on Health”. Indian Journal of Community Medicine 38(1), 4–8. https://doi.org/10.4103/0970-0218.106617

[35] https://indianexpress.com/article/explained/explained-how-brick-kilns-contribute-to-rising-pollution-6124992/

[36] Bhat, Mohd Yousuf, “Environmental Problems of Delhi and Governmental Concern,” in Global Issues and Innovative Solutions in Healthcare, Culture, and the Environment, pp. 133-167. IGI Global, 2020.

[37] Ishita Jalan and Hem H. Dholakia (2019), ‘What is Polluting Delhi’s Air? Understanding Uncertainties in Emissions Inventory’, March.

[38] Abelsohn, A., & Stieb, D. M. (2011), ‘Health effects of outdoor air pollution: approach to counseling patients using the Air Quality Health Index’. Medecin de famille canadien, 57(8), 881–e287.

[39] Cohen, Aaron J., Michael Brauer, Richard Burnett, H. Ross Anderson, Joseph Frostad, Kara Estep, Kalpana Balakrishnan et al, “Estimates and 25-year trends of the global burden of disease attributable to ambient air pollution: an analysis of data from the Global Burden of Diseases Study 2015.” The Lancet 389, no. 10082 (2017): 1907-1918.

[40] Balakrishnan, Kalpana, Sagnik Dey, Tarun Gupta, R. S. Dhaliwal, Michael Brauer, Aaron J. Cohen, Jeffrey D. Stanaway et al, “The impact of air pollution on deaths, disease burden, and life expectancy across the states of India: the Global Burden of Disease Study 2017.” The Lancet Planetary Health 3, no. 1 (2019): e26-e39.

[41] Balakrishnan et al, “The impact of air pollution on deaths, disease burden, and life expectancy across the states of India: the Global Burden of Disease Study 2017.”

[42] Maji, Kamal Jyoti, Anil Kumar Dikshit, and Ashok Deshpande, “Disability-adjusted life years and economic cost assessment of the health effects related to PM 2.5 and PM 10 pollution in Mumbai and Delhi, in India from 1991 to 2015.” Environmental Science and Pollution Research 24, no. 5 (2017): 4709-4730.

[43] Alberini, Anna, Maureen Cropper, Nathalie B. Simon, and P. K. Sharma, ‘The health effects of air pollution in Delhi, India’. The World Bank, 1997.

[44] Kaiser, Jocelyn, “Mounting evidence indicts fine-particle pollution.” Science 307, no. 5717 (2005): 1858a-1861a.

[45] ‘Fine Particles (PM 2.5) Questions and Answers’, New York State Department of Health, December 14, 2020 https://www.health.ny.gov/environmental/indoors/air/pmq_a.htm

[46] Jiang, X. Q., Mei, X. D., & Feng, D. (2016), ‘Air pollution and chronic airway diseases: what should people know and do?’. Journal of Thoracic Disease 8(1), E31–E40. https://doi.org/10.3978/j.issn.2072-1439.2015.11.50

[47] ‘Finding a link between rising lung cancer incidence and air pollution’, Qrius, January 10, 2020,

[48] Bhattacharya, Sayantani, S. Sridevi, and R. Pitchiah, “Indoor air quality monitoring using wireless sensor network,” in 2012 Sixth International Conference on Sensing Technology (ICST), pp. 422-427. IEEE, 2012.

[49] Zhang, Xuelei, Lijing Zhao, Daniel Q. Tong, Guangjian Wu, Mo Dan, and Bo Teng. “A systematic review of global desert dust and associated human health effects.” Atmosphere 7, no. 12 (2016): 158.

[50] Farrow et al, “Toxic Air: The Price of Fossil Fuels”

[51] Srinivas Raman, ‘Delhi’s Air Pollution and its Impact on Business’, India Briefing, November 12, 2019, https://www.india-briefing.com/news/delhis-pollution-crisis-impact-business-15631.html/

[52] Vrishti Beniwal, ‘The intangible costs that Delhi’s dirty air carries for a slowing economy’, Economic Times, November 19, 2019, https://economictimes.indiatimes.com/news/economy/indicators/the-intangible-costs-that-delhis-dirty-air-carries-for-a-slowing-economy/articleshow/72119726.cms?from=mdr

[53] Farrow et al, “Toxic Air: The Price of Fossil Fuels”

[54]‘Air pollution, ecosystems and biodiversity’, UNECE, December 14, 2020, https://unece.org/air-pollution-ecosystems-and-biodiversity

[55] Datta, Divya, and Shilpa Nischal. Looking Back to Change Track. The Energy and Resources Institute (TERI), 2010.

[56] ‘CSE says ozone pollution has increased in Delhi this summer because of heatwave’, CSE India, June 19, 2019, https://www.cseindia.org/cse-says-ozone-pollution-has-increased-in-delhi-this-summer-because-of-heatwave-9513

[57] ‘CSE says ozone pollution has increased in Delhi this summer because of heatwave’

[58] Saxena, Pallavi, and Saurabh Sonwani, “Primary criteria air pollutants: environmental health effects,” in Criteria Air Pollutants and their Impact on Environmental Health, pp. 49-82. Springer, Singapore, 2019.

[59] Dennis R Decoteau, “Principles of plant science.” Environmental Factors and Technology in Growing Plants (2005): 49-66.

[60] Mahato, Susanta, Swades Pal, and Krishna Gopal Ghosh, “Effect of lockdown amid COVID-19 pandemic on air quality of the megacity Delhi, India.” Science of the Total Environment (2020): 139086.

[61] ‘Graded Response Action Plan: The Solution to Delhi’s Air Pollution’, AQI, November 9, 2018, https://www.aqi.in/blog/graded-response-action-plan-grap-the-solution-to-delhis-air-pollution/

[62] PP Sangal, “Why air pollution in Delhi-NCR hasn’t been tackled effectively,” The Hindu, March 6, 2020, https://www.thehindubusinessline.com/opinion/why-air-pollution-in-delhi-ncr-hasnt-been-tackled-effectively/article31081532.ece

[63] PP Sangal, “Why air pollution in Delhi-NCR hasn’t been tackled effectively”

[64] PP Sangal, “Why air pollution in Delhi-NCR hasn’t been tackled effectively”

[65] “Explained: What is GRAP, Delhi-NCR’s action plan as air pollution increases?,” Indian Express, October 11, 2020, https://indianexpress.com/article/explained/explained-what-is-grap-delhi-ncrs-action-plan-as-air-pollution-increases-6719746/

[66] Gupta, Anchal. “National Clean Air Programme of India: Challenge and Strategies.” (2020).

[67] Anjali Jaiswal, “India Launches a National Clean Air Program,” NRDC, January 18, 2019 https://www.nrdc.org/experts/anjali-jaiswal/india-launches-national-clean-air-program

[68] Anjali Jaiswal, “India Launches a National Clean Air Program”

[69] Anjali Jaiswal, “India Launches a National Clean Air Program”

[70] Anjali Jaiswal, “India Launches a National Clean Air Program”

[71] https://www.huffingtonpost.in/entry/what-happened-to-national-clean-air-plan_in_5e20226ec5b674e44b92d187 (Huffington Post closed down in India after November 24, 2020)

[72] Anumita Roychowdhury, ‘Union Budget 2020-21 promises Rs 4,400 cr for clean air; how, where and how soon?’, DownToEarth, February 2, 2020, https://www.downtoearth.org.in/blog/air/union-budget-2020-21-promises-rs-4-400-cr-for-clean-air-how-where-and-how-soon–69119

[73] Ashutosh Mishra, ‘Delhi odd-even scheme begins as air quality dips to 3-year low’, India Today, November 4, 2019, https://www.indiatoday.in/india/story/delhi-odd-even-scheme-to-start-today-as-air-quality-dips-to-3-year-low-1615420-2019-11-04

[74] Rohan Gupta, ‘Odd-even scheme: Before Delhi starts third leg, let’s see how the last two went,’ DownToEarth, September 13, 2019, https://www.downtoearth.org.in/news/air/odd-even-scheme-before-delhi-starts-third-leg-let-s-see-how-the-last-two-went-66721

[75] Center for Science and Environment, “Delhi has lost the air quality gains of odd and even scheme. Delayed winter will make pollution worse if quicker steps are not taken to sustain the gains, says CSE,” January 21, 2016, https://www.cseindia.org/delhi-has-lost-the-air-quality-gains-of-odd-and-even-scheme–delayed-winter-will-make-pollution-worse-if-quicker-steps-are-not-taken-to-sustain-the-gains-says-cse-6222

[76] Center for Science and Environment, “Delhi has lost the air quality gains of odd and even scheme. Delayed winter will make pollution worse if quicker steps are not taken to sustain the gains, says CSE”

[77] Berkeley Earth. 2018, “Air Quality Real-time Map.” Available at: http://berkeleyearth.org/air-quality-real-time-map/

[78] Sayantan Ghosh, ‘Clearing the Air: Why Delhi Needs the Odd-Even Scheme to Fight Pollution’, News18 India, November 12, 2019, https://www.news18.com/news/india/clearing-the-air-why-delhi-needs-the-odd-even-scheme-to-fight-pollution-2383473.html

[79] Nikhil Rampal, ‘Odds against odd-even, scheme could not improve Delhi’s air’, India Today, November 20, 2019, https://www.indiatoday.in/diu/story/odds-against-odd-even-scheme-could-not-improve-delhi-s-air-1620985-2019-11-20

[80] Dutta, Abhishek, and Wanida Jinsart, “Air Quality, Atmospheric Variables and Spread of COVID-19 in Delhi (India): An Analysis.” Aerosol and Air Quality Research 20.

[81] Gordon, Terry, Kalpana Balakrishnan, Sagnik Dey, Sanjay Rajagopalan, Jonathan Thornburg, George Thurston, Anurag Agrawal et al, “Air pollution health research priorities for India: Perspectives of the Indo-US Communities of Researchers.” Environment International 119 (2018): 100.

[82] Bhavyata Mahajan, ‘Why Delhi’s air pollution mission is in need of bipartisan politics’, ORF, April 10, 2020, https://www.orfonline.org/expert-speak/why-delhis-air-pollution-mission-is-in-need-of-bipartisan-politics-64392/

[83] Bhavyata Mahajan, ‘Why Delhi’s Air Pollution Mission Is In Need Of Bipartisan Politics – Analysis’, Eurasia Review, April 11, 2020, https://www.eurasiareview.com/11042020-why-delhis-air-pollution-mission-is-in-need-of-bipartisan-politics-analysis/

[84] India State-Level Disease Burden Initiative Air Pollution Collaborators (2019), ‘The impact of air pollution on deaths, disease burden, and life expectancy across the states of India: the Global Burden of Disease Study 2017’. The Lancet Planetary Health, 3(1), e26–e39. https://doi.org/10.1016/S2542-5196(18)30261-4

[85] Manisalidis, I., Stavropoulou, E., Stavropoulos, A., & Bezirtzoglou, E. (2020), ‘Environmental and Health Impacts of Air Pollution: A Review’. Frontiers in Public Health, 8, 14. https://doi.org/10.3389/fpubh.2020.00014

[86] Pillarisetti, Ajay, Dean T. Jamison, and Kirk R. Smith, “Household energy interventions and health and finances in Haryana, India: an extended cost-effectiveness analysis.” 2017.

[87] Puzzolo, E., H. Zerriffi, E. Carter, H. Clemens, H. Stokes, P. Jagger, J. Rosenthal, and H. Petach, “Supply considerations for scaling up clean cooking fuels for household energy in low‐and middle‐income countries.” GeoHealth 3, no. 12 (2019): 370-390.

[88] Randhir Gupta, ‘Why Delhi needs e-buses’, DownToEarth, March 27, 2018, https://www.downtoearth.org.in/blog/air/why-delhi-needs-e-buses-60035

[89] Gorham, Roger, ‘Air pollution from ground transportation: an assessment of causes, strategies and tactics, and proposed actions for the international community’. Tournesol Conseils, 2002.

[90] Sandeep Bangia, ‘New-age mobility: Accelerating the transition to electric — three suggestions,’ Financial Express, June 22, 2020, https://www.financialexpress.com/opinion/new-age-mobility-accelerating-the-transition-to-electric-three-suggestions/1998752/

[91] Anulekha Ray, ‘Nirmala Sitharaman suggests a ₹4,400 crore solution to Delhi pollution in Budget 2020’, Livemint, February 2, 2020, https://www.livemint.com/budget/news/budget-2020-sitharaman-has-a-rs-4-400-crore-solution-to-delhi-pollution-11580555466822.html

[92] ‘Budget 2019: Pollution control in focus, Environment Ministry gets Rs 2,954 crore’, Economic Times, July 5, 2019, https://economictimes.indiatimes.com/news/economy/policy/budget-2019-pollution-control-in-focus-environment-ministry-gets-rs-2954-crore/articleshow/70095085.cms?from=mdr

[93]  Akshima Ghate, Dimpy Suneja, ‘Delhi EV policy’s twin boost: Faster EV adoption and improved air quality’, RMI India, August 27, 2020 https://rmi-india.org/delhi-ev-policys-twin-boost-faster-ev-adoption-and-improved-air-quality/

[94] ‘Govt notifies FAME-II scheme for clean mobility; to be rolled out from April’, Economic Times, March 0, 2019, https://auto.economictimes.indiatimes.com/news/industry/govt-notifies-fame-ii-scheme-for-clean-mobility-to-be-rolled-out-from-april/68324899

[95] Akshima Ghate, Dimpy Suneja, “Delhi EV policy’s twin boost: Faster EV adoption and improved air quality,” CNBC, August 27, 2020, https://www.cnbctv18.com/auto/delhi-ev-policys-twin-boost-faster-ev-adoption-and-improved-air-quality-6754021.htm

[96] Akshima Ghate, Dimpy Suneja, “Delhi EV policy’s twin boost: Faster EV adoption and improved air quality”

[97] Santosh Harish, Shibani Ghosh, ‘The interplay between the pandemic and pollution | Analysis’, Hindustan Times, July 16, 2020, https://www.hindustantimes.com/analysis/the-interplay-between-the-pandemic-and-pollution/story-dk5zkame5pnMXskSLM6MQJ.html

[98] Abhijith, K. V., Prashant Kumar, John Gallagher, Aonghus McNabola, Richard Baldauf, Francesco Pilla, Brian Broderick, Silvana Di Sabatino, and Beatrice Pulvirenti, “Air pollution abatement performances of green infrastructure in open road and built-up street canyon environments–A review.” Atmospheric Environment 162 (2017): 71-86.

[99] Esha Roy, ‘Air pollution dropped significantly during 74-day lockdown period: Study’, Indian Express, July 4, 2020, https://indianexpress.com/article/india/drastic-fall-in-pollution-during-74-days-of-lockdown-analysis-6488906/

[100] Sagnik Dey, Joshua Apte, ‘Clean air can help minimise risks of Covid infections as the economy opens up’, Indian Express, June 29, 2020.

[101] ‘India’s pollution control policies unlikely to improve air quality: Study’, Outlook India, March 31, 2019.

[102] ‘More than 670 million Indians would breathe poor quality air in 2030 despite compliance with pollution control policies: CEEW-IIASA study’, CEEW, March 29, 2019.

[103] ‘India’s pollution control policies unlikely to improve air quality: Study’, Economic Times, March 31, 2019.

The views expressed above belong to the author(s). ORF research and analyses now available on Telegram! Click here to access our curated content — blogs, longforms and interviews.

Author

Arpan Chatterji

Arpan Chatterji

Arpan Chatterji is a Research Intern at ORF. He is a student of Resource Economics at the University of Massachusetts Amherst.

Read More +

Related Search Terms

Contributors

Arpan Chatterji

Arpan Chatterji