 This article is part of the series — World Population Day.
Climate change is no longer a distant threat. The urgency of tackling it has become even more palpable as the disruption to life and the economy caused by it is expected to worsen in the future. An accurate assessment of the primary factors that are responsible for and drive this phenomenon will guide the formulation of both global and national climate policies. As the window for bending the temperature curve to 1.5 degrees Celsius is fast closing, the world needs to get its strategy for climate change mitigation right. This is incumbent on the Green House Gas (GHG) emissions
peaking by 2025 and being halved by 2030 and reaching net zero by 2050.
For a long time, scientists have relied on the “
Kaya Identity” for explicating the behaviour of global Carbon dioxide (CO
2) emissions. According to this identity, emissions are a product of population, per capita GDP, energy used per unit of GDP and CO
2 generated per unit of energy. Clearly, the Kaya identity stipulates a positive correlation between population and emissions. According to the third instalment of the sixth assessment report published by the Intergovernmental Panel on Climate Change (IPCC) on climate change mitigation, trends since 1990 persisted during 2010-2019 with population growth responsible for a 1.2-
percent annual increase in emissions.
Nevertheless, this positive relationship between population and climate change does not
enjoy unanimous consensus. There are those who believe that higher levels of the population do not necessarily entail higher emissions. According to this opinion, suggesting a straightforward positive relationship between population and climate change ignores the influence of income inequality on the interaction between population and emission levels. The objective of this article is to delve deeper into this debate on the basis of some simple data analysis.
 Source: FIGURE 1: Climate Watch, World Bank data
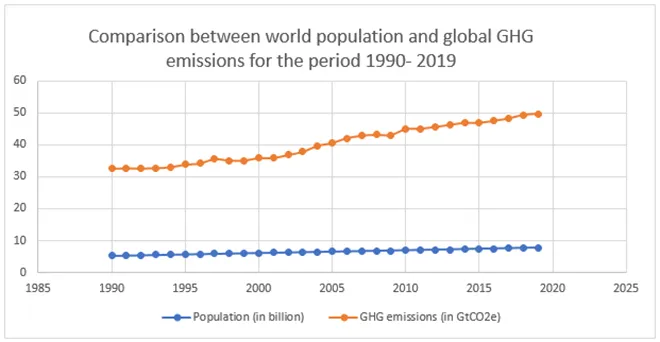
Figure 1 presents a graphical comparison between levels of world population and global GHG emissions during the period 1990–2019. The figure demonstrates that as the population increases, so does the level of global GHG emissions. However, it is evident from the graph that the rate of increase in GHG emissions exceeds the rate of increase in population. It appears that prima facie, the increase in population is accompanied by an increase in emission levels.
The following table which presents the regional trends in population growth and increase in CO
2 emissions helps in gaining clarity on how population increase affects increase in emissions.
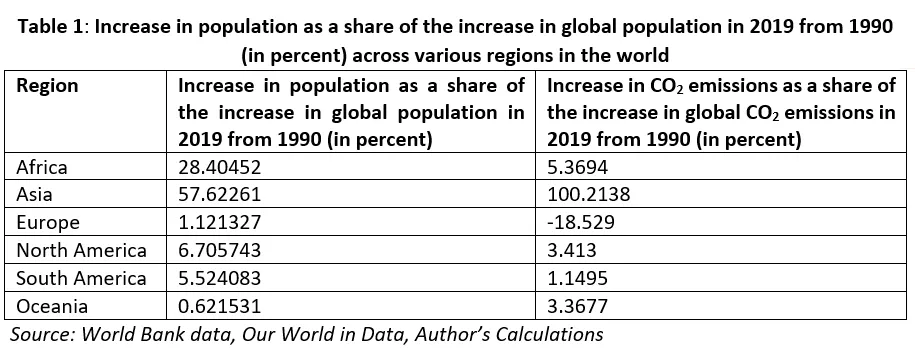
It is clear from Table 1 that population increase is not always accompanied by an increase in CO
2 emissions. The interaction of population growth and change in CO
2 emissions in the context of Europe is a case in point. Also, the share of the increase in population is not proportionate to the share of the increase/decrease in CO
2 emissions. In the case of Asia, its share of the increase in global CO
2 emissions is almost twice its share of the increase in the global population. Other regions behave in a contrary manner. For example, while Africa accounts for 28 percent of the share of the increase in global population, it is responsible for a five percent share of the increase in global CO
2 emissions.
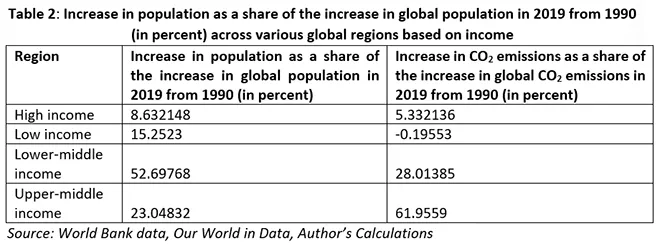
The above table presents the implications of grouping nations on the basis on their income for the interaction between population growth and increase in CO
2 emissions. As illustrated by the case of low-income countries, an increase in population in not necessarily entailed by a growth in CO
2 emissions. The share of lower middle-income countries in increase in global CO
2 emissions is only a little more than half of their share in the increase in global population. The share of upper-middle income countries in the growth of global CO
2 emissions is almost thrice its share in the increase in global population.
 Source: Figure 2: World bank data, Our World in Data, Author’s Calculations
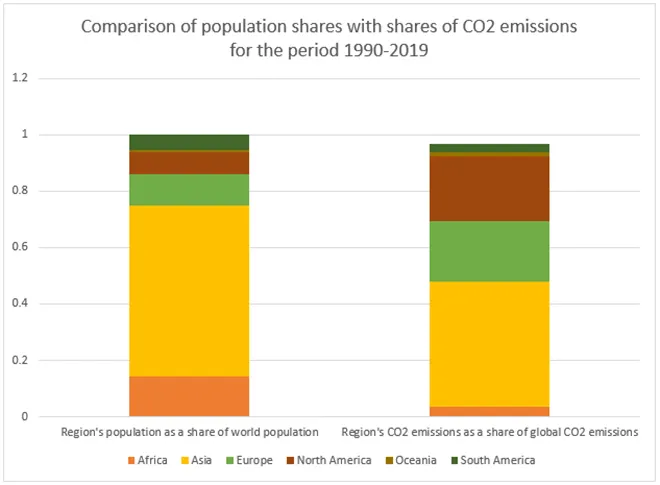
Figure 2, the share of cumulative CO
2 emissions for the period 1990–2019 of a region in global cumulative CO
2 emissions are juxtaposed with the share of cumulative population of that region in total cumulative global population. Cumulative CO
2 emissions have been arrived at by adding annual emissions for the period 1990–2019. This metric informs us about the total contribution of a region to climate change for the period in question. Similarly, the cumulative population is obtained as the sum of the annual population in each year for the period 1990–2019. The analysis attempts to understand how a region’s CO
2 emissions in a particular year are influenced by that region’s total population for that year. The above graphical comparison based on cumulative figures seeks to aggregate this influence over time and captures the interaction between population and emission for a larger time frame.
Asia, which accounts for the largest share (60.5 percent) of cumulative global population from 1990–2019, is also responsible for the largest fraction (44.4 percent) of cumulative global CO
2 emissions during this period. However, this relationship does not hold for other regions. For example, Africa which is inhabited by 14 percent of the cumulative global population accounts for a mere three percent of cumulative global CO
2 emissions. Europe, which has a lower share (11 percent) in cumulative global population, is responsible for seven times Africa’s share in cumulative global emissions. Similarly, while North America accounts for just half of Africa’s share of population, it represents more than seven times the share of Africa’s emission levels. Furthermore, South America which has been inhabited by less than half of Africa’s share in population accounts for just as much as Africa’s share in cumulative emission levels.
 Source: FIGURE 3:World bank data, Our World in Data, Author’s Calculations
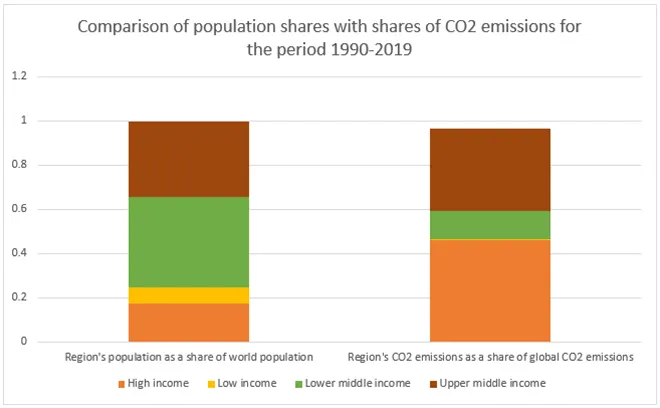
Figure 3 helps us examine the interaction between cumulative population and cumulative CO
2 emissions for the period 1990–2019 in the context of regional groupings based on income levels. Higher the income level of a regional grouping, higher is its share of CO
2 emissions in cumulative global CO
2 emissions. However, this is not true of the share of the population of a regional grouping in relation to its share of the cumulative global population. While the high-income economies account for less than 20 percent of the cumulative global population, they are responsible for about half of the global cumulative CO
2 emissions. While low-income countries are inhabited by about 7 percent of the cumulative global population, it represents a mere 0.5 percent of global cumulative CO
2 emissions.
From the above analysis, we conclude that there is more to the positive correlation between population and climate change. An increase in population does not necessarily lead to an increase in emissions. The regional distribution of this increase in population is an important determinant of whether there will be an increase in CO
2 emissions and how much will emissions increase. The complex interaction between a region’s geophysical and economic characteristics is relevant in answering the above questions. Clearly, the income inequality amongst regions has translated into carbon inequality as well.
Suggestions
These observations have important implications for effective climate policy. The high-income countries and the developed world need to rethink their overconsumption of the carbon budget relative to the developing world. The developed world needs to consider implementing climate policies underpinned by SDG 12, that is, sustainable production and consumption. The
latest IPCC report on climate mitigation emphasised the importance of integrating sustainable lifestyles in their approach to economic well-being. The developing world needs to identify strategies to pursue its development goals by decoupling them from emissions. Of course, while the developing economies strengthen their efforts towards relative decoupling on their own and with assistance from the developed constituencies, the Global South can aspire for absolute decoupling only if it is adequately supported by the Global North through finance and technology.
It must also be acknowledged that while the positive correlation between population growth and climate change needs to be qualified with regional realities, increase in population cannot be completely side-lined in the fight against climate change. The increasing pressures of a growing population on scarce natural resources do have implications for climate change. The global community has to address the impact of population growth on emission in a reasonable, equitable and fair manner.
The views expressed above belong to the author(s). ORF research and analyses now available on Telegram! Click here to access our curated content — blogs, longforms and interviews.