Source Image: The Secretariat
The National Sample Survey Office of India has released the Household Consumption Expenditure Survey for 2022-23, over a decade after the last survey in 2011-12. This round of the survey looked at around 262,000 households across rural and urban regions. Unlike the earlier rounds of the survey which had only one questionnaire, this version used three different questionnaires—food items, consumables and service items, and durable goods. This article looks at the trends in India’s consumption patterns over time and discusses why these estimates are important for informed policymaking.
Table 1: Average Monthly Per Capita Consumption Expenditure (MPCE) in 2022-23
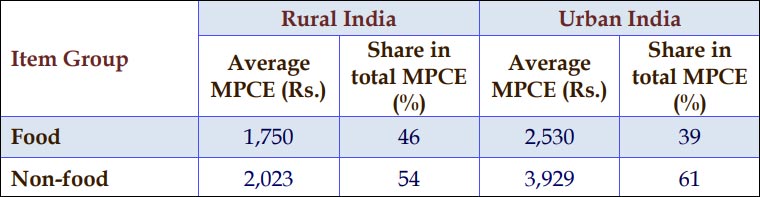
Source: Survey on Household Consumption Expenditure Factsheet
The average monthly per capita consumption expenditure (MPCE) in rural India is around INR 3,753 and for urban India is nearly INR 6459. A consistent finding is that the share of food in consumption expenditure is higher in rural India. While these estimates do not convey any significant information, a comparison over time has much to offer. For instance, Table 2 shows that the rural-urban gap in MPCE has been consistently declining since 2004-05. This can be interpreted in two ways—a) India has experienced steady urbanisation, or, b) rural India has experienced a rise in income owing to the proliferation of industries.
Table 2: Trend in rural-urban consumption divide
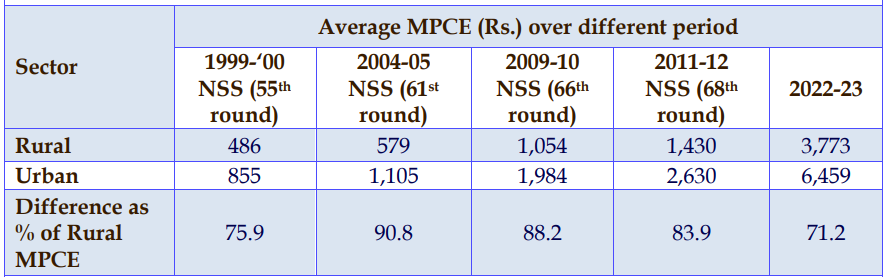
Source: Survey on Household Consumption Expenditure Factsheet
Another important finding in the share of food items in the average MPCE is that for both urban and rural consumers, the share of food in their consumption basket has fallen, indicating not only a rise in income but a deeper ideological shift in the Global South. This shift has been brought about by the proliferation of the “development for modernity” ideology—promoted by media campaigns and the luxurious lifestyles of the higher-income classes. Modernity fosters a consumerist culture which appeals to a non-traditional consumption pattern, with a much larger share of non-food items. This explains why the decline in the urban-rural consumption divide should be analysed in the context of urbanisation and not just higher income levels.
Table 3: Percentage share of food in average MPCE
| Period |
Rural |
Urban |
| 1999-00 |
59.4 |
48.06 |
| 2004-05 |
53.11 |
40.51 |
| 2009-10 |
56.98 |
44.39 |
| 2011-12 |
52.9 |
42.62 |
| 2022-23 |
46.38 |
39.17 |
Source: Survey on Household Consumption Expenditure Factsheet
The Indian conundrum
Despite rising Gross Domestic Product (GDP), India is still a victim of high levels of income inequality. Private consumption expenditure has been the major driver of Indian economic growth in the last three decades. This implies that income inequality has a crucial role to play in India’s development trajectory, and should be managed tactfully if it wants to exploit the full potential of its rising middle class. This follows from the tendency of consumption propensity to fall with higher income, i.e., the lower income groups tend to spend a significantly higher share of their income.
However, rising income inequality leaves the lower income groups with a smaller share, further deflating the aggregate consumption expenditure in the economy. Not only does this impede growth but also shoves the lower-income groups into a vicious poverty trap—both in terms of income and wealth. The latter is caused due to very limited savings, which further makes intertemporal smoothening of the consumption curve difficult, forcing them into a perennially debt-ridden state. The trends and estimates of the Household Consumption Expenditure Survey are used to verify these claims and look for possible solutions to break the cycle.
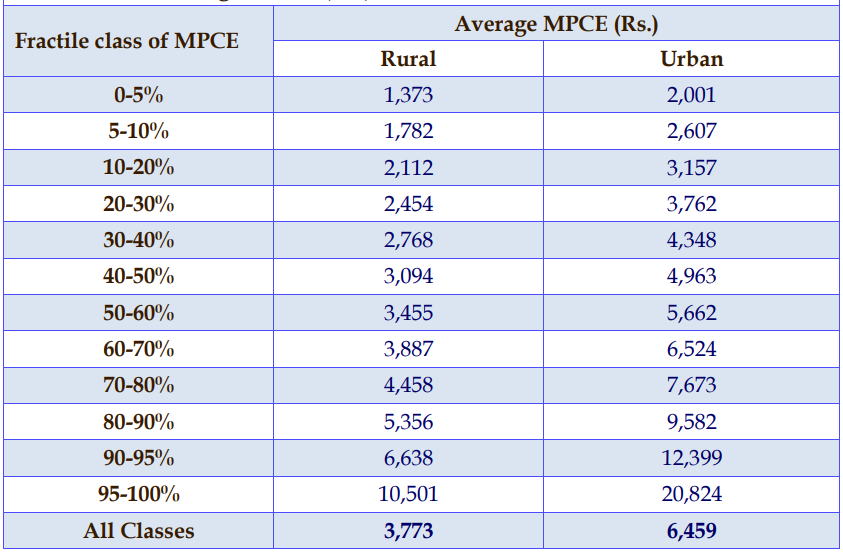
Table 4: Average MPCE across classes in 2022-23
Source: Survey on Household Consumption Expenditure Factsheet
Table 4 reveals how widely consumption expenditure varies across the fractile classes. To place it in the context of income inequality, it should be stated that the richest 10 percent of the Indian population gets 57 percent of the GDP. Thus, while the 5 percent of the population with the highest MPCE consume around 10 times more than the lowest 5 percent, this still does not compensate for the difference in income. This reiterates the importance of the high propensity to consume among lower-income groups and how income inequality further perpetrates consumption inequality.
Table 5: Break-up of MPCE by item group in 2022-23
| Item Group |
MPCE (INR) |
% share in total MPCE |
| Rural |
Urban |
Rural |
Urban |
| Cereals & cereal substitutes |
185 |
235 |
4.91 |
3.64 |
| Pulses & their products* |
76 |
90 |
2.01 |
1.39 |
| Sugar & salt |
35 |
39 |
0.93 |
0.60 |
| Milk & milk products |
314 |
466 |
8.33 |
7.22 |
| Vegetables |
203 |
245 |
5.38 |
3.80 |
| Fruits |
140 |
246 |
3.71 |
3.80 |
| Egg, fish & meat |
185 |
231 |
4.91 |
3.57 |
| Edible oil |
136 |
153 |
3.59 |
2.37 |
| Spices |
113 |
138 |
2.98 |
2.13 |
| Beverages, refreshments, processed food# |
363 |
687 |
9.62 |
10.64 |
| Food Total |
1,750 |
2,530 |
46.38 |
39.17 |
| Pan, tobacco & intoxicants |
143 |
157 |
3.79 |
2.43 |
| Fuel and light |
251 |
404 |
6.66 |
6.26 |
| Education |
125 |
374 |
3.30 |
5.78 |
| Medical |
269 |
382 |
7.13 |
5.91 |
| Conveyance |
285 |
555 |
7.55 |
8.59 |
| Consumer services excluding conveyance |
192 |
382 |
5.08 |
5.92 |
| Misc. goods, entertainment |
234 |
424 |
6.21 |
6.56 |
| Rent |
30 |
423 |
0.78 |
6.56 |
| Taxes and cesses |
5 |
16 |
0.13 |
0.24 |
| Clothing, bedding & footwear |
230 |
350 |
6.10 |
5.41 |
| Durable goods |
260 |
463 |
6.89 |
7.17 |
| Non-food total |
2,023 |
3,929 |
53.62 |
60.83 |
| All items |
3,773 |
6,459 |
100.00 |
100.00 |
Source: Survey on Household Consumption Expenditure Factsheet
As mentioned earlier, food reserves a greater share of consumption expenditure in rural households. Urban households tend to spend more on non-food items, primarily conveyance, durable goods, entertainment, rent, etc. The demand for these estimates arises not because they relay information about consumer trends, but because they have a lot of predictive power. Besides serving as a broad measure of how demand is shifting away from non-food items with urbanisation, it is an important determinant of inflation. A shift away from food items in the urban sector might mean a higher weight given to core inflation (i.e., headline inflation without food and fuel prices). On the other hand, the leading shares of milk and processed foods in the food category should lead to redesigning of the weight structure of Consumer Price Index (CPI) inflation.
Conclusion
A change in the definition of inflation indices has far-reaching implications, both for the macroeconomic environment of the country and the reaction of the commodities market. High inflationary expectations can cause inflation to shoot up in the short run and further diminish the purchasing power of the lower-income group—deepening the already existing poverty trap. On the other hand, the information about consumer preferences can be effectively utilised to direct policy that ensures a greater supply of the necessary goods. For instance, to facilitate a greater supply of milk, sustainable dairy farming practices can be implemented, in tandem with the formalisation of this sector. Thus, it is imperative to look beyond just the trends in MPCE and analyse the economic effects to capitalise on India’s economic growth.
Arya Roy Bardhan is a Research Assistant at the Observer Research Foundation
The views expressed above belong to the author(s). ORF research and analyses now available on Telegram! Click here to access our curated content — blogs, longforms and interviews.