Most households in India, on 5 April this year, switched off electrical lights for nine minutes from 21.00 hours to 21.09 hrs. Despite the sudden loss of load, excellent planning and coordination between state, regional and national load dispatch centres (SLDC, RLDC and NLDC) and distribution companies (discoms), maintained grid stability and kept power system parameters within acceptable limits. Without this great balancing act, the grid could have faltered threatening electricity supply to millions of vital electrical equipment across the country including those in hospitals that kept patients alive.
5 April 2020: Demand and Supply
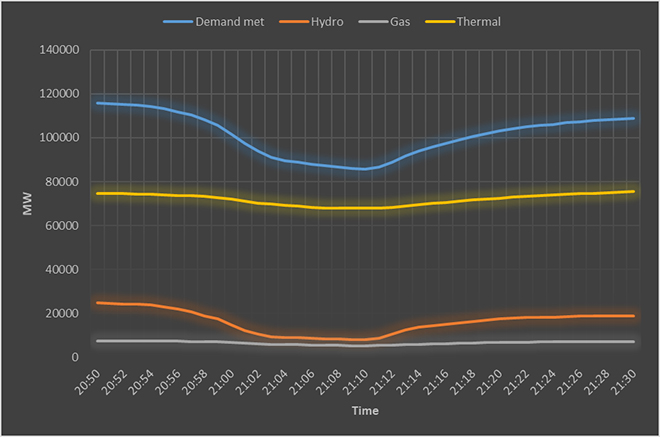 Source: POSOCO
The demand end
The national load despatch centre, POSOCO (Power system Operation Corporation limited), used the demand behaviour on 29 March, the previous Sunday, to calculate potential loss of demand when lights are switched off the following Sunday. On 29 March, all India demand was 101,207 MW (megawatts) at 18.07 hrs (before households turned on lights). It increased to 112,551 MW at 21.00 hrs (after most household lights turn on lights). NLDC took 11,433 MW, the difference between the two as the expected lighting load. NLDC also used the number households in the country to calculate demand loss assuming that 80 percent of urban household load of 100 W (watts) per house and rural household load of 50W per house is lighting load. This worked out to be 12,452 MW. Each SLDC calculated expected load reduction for its respective State and the total for all States worked out to be 15,085 MW.
Based on these estimates, the overall anticipated demand reduction during the nine minutes fell in the 12-14 GW (gigawatt) range. The recorded all India demand loss during the nine minutes was over 31 GW, more than double the demand loss anticipated. There could be many reasons for the discrepancy. It is likely that some households turned off more than just lights ignoring the advisory not to do so because they feared voltage instability and damage to equipment. It is also likely that the number of households were underestimated. The figure used for the number of households was 214.47 million, credited to the Saubhagya database. Census 2011 puts the number of households at 246.74 million. An annual growth of two percent would increase the number of households in 2020 to about 300 million. It is also likely that the split between the urban and rural households did not reflect reality.
According to the data used to estimate demand reduction, there were no urban households in Tamil Nadu, Puducherry, Goa, West Bengal, Sikkim and Tripura while Punjab had 11 urban households. Overall, the data used for estimation of demand loss assumes that only 20 percent of households are urban. Though POSOCO explained that the data on households for many states was not available on the Saubhagya database, the approximations used are far from realistic. It is also possible that the assumption of 100 W for urban and 50 W for rural households was too low. The important point here is not that demand was underestimated but that grid stability did not falter despite the underestimation.
The supply end
To adjust supply with rapidly changing demand during this period, the NLDC (POSOCO) planned to reduce thermal and interstate generating stations (ISGS) to their technical minimum (60 percent) and increase hydro and gas generation simultaneously maintain load generation balance. Hydro and gas generation were increased from 18.10 hrs to 20.00 hrs to conserve for flexibility. As the event unfolded, hydro generation decreased by over 68 percent between 20.46 and 21.10 hrs while gas based generation decreased by over 28 percent between 20.53 and 21.10 hrs. As lighting load returned, thermal generation increased from its lowest level at 21.08 hrs and by 22.00 hrs it returned to 112,551 MW, the norm for that time. Other technical interventions including but not limited to disconnecting wind generation, keeping grid frequency low to accommodate expected increase in frequency, not switching off distribution sub-stations, putting reactors into service to maintain voltage were also implemented. Hydropower generation with its exceptional load following ability made the largest contribution in terms of flexibility (chart).
Demand response
The voluntary demand reduction was not costless as frequency deviation exceeded the technical limit. This inevitably means damage to equipment because even a one percent deviation in the operating frequency of 50 Hz (hertz) and a five percent deviation in voltage can damage equipment and infrastructure.
The all India loss of load during those nine minutes was about 27 percent of the post lock-down load. The highest load reduction of 46 percent was in the North Eastern grid followed by the Eastern grid at 41 percent. The reduction in the Northern grid was 32 percent, the Western grid 27 percent and the Southern grid about 17 percent. The regional variation in the response to the lights-off event reflects differences in the level of compliance, differences in temperature in the various regions and differences in the share of appliance use particularly air-conditioners.
The South had the lowest demand loss presumably because most of the household load was for cooling that was not switched off. The rest of the country was not warm enough to require cooling that meant that a large share of the household load was for lighting. In general, the dominance of lighting in household load reflects the low penetration of other electrical goods in the household and consequently indicate the income levels of the household. This factor may explain the large reduction in load in the Eastern and North Eastern grids.
The demand on demand
The demand made on demand for nine minutes was accepted. However, the duration of demand reduction was short and it did not compromise on consumer experience. To make longer lasting “demand on demand” from consumers, financial or non-financial incentives will be required.
Demand reduction during peak periods will enable discoms to optimise their generation assets thus saving costs. Reduction in the need for future generation resources will reduce carbon emissions. These are desirable outcomes but achieving this is not likely to be straightforward. For example in Delhi, more than 50 percent of the annual load is temperature dependent. This share is among the highest for cities around the world including cities in tropical regions. Consumers may not be willing to shut down temperature related demand for electricity even with incentives. Electricity used for lighting or cooling in households is neither “shiftable” load nor “sheddable” load without a compromise on consumer experience.
In affluent households, possible “shiftable” loads are washing machines and kitchen appliances; “sheddable” loads are the stand-by loads. It is likely that these “shiftable” and “sheddable” loads are currently not large enough in India to make a difference to peak demand. In the future electric vehicle (EV) charging is likely to offer huge potential for load shifting and a large pool of energy storage. EV charging during off-peak hours will essentially flatten the demand curve and substantially increase the utilisation efficiency of generating assets.
In advanced electricity markets, price based and incentive based demand response programmes help to reduce peak electricity demand. Price based response includes time of use (TOU) tariff, real time pricing (RTP) and critical peak pricing (CPP) that enable electricity consumers to shift load to non-peak periods when tariff is low and save on energy expenses. Incentive based programmes pay participating consumers to reduce load because of a grid reliability problem or because of high electricity prices.
In India, the average electricity cost is the basis of electricity tariff. Tariffs thus bear little relation to true production costs of electricity as they vary over time. To enable credible demand response, tariff should motivate consumers to change consumption patterns in response to changes in the price of electricity over time. Installation of smart meters across the country will allow users to monitor their consumption by measuring energy usage in real time and send this information on an hourly basis to the discom. Smart meters are the first step in TOU pricing which is lower when demand is low and higher when demand peaks.
Experience of advanced electricity markets on TOU pricing is mixed. For example, in the US only four percent of consumers have signed up for TOU pricing though 80 percent are on smart meters. In the EU and the UK, the share of household consumers on TOU pricing is between 15-20 percent. Higher share of renewable energy in the grid may require TOU tariff to become the norm rather than remain the exception.
Challenges in optimising supply and demand arise because electricity is a heterogeneous good across space, time and lead-time. Different sources of electricity generate electricity that have different heterogeneity and different marginal value. Optimising supply and demand across space and time rationalises resources and thus increases efficiency. The security constrained economic dispatch programme (SCED) implemented for the ISGS by POSOCO optimises generation assets at the supply end. Under SCED, there is increase in lower variable cost generation from the pithead plants in the western and eastern region and decrease in higher variable cost generation from the south, north and east. Optimisation at the demand end is far more difficult. It will require the wholesale and retail price of electricity to reflect all dimensions of heterogeneity (between hours, between locations etc), transmission costs, transaction costs, marginal cots and benefits. Industries may respond to price signals but coaxing household consumers to respond to price changes will remain a challenge.
The views expressed above belong to the author(s). ORF research and analyses now available on Telegram! Click here to access our curated content — blogs, longforms and interviews.