I. Introduction
Amidst the deepening trade war between the United States (US) and China, the US government started opening new war fronts in the international trade arena. These new measures, directed at countries other than China, also involved the withdrawal from the Generalized System of Preferences (GSP) of certain developing countries, including India. US President Donald Trump said in a proclamation, “I have determined that India has not assured the US that it will provide equitable and reasonable access to its markets. Accordingly, it is appropriate to terminate India’s designation as a beneficiary developing country effective 5 June 2019.”[1]
This is part of the president’s pre-election promise to “renegotiate and realign” trade relations with the rest of the world. The move is also partly explained by the growing perception in the western world that India and China should no longer be considered as “developing countries” given the size of their GDP.
The withdrawal of India’s GSP benefits was announced earlier, but the implementation was postponed until after India’s general elections. Official Indian reaction dismissed the impact of GSP withdrawal as “not significant”, as the benefits, to begin with, are only around US$190 million every year.[2] Such dismissal, however, was in contrast to the government’s position in its submission before the Trade Policy Staff Committee, Office of the USTR on 19 June 2018. The Indian representative, Puneet R. Kundal, in his address said that a withdrawal would cause “irreparable damage” to the exports of India. He highlighted how a withdrawal would impact employment and affect the MSME sector in a developing country like India.[3]
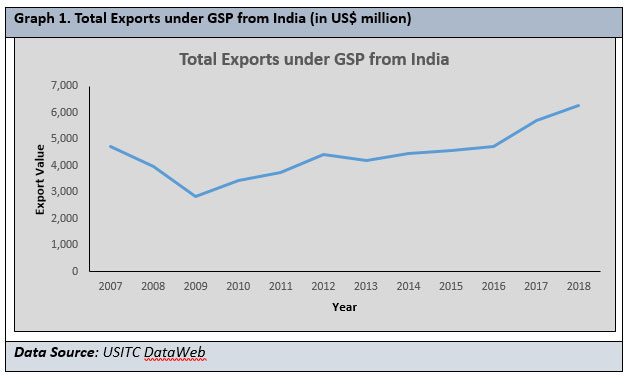
Indeed, the official estimates of the impact of a GSP withdrawal has considered only an approximation of the tariff benefits that India had enjoyed under the programme. Yet, in 2018 alone, India exported goods worth US$6.3 billion to the US under the GSP programme—a figure that is far from insignificant.[4] This paper determines the top Indian exports to the US under GSP, and proceeds to map those exports back to domestic production figures. The paper analyses the likely impact on these affected sectors of Indian industry in terms of employment and export volumes.
II . The Generalized System of Preferences: An Overview
The first multilateral free trade agreement came into effect with the signing in 1948 of the General Agreement on Tariffs and Trade (GATT), which aimed to facilitate the free movement of trade of goods and services across borders. Amongst the agreement’s most important provisions was the Most Favoured Nation (MFN) clause that required that each nation be treated at par when it comes to tariffs.
The GSP provided a permanent waiver to the MFN scheme to allow for countries to give preferential tariff treatment to select countries under their respective GSP programmes. It provided non-reciprocal, duty-free tariff treatment to certain imports from developing countries. It was first adopted in Resolution 21 passed in 1968 by the United Nations Conference on Trade and Development (UNCTAD) at the UNCTAD II Conference.[5] The enabling clause adopted in 1979, as part of the Tokyo Round of the GATT, gave permanent validity to the GSP. In particular, the GSP allowed an exception to the MFN clause for the sake of the exports of developing countries, particularly to developed ones. The rationale was to promote exports from developing countries by helping them diversify their export baskets and move away from trade in primary agricultural products. This in turn can aid in their economic growth.
Before the June 2018 US withdrawal of GSP, India enjoyed benefits from ten countries including the US. Other countries are Australia, Belarus, the European Union, Japan, Kazakhstan, New Zealand, Russian Federation, Turkey and Switzerland.
II.1 The US GSP Programme
Different developed countries have their own GSP programmes. The US began implementing its own in 1976, two years after it was provided for in the Trade Act of 1974. The GSP programme is non-reciprocal – i.e., it does not require similar benefits from the beneficiary countries. However, the GSP programme does place certain conditions on the non-reciprocal preferences. These conditions include respecting arbitral awards in favour of the US citizens or corporations, combating child labour, respecting internationally recognised workers’ rights, providing adequate intellectual property protection, and providing the US with equitable and reasonable market access. Section 504 (a) of the US Trade Act gives discretionary powers to the US president to withdraw, suspend or limit the application of GSP to beneficiary countries based on these conditions.[6]
The US Trade Act 1974 authorises the president to choose beneficiary countries according to certain criteria. The original law barred the inclusion of developed countries as beneficiaries, and a general rule was also made to exclude communist countries. In 1996 this restriction on communist countries was lifted after the collapse of the Soviet Union. However, when the East European and Baltic countries joined the European Union (EU), these countries once again lost their beneficiary status. (EU as an advanced economic and trade bloc is outside the ambit of these preferential treatments.) In 1996 the GSP Renewal Act was passed by the US parliament; it provided for the mandatory exclusion of a country that “aids or abets, by granting sanctuary from prosecution to, any individual or group which has committed an act of international terrorism.” Iran and Libya are barred from the US GSP programme under this provision.[7] In 1996, the US added another criteria to exclude any country that meets the World Bank (WB) definition of “high income”. As of 1 July 2019, high income economies are defined by the WB as those with gross national income (GNI) per capita of US$ 12,376 or more – calculated using the WB Atlas method.[8] In 2018, India’s per capita GNI calculated under this method was US$ 2,020,[9] making it “lower middle income”.[10]
Section 504(a) of the US Trade Act 1974 authorises the president with wide-ranging powers to withdraw, suspend or limit the application of GSP. For example, the US president removed Hong Kong, the Republic of Korea, Singapore and Taiwan from GSP beneficiary status in 1988, and Malaysia in 1996.[11]
The original 1974 Act also set competitive need limitations. In a product (or group of products) a value limit of US$ 25 million or share limit of 50 percent of total imports in a calendar year was imposed. Later in 1996, the value limit was revised to US$ 75 million (to be increased by US$ 5 million each calendar year), and the 50 percent share limit would not apply to any product if any similar or directly competitive product is not produced in the US.[12] Moreover, the law provides “Rules of origin” under the US GSP programme: the value of domestic material used and the processing operations should constitute not less than 35 percent of the appraised value of the imported product. A big convenient factor in this provision is that exporters claiming the benefit do not have to obtain a certificate of origin from any authorised signatory but only have to submit a declaration that the goods meet the criteria.[13]
II.2 The 2019 US withdrawal of India’s GSP status
The US’ recent withdrawal of India’s GSP benefits is not an entirely new phenomenon. Much earlier in 1992, the US suspended India’s GSP benefits in certain pharmaceuticals, chemicals and related products based on Intellectual Property Rights (IPR) considerations,[14] after the US’ appraisal that India lacked pharmaceutical product patent protection. India started providing such patent protection after 2005. Until that time, India availed the benefit of additional transitional period, as provided in Article 65.4 of TRIPS (Trade-Related Aspects of Intellectual Property Rights) Agreement of WTO.[15]
The 2019 withdrawal of GSP benefits from India is a result of the US’ appraisal that India has failed to provide market access to its dairy and medical device industries. The US has also raised issues about the proposed e-commerce policy and data localisation norms. In April 2018, the Office of the United States Trade Representative (USTR) self-initiated a review of India’s GSP status and accepted two petitions filed by: (i) the National Milk Producers Federation and the US Dairy Export Council; and (ii) the Advanced Medical Technology Association.[16] Thereafter, the US in its proclamation dated 31 May 2019 withdrew the benefits,[17] and it came into effect from 5 June 2019.
Before the US announcement, India had been the largest beneficiary of the US GSP programme in recent years. (See Table 1)
| TABLE 1. Top Five Beneficiaries of the US GSP Programme, 2014-18 (export values in US$ million) |
| Country |
2014 |
2015 |
2016 |
2017 |
2018 |
| India |
4,476 |
4,622 |
4,747 |
5,766 |
6,347 |
| Thailand |
3,500 |
3,625 |
4,058 |
4,192 |
4,381 |
| Brazil |
1,906 |
1,944 |
2,198 |
2,512 |
2,511 |
| Indonesia |
1,690 |
1,682 |
1,792 |
2,031 |
2,239 |
| Turkey |
1,151 |
1,229 |
1,464 |
1,645 |
1,936 |
| Data Source: USITC DataWeb |
India also enjoys GSP benefits from countries other than the US (See Table 2). Indian exports to these countries was nearly five times the total exports to the US in 2018 and such exports continue to grow. For instance, Indian exports to 28 countries in the EU under the GSP scheme increased to US$ 25.96 billion in 2018, from US$ 23.93 billion in 2017 and US$ 20.76 billion in 2016.[18]
| TABLE 2. Trade Benefits to India from Other Countries’ GSP programmes |
| Importing Country |
2018 Trade Value (US$ million) |
| EU |
25965.15 |
| USA |
6307.30 |
| Japan |
1719.45 |
| Russia |
478.68 |
| Australia |
445.76 |
| New Zealand |
29.05 |
| Belarus |
21.25 |
| Kazakhstan |
5.72 |
| Source: PIB Press Release[19] |
III. Impact of Withdrawal on Indian GSP Exports
At the time of the US’ withdrawal of India’s GSP benefits, it was the largest beneficiary under the programme. It has goods worth US$ 6.3 billion in 2018 that were exported under the programme, making up about 12 percent of the total US$ 54.4-billion exports to the US that year.[20] Given these figures, the potential losses of Indian exports due to the withdrawal of GSP benefits are likely to be substantial.
The tariff concession is calculated to be more than US$ 241 million, based on 2018 Indian export value to the US under GSP. This was calculated using data from the 8-digit HS code product level. The number of products that came under the GSP programme is 1,945. Out of these, tariff was not calculated for 219 items – 147 of these have a tariff structure that is a combination of ad valorem tax and specific tax. The data for the remaining 72 was unavailable. Therefore, tariff has been calculated on 1,726 products, amounting to US$ 241 million. Considering the rest of the items under Indian GSP exports to the US in 2018, total tariff benefit will well exceed US$ 241 million.
Out of the top Indian exports to the US, most of the products are not under GSP which implies that MFN rates will apply to them. Such non-GSP normal Indian exports to the US include precious stones (diamonds), jewelry, motor vehicles, fuel (refined crude), pharmaceuticals, and many apparel products. Product groups (or sectors) that have primarily been affected by GSP withdrawal are organic chemicals, machinery and mechanical parts, vehicles, articles of iron or steel, plastics, and electrical machinery. (See Table 3). Under GSP, the goods gain entry at zero-tariff level.
| TABLE 3. Top 20 Indian Exports to the US as of 2018 and Respective MFN Tariff Rates |
| S.No. |
HS Code |
Description |
Export Programme |
2018 Export Value (US$ million) |
Range of MFN rates |
| 1 |
71 |
natural or cultured pearls, precious or semiprecious stones, precious metals |
Non-GSP |
11278.85 |
0.2% – 11% |
| 2 |
30 |
pharmaceutical products |
Non-GSP |
6315.9 |
4.2% |
| 3 |
27 |
mineral fuels, mineral oils and products of their distillation; |
Non-GSP |
2818.77 |
(0.9 – 2.9) cents/kg +
(3% – 12%)
|
| 4 |
63 |
made-up textile articles not elsewhere specified or indicated; needlecraft sets; worn clothing and worn textile articles; rags |
Non-GSP |
2398.84 |
2.7% – 7% |
| 5 |
3 |
fish and crustaceans, mollusks and other aquatic invertebrates |
Non-GSP |
2062.14 |
0.5% – 15% |
| 6 |
87 |
vehicles, other than railway or tramway rolling stock |
Non-GSP |
1928.08 |
1.4% – 10% |
| 7 |
84 |
nuclear reactors, boilers, machinery and mechanical appliances; parts thereof |
Non-GSP |
1775.2 |
1% – 8% |
| 8 |
62 |
articles of apparel and clothing accessories, not knitted or crocheted |
Non-GSP |
1650.35 |
0.8% – 14.6% |
| 9 |
61 |
articles of apparel and clothing accessories, knitted or crocheted |
Non-GSP |
1631.66 |
1.5% – 14.6% |
| 10 |
29 |
organic chemicals |
GSP |
828.18 |
1% – 6.5% |
| 11 |
84 |
nuclear reactors, boilers, machinery and mechanical appliances; parts thereof |
GSP |
732.87 |
1% – 8% |
| 12 |
85 |
electrical machinery and equipment and parts thereof; |
Non-GSP |
683.09 |
0.6% – 12.5% |
| 13 |
87 |
vehicles, other than railway or tramway rolling stock, and parts and accessories thereof |
GSP |
664.48 |
1.4% – 10% |
| 14 |
29 |
organic chemicals |
Non-GSP |
633.55 |
1% – 6.5% |
| 15 |
84 |
nuclear reactors, boilers, machinery and mechanical appliances; parts thereof |
Non-GSP |
568.39 |
1% – 8% |
| 16 |
73 |
articles of iron or steel |
GSP |
561 |
1.5% – 12.5% |
| 17 |
13 |
lac; gums; resins and other vegetable saps and extracts |
Non-GSP |
510 |
|
| 18 |
94 |
furniture; bedding, cushions etc.; lamps and lighting fittings not elswhere specified or indicated; illuminated signs, nameplates and the like; prefabricated buildings |
Non-GSP |
499 |
1.9% – 12% |
| 19 |
29 |
organic chemicals |
Non-GSP |
478.68 |
1% – 6.5% |
| 20 |
39 |
plastics and articles thereof |
GSP |
465.93 |
2.1% – 6.5% |
| Data Source: USITC DataWeb |
Table 3 shows the top 20 Indian exports to the US, irrespective of GSP status. In this list, the top nine Indian export product groups do not fall under GSP. This is possibly the basis of the claim made by the Indian Ministry of Commerce that the impact of the GSP withdrawal will be “non-significant”. However, the existence of five product groups (at the HS-2-digit level) in the top 20 list puts a question mark on such a claim.
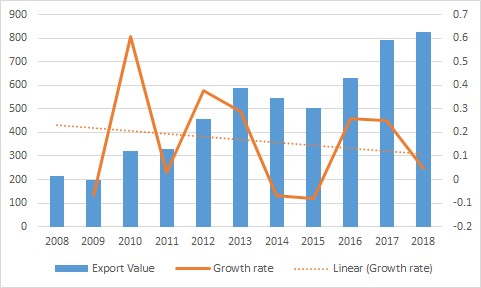
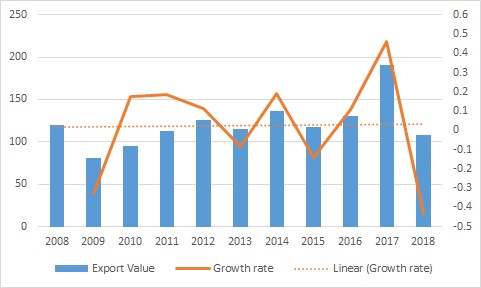
Overall, the GSP exports to the US had an annual growth rate of 58 percent between 2008 to 2018. (See Graph 1)
Additionally, the month-on-month GSP exports in 2019, as compared to 2018, have been higher as can be seen in Graph 2. This increasing trend of GSP exports is not exactly in consonance with the Indian official reaction dismissing the likely impact of GSP withdrawal as “not significant”.
Graph 2. Month-on-month exports under GSP to the US (in US$ million)
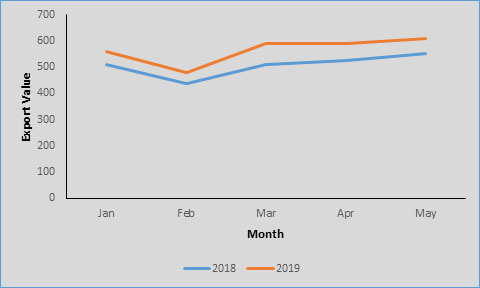
Source: USITC DataWeb
III.1 Sectoral impact of GSP withdrawal on segments of Indian industries
This section will take a closer look at the impact on all the sectors using data at the 2-digit HS Code level. The data has been sourced from three sources: the US International Trade Commission (USITC) DataWeb, the United National Comtrade Database, and Annual Survey of Industries (ASI) data of India at the NIC 3-digit level. Mirror data from Comtrade are used to find the total Indian exports of different HS Code products to the world.
The analysis will cover Indian product exports to the US under GSP, with value of more than US$ 100 million in 2018. The figure of US$100 million is chosen as the UNCTAD considers this as a threshold exports benchmark for developing countries.[21] The same benchmark is used in this study. Altogether there are 85 groups of products which India exports to the US under GSP. With the criteria of US$ 100 million value of exports, there are 12 product groups which are selected. The following analysis is done for these selected 12 product groups.
Table 4 provides the export figures for those 12 product groups. To understand the importance of these products’ exports, two more ratios are calculated. First is the GSP exports as percentage to total Indian exports to the US in a particular product group; and second is the ratio of Indian exports to the US as percentage of total Indian exports to the entire world in that product group. The first one will show the significance of a particular product in the US export market for India in terms of the impact of the GSP withdrawal, while the second ratio estimates the weightage of that particular product in India’s overall export basket.
| TABLE 4. Indian Exports to the US > US$ 100 million (2018) |
| HS Code |
Description |
GSP exports as % of total Indian exports to the US |
Indian Exports to the US as % of total Indian exports to the world |
| 29 |
organic chemicals |
34% |
15% |
| 84 |
nuclear reactors, boilers, machinery and mechanical appliances; parts thereof |
22% |
20% |
| 87 |
vehicles, other than railway or tramway rolling stock, and parts and accessories thereof |
24% |
20% |
| 73 |
articles of iron or steel |
45% |
22% |
| 39 |
plastics and articles thereof |
76% |
12% |
| 85 |
electrical machinery and equipment and parts thereof |
26% |
15% |
| 42 |
articles of leather; saddlery and harness; travel goods, handbags and similar containers; |
50% |
18% |
| 40 |
rubber and articles thereof |
32% |
17% |
| 68 |
articles of stone, plaster, cement, asbestos, mica or similar materials |
34% |
32% |
| 94 |
furniture; bedding, cushions etc.; lamps and lighting fittings not elswhere specified or indicated; illuminated signs, nameplates and the like; prefabricated buildings |
14% |
39% |
| 83 |
miscellaneous articles of base metal |
42% |
26% |
| 76 |
aluminium and articles thereof |
16% |
13% |
| Data Source: USITC DataWeb and UN Comtrade databases |
The higher ratio of Indian exports to the US as percentage of the total Indian exports to the world signifies a larger importance of a particular product group in India’s current export basket. Table 4 shows that all 12 of these product groups are strategically important in the current Indian export basket. Meanwhile, a higher ratio of Indian GSP exports to the US as percentage of total Indian exports to the US reflects a more significant detrimental impact of GSP withdrawal on that particular product group. Here, it is clear that almost all product groups will experience significant detrimental effects on their future exports to the US as a result of the GSP withdrawal – with two probable marginal exceptions in HS Code 94 (Furniture etc.) and HS Code 76 (Aluminium etc.).
These two statistical observations imply that the 10 product groups that are exported by India to the US under GSP are important to India’s overall export basket. The high share of exports to the US in total Indian exports of these product groups to the world highlights the importance of American export component of these products. Moreover, the high share of GSP exports in total Indian exports of these products to the US further highlights the importance of GSP exports of these products. In other words, the US GSP programme plays a pivotal role in the overall exports of these commodities, and a withdrawal of GSP is going to negatively affect the overall exports of these 12 product groups. The next section assesses the intensity of this impact.
III.2 Effect of GSP withdrawal on top 12 Indian exports under GSP to the US (using HS-2-digit level classification)
The first step in analysing the impact of GSP withdrawal is to consider Indian GSP exports, as percentage of total Indian exports to the US, and Indian exports to the US, as percentage of total Indian exports to the entire world, for these 12 top Indian exports to the US. (The Appendices provide the graphs of the growth rate in exports in each of the following product codes.)
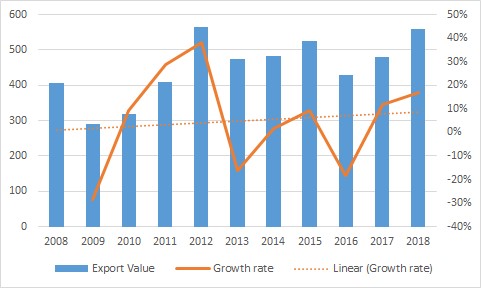
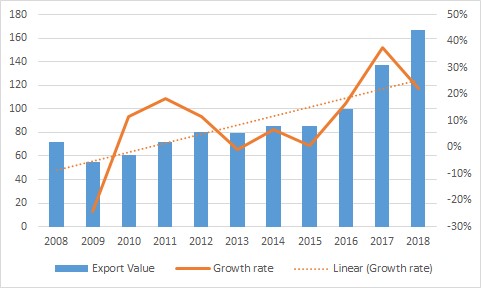
III.2.1 HS Code: 29 (organic chemicals)
Table 5 shows the details of the product 29. The share of Indian exports to the US as a proportion to total Indian export to the world for the product is substantial at about 15 percent in the last decade or so. Therefore, organic chemicals as a product group is a significant element in the overall export basket of India.
| TABLE 5. Details for HS Code 29 |
| |
2008 |
2009 |
2010 |
2011 |
2012 |
2013 |
2014 |
2015 |
2016 |
2017 |
2018 |
| GSP exports as % of total Indian exports to the US |
15% |
15% |
19% |
17% |
21% |
27% |
24% |
25% |
31% |
36% |
34% |
| Indian Exports to the US as % of total Indian exports to the world |
14% |
15% |
16% |
14% |
15% |
14% |
15% |
15% |
14% |
14% |
15% |
| Data Source: USITC DataWeb and UN Comtrade databases |
Further, the share of GSP exports in the total Indian exports to the US in that product has more than doubled since 2008. This signifies the increasing influence of GSP exports in total Indian exports of these products. Thus, these two observations indicate that the product will be one of the segments that would be adversely affected by the GSP withdrawal.
The MFN rate in this product group is in the range of 1 to 6.5 percent, which will now likely be applied to all the products – increasing the cost of export with a possibility of rise in prices. A rise in export prices will likely make these products uncompetitive.
A further point that may be noted is that the growth rate of the value of exports (See graph in Appendices) under GSP for this product has shown a slightly declining trend over the last 10 years. However, the significance of these products in Indian exports to the US is unlikely to get diminished in the near future.
Therefore, product groups under HS Code 29 are likely to get affected adversely after GSP withdrawal.
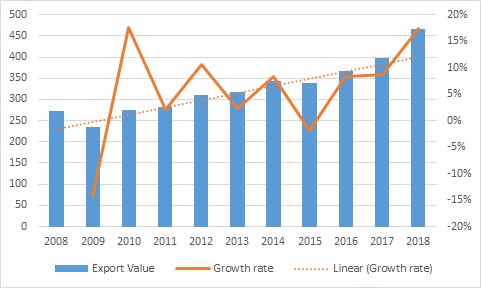
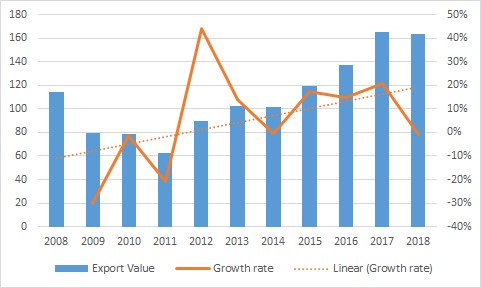
III.2.2 HS Code: 84 (nuclear reactors, boilers, machinery and mechanical appliances; parts thereof)
Table 6 shows the details of the product group 84. The share of Indian exports to the US in total Indian exports to the world for the product group is substantial at about 16 percent on average. Further, the year-on-year growth rate shows a rising trend. Thus, this indicates that GSP benefits could be one of the factors that has helped this product group increase its market share in the US. This rising trend is likely to get affected by the GSP withdrawal.
| TABLE 6. Details for HS Code 84 |
| |
2008 |
2009 |
2010 |
2011 |
2012 |
2013 |
2014 |
2015 |
2016 |
2017 |
2018 |
| GSP exports as % of total Indian exports to the US |
36% |
30% |
29% |
27% |
31% |
30% |
29% |
26% |
27% |
25% |
22% |
| Indian Exports to the US as % of total Indian exports to the world |
15% |
14% |
13% |
14% |
17% |
14% |
16% |
18% |
15% |
16% |
20% |
| Data Source: USITC DataWeb and UN Comtrade databases |
The MFN rate is in the 1 percent to 8 percent range, and the tariff increase will now apply to all the products. A further point that may be noted is that the share of GSP within the total exports to the US under this product has declined over the last 10 years by more than 10 basis points. At the same time, the share of GSP exports in total Indian exports to the US has fallen.
This may also point to the fact that there has been growth in non-GSP exports of this product to the US outside of those products that are covered by the GSP products. This may be an indication that some commodities in this group will be able to withstand the adverse effect of GSP withdrawal, and overall this group may not be as adversely affected as some others.
Overall export volume of product group 84, to the US, has stabilised since 2012, and the growth of export of these products is slightly increasing (see diagram in the Appendices).
This set of products, relatively, seems to have done well in terms of export performance – without help of GSP benefits in recent years.
Therefore, product groups under HS Code 84 are likely to be affected marginally by GSP withdrawal.
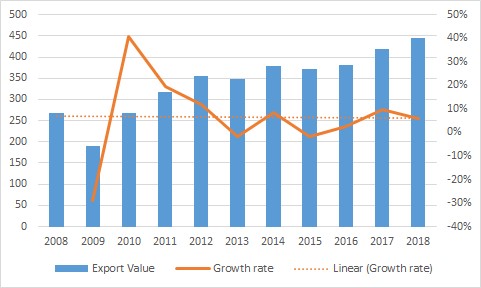
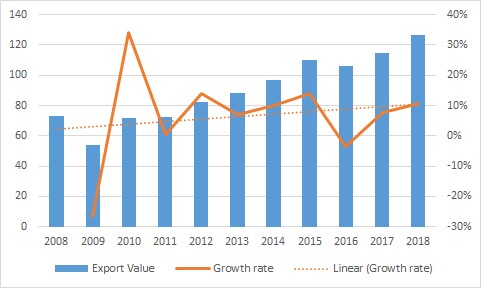
III.2.3 HS Code: 87 (vehicles, other than railway or tramway rolling stock, and parts and accessories thereof)
Table 7 shows the details of the product 87. The proportion of Indian exports to the US as a proportion of total Indian exports to the world for the product is about 10 percent on average, rising to 20 percent only in 2018. At the same time, the proportion of GSP exports in total Indian exports to the US in these products has considerably gone down. Exports outside of the GSP benefits are seemingly able to compete successfully in the US market. This indicates relatively less reliance on GSP exports in this product group, and therefore relatively less significant impact of GSP withdrawal can be expected here.
| TABLE 7: Details for HS Code 87 |
| |
2008 |
2009 |
2010 |
2011 |
2012 |
2013 |
2014 |
2015 |
2016 |
2017 |
2018 |
| GSP exports as % of total Indian exports to the US |
52% |
56% |
55% |
49% |
38% |
33% |
32% |
32% |
36% |
39% |
24% |
| Indian Exports to the US as % of total Indian exports to the world |
11% |
7% |
9% |
8% |
8% |
8% |
8% |
11% |
9% |
10% |
20% |
| Data Source: USITC DataWeb and UN Comtrade databases |
The MFN rate in the range of 1.4 percent to 10 percent will now likely apply to all the products. Upper limit of the tariff is steep, and the products that will attract 10 percent tariff may get adversely affected due to resultant effect on competitive pricing.
The year-on-year growth rate of the export value in this commodity group shows a positive trend. Overall, the outlook in this segment of products is likely to remain positive, in spite of the GSP withdrawal.
Therefore, product groups under HS Code 87 are likely to be affected marginally by GSP withdrawal.
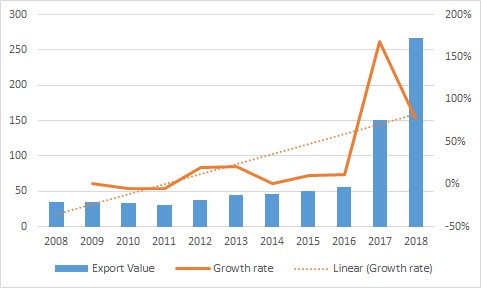
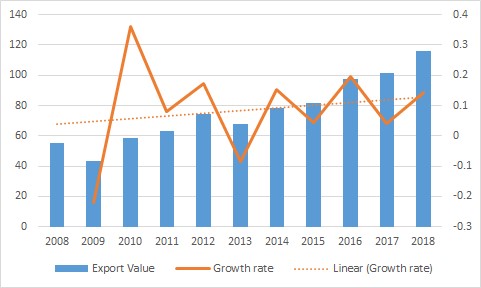
III.2.4 HS Code: 73 (articles of iron or steel)
Table 8 gives the details of the product 73. The share of Indian exports to the US as a proportion of total Indian exports to the world for the product has been consistently above 20 percent in the past 11 years. The year-on-year growth rate of the export value shows a rising trend. Thus, these two indicate that this commodity group will be amongst those that may be adversely affected by the GSP withdrawal. Another factor that may add an additional impact is that the share of GSP exports in the total exports to the US under this product group has shown an increasing trend and now stands at 45 percent in 2018.
| TABLE 8. Details for HS Code 73 |
| |
2008 |
2009 |
2010 |
2011 |
2012 |
2013 |
2014 |
2015 |
2016 |
2017 |
2018 |
| GSP exports as % of total Indian exports to the US |
24% |
26% |
27% |
32% |
39% |
40% |
40% |
42% |
47% |
35% |
45% |
| Indian Exports to the US as % of total Indian exports to the world |
28% |
25% |
24% |
23% |
24% |
20% |
19% |
24% |
18% |
24% |
22% |
| Data Source: USITC DataWeb and UN Comtrade databases |
The MFN rate in the range of 1.5 percent to 12.5 percent will now be applicable to all the products. This increase in tariff will further put pressure on the export performance of this product group.
Therefore, products under HS Code 73 are likely to be adversely affected by the GSP withdrawal.
III.2.5 HS Code: 39 (plastics and articles thereof)
Table 9 shows the details of the product group 39. The share of Indian exports to the US as a proportion of total Indian exports to the world for the product is about 10 percent on average. Also, the share of GSP in the total exports to the US under this product group is very high at close to 80 percent throughout the past 11 years. Although the US provides around 10 percent market for export, high GSP export implies that this product group is likely to be affected adversely.
| TABLE 9. Details for HS Code 39 |
|
2008 |
2009 |
2010 |
2011 |
2012 |
2013 |
2014 |
2015 |
2016 |
2017 |
2018 |
| GSP exports as % of total Indian exports to the US |
84% |
84% |
82% |
71% |
76% |
77% |
75% |
75% |
80% |
76% |
76% |
| Indian Exports to the US as % of total Indian exports to the world |
11% |
11% |
9% |
8% |
9% |
8% |
9% |
10% |
10% |
10% |
12% |
| Data Source: USITC DataWeb and UN Comtrade databases |
The MFN rate in the range of 2.1 percent to 6.5 percent will now likely be applied to all the products in this group. This tariff increase will put additional pressure on exports of these.
The year-on-year growth rate of the export value shows a rising trend – confirming the likelihood of negative effect on exports of this product group to the US in the absence of GSP benefits.
Therefore, the commodities under HS Code 39 are likely to be adversely affected by the GSP withdrawal.
III.2.6 HS Code: 85 (electrical machinery and equipment and parts thereof; sound recorders and reproducers, television recorders and reproducers, parts and accessories)
Table 10 summarises the details of the product 85. The share of Indian exports to the US as a proportion of total Indian exports to the world for this product group is 13 to 14 percent. The share of GSP exports in the total exports to the US under this group has slightly increased to 26 percent in 2018 from 20 percent in 2008. Thus the direction of impact of GSP withdrawal is a bit difficult to determine in this case.
| TABLE 10. Details for HS Code 85 |
|
2008 |
2009 |
2010 |
2011 |
2012 |
2013 |
2014 |
2015 |
2016 |
2017 |
2018 |
| GSP exports as % of total Indian exports to the US |
20% |
17% |
18% |
22% |
24% |
27% |
28% |
29% |
30% |
31% |
26% |
| Indian Exports to the US as % of total Indian exports to the world |
13% |
12% |
12% |
12% |
12% |
10% |
13% |
15% |
14% |
14% |
15% |
| Data Source: USITC DataWeb and UN Comtrade databases |
The MFN rate in the range of 0.6 percent to 12.5 percent will now likely be applied to all products in this HS Code group. This change in tariff will have negative repercussions for Indian exports to the US in this commodity group.
The year-on-year growth rate of the export value shows almost a flat-line growth. This signifies consistent growth of Indian exports to the US in these products. Combining this with around consistent export value of US$ 400 million in recent years, the overall impact of a GSP withdrawal will be tending towards the negative, albeit marginal.
Therefore, the effect of the GSP withdrawal on products under HS Code 85 is likely to be marginally negative.
III.2.7 HS Code: 42 (articles of leather; saddlery and harness; travel goods, handbags and similar containers; articles of gut (other than silkworm gut))
Table 11 shows the details of the product group 42. The share of Indian exports to the US as a proportion of total Indian exports to the world for the product has moderately increased to 18 percent in 2018 – up from 13 percent in 2008. However, the GSP share in the total Indian exports to the US has grown to 50 percent in 2018 from 13 percent a decade earlier. In other words, half of India’s leather exports to the US have been under the GSP benefits in the year 2018.
This is a product that benefited immensely from the GSP programme in the last couple of years.
| TABLE 11. Details for HS Code 42 |
| |
2008 |
2009 |
2010 |
2011 |
2012 |
2013 |
2014 |
2015 |
2016 |
2017 |
2018 |
| GSP exports as % of total Indian exports to the US |
13% |
15% |
13% |
10% |
11% |
11% |
10% |
11% |
12% |
31% |
50% |
| Indian Exports to the US as % of total Indian exports to the world |
13% |
12% |
12% |
13% |
14% |
15% |
15% |
20% |
17% |
17% |
18% |
| Data Source: USITC DataWeb and UN Comtrade databases |
The year-on-year growth rate of the export value shows a healthy rising trend. Thus, the product group is likely to experience a significant impact on account of the withdrawal. The MFN rate in the range of 1.8 percent to 20 percent will now be applied to all these products. This is one commodity group that is going to get hugely affected by the GSP withdrawal.
The concerns have also been echoed by representatives of Agra Footwear Manufacturers and Exporters Chamber (AFMEC), that the decision would have a bearing on the leather goods exports to the US. Leather goods would face stiff competition from countries like China and Vietnam.[22] Further, the Council for Leather Exports (CLE) has set an ambitious target of US$ 10 billion in exports by 2024-25 from the current level of US$ 5.73 billion. The US is the biggest market for this product. These plans now appear to be in serious jeopardy.
Therefore, the effect of the GSP withdrawal on commodities under HS Code 42 is likely to be hugely negative.
III.2.8 HS Code: 40 (rubber and articles thereof)
Table 12 shows the details of the product 40. The share of Indian exports to the US as a proportion of total Indian exports to the world for the product has increased to 17 percent in 2018 from 9 percent in 2008. The share of GSP exports in the total Indian exports to the US under this product group has declined over the years by more than 10 basis points.
These two trends together suggest that products in this group are less likely to get affected by the GSP withdrawal, but GSP exports are still a substantial part of Indian exports to the US.
| TABLE 12. Details for HS Code 40 |
| |
2008 |
2009 |
2010 |
2011 |
2012 |
2013 |
2014 |
2015 |
2016 |
2017 |
2018 |
| GSP exports as % of total Indian exports to the US |
43% |
33% |
29% |
25% |
23% |
25% |
23% |
24% |
28% |
33% |
32% |
| Indian Exports to the US as % of total Indian exports to the world |
9% |
11% |
11% |
12% |
13% |
12% |
14% |
16% |
15% |
15% |
17% |
| Data Source: USITC DataWeb and UN Comtrade databases |
Though the year-on-year growth rate of the exports value shows a rising trend, the growth seemingly is garnered by increase in non-GSP exports. Thus, the product is unlikely to be affected by the withdrawal. The MFN rate in the range of 2.5 percent 8 percent will now be applied to all the products.
Therefore, the effect of the GSP withdrawal on commodities under HS Code 40 is likely to be minimal.
III.2.9 HS Code: 68 (articles of stone, plaster, cement, asbestos, mica or similar materials)
Table 13 shows the details of the product group 68. The share of Indian exports to the US as a proportion of total Indian exports to the world for the product group has increased to 32 percent in 2018. The proportion of GSP exports in the overall Indian exports to the US is at 34 percent in 2018. The shares are significant, indicating a negative fallout from the GSP withdrawal.
| TABLE 13. Details for HS Code 68 |
|
2008 |
2009 |
2010 |
2011 |
2012 |
2013 |
2014 |
2015 |
2016 |
2017 |
2018 |
| GSP exports as % of total Indian exports to the US |
35% |
37% |
31% |
23% |
30% |
31% |
29% |
30% |
34% |
38% |
34% |
| Indian Exports to the US as % of total Indian exports to the world |
26% |
22% |
22% |
21% |
23% |
24% |
24% |
29% |
28% |
29% |
32% |
| Data Source: USITC DataWeb and UN Comtrade databases |
Further, the year-on-year growth rate of the export value shows a healthy rising trend. The MFN rate in the range of 1.9 percent to 9 percent will now apply to all the products – increasing the export costs.
Therefore, the effect of the GSP withdrawal on commodities under HS Code 68 is likely to be negative.
III.2.10 HS Code: 94 (furniture; bedding, cushions etc.; lamps and lighting fittings not elsewhere specified or included; illuminated signs, nameplates and the like; prefabricated buildings)
Table 14 gives the details of the product HS Code 94. The share of Indian exports to the US as a proportion of total Indian exports to the world for the product is substantial at 39 percent in 2018. The share of GSP exports in the total exports to the US under this commodity group, however, has shown a declining trend and is at 14 percent in 2018. This indicates decreasing influence of GSP exports on total Indian exports to the US in this set of commodities.
| TABLE 14. Details for HS Code 94 |
| |
2008 |
2009 |
2010 |
2011 |
2012 |
2013 |
2014 |
2015 |
2016 |
2017 |
2018 |
| GSP exports as % of total Indian exports to the US |
27% |
25% |
23% |
20% |
19% |
18% |
17% |
16% |
15% |
15% |
14% |
| Indian Exports to the US as % of total Indian exports to the world |
23% |
23% |
26% |
27% |
30% |
32% |
33% |
39% |
38% |
37% |
39% |
| Data Source: USITC DataWeb and UN Comtrade databases |
The year-on-year growth rate of the export value shows a rising trend. The MFN rate in the range of 1.9 percent to 12 percent will now apply to this set of products. However, overall impact of GSP withdrawal will be minimal in this product group.
Therefore, the effect of the GSP withdrawal on commodities under HS Code 94 is likely to be minimal.
III.2.11 HS Code: 83 (miscellaneous articles of base metal)
Table 15 shows the details of the product group 83. The share of Indian exports to the US as a proportion of total Indian exports to the world for the product is 26 percent in 2018. The share of GSP exports in total Indian exports to the US under this product group is high but has shown a declining trend – from a high of 50 percent in 2008 to 42 percent in 2018. Thus, these two indicate that the product will be one of the significant product segments that would be affected by the withdrawal.
| TABLE 15. Details for HS Code 83 |
| |
2008 |
2009 |
2010 |
2011 |
2012 |
2013 |
2014 |
2015 |
2016 |
2017 |
2018 |
| GSP exports as % of total Indian exports to the US |
50% |
51% |
51% |
47% |
49% |
44% |
43% |
38% |
47% |
43% |
42% |
| Indian Exports to the US as % of total Indian exports to the world |
17% |
17% |
18% |
19% |
21% |
21% |
22% |
27% |
25% |
27% |
26% |
| Data Source: USITC DataWeb and UN Comtrade databases |
The year-on-year growth rate of the export value shows a rising trend. The MFN rate in the range of 2 percent to 7.5 percent will now apply to all these products.
Therefore, the effect of GSP withdrawal on products under HS Code 83 is likely to be negative.
III.2.12 HS Code: 76 (aluminium and articles thereof)
Table 16 lists the details of the product code 76. The share of Indian exports to the US as a proportion of total Indian exports to the world for the product group increases to 13 percent in 2018. The share of GSP exports in the total exports to the US under this commodity group has fallen drastically to 16 percent in 2018. This shows, in turn, drastic fall in reliance on GSP exports.
| TABLE 16. Details for HS Code 76 |
| |
2008 |
2009 |
2010 |
2011 |
2012 |
2013 |
2014 |
2015 |
2016 |
2017 |
2018 |
| GSP exports as % of total Indian exports to the US |
94% |
92% |
89% |
85% |
70% |
88% |
85% |
52% |
65% |
41% |
16% |
| Indian Exports to the US as % of total Indian exports to the world |
8% |
7% |
8% |
8% |
12% |
8% |
8% |
9% |
9% |
12% |
13% |
| Data Source: USITC DataWeb and UN Comtrade databases |
The year-on-year growth rate of the traded value shows a flat-line trend. The MFN rate in the range of 1.5 percent 6.5 percent will now apply to all these products. The trends indicate that the product will be minimally affected by the GSP withdrawal.
Therefore, the effect of the GSP withdrawal on commodities under HS Code 76 is likely to be minimal.
|
SUMMARY
|
| Product group HS Code & Description |
Likely impact of GSP withdrawal |
| 29 (organic chemicals) |
Negative |
| 84 (nuclear reactors, boilers, machinery and mechanical appliances; parts thereof) |
Minimal or neutral |
| 87 (vehicles, other than railway or tramway rolling stock, and parts and accessories thereof) |
Minimal or neutral |
| 73 (articles of iron or steel) |
Negative |
| 39 (plastics and articles thereof) |
Negative |
| 85 (electrical machinery and equipment and parts thereof; sound recorders and reproducers, television recorders and reproducers, parts and accessories) |
Negative |
| 42 (articles of leather; saddlery and harness; travel goods, handbags and similar containers; articles of gut (other than silkworm gut)) |
Negative |
| 40 (rubber and articles thereof) |
Minimal |
| 68 (articles of stone, plaster, cement, asbestos, mica or similar materials) |
Negative |
| 94 (furniture; bedding, cushions etc.; lamps and lighting fittings not elsewhere specified or included; illuminated signs, nameplates and the like; prefabricated buildings) |
Minimal or neutral |
| 83 (miscellaneous articles of base metal) |
Negative |
| 76 (aluminium and articles thereof) |
Minimal or neutral |
Out of a total 12 top GSP exports product groups, seven will be adversely affected due to the withdrawal, while in the remaining five product groups, the effect may be minimal or neutral. A standard disclaimer needs to be made at this point: Any type of impact in the future will also depend on the policy re-adjustments made in these sectors.
IV. Likely Impact of Withdrawal on Matching Sectors of Domestic Economy
In the next step of this analysis, the objective is to see the impact in the domestic production of these product groups in India. The authors encountered difficulties in matching corresponding data product-wise. The domestic industrial production and employment data of the organised sector of industry can be obtained from the ASI data source. However, ASI does not provide data according to the HS Code. Moreover, industrial data from ASI for the year 2016 are only available at the 2-digit and 3-digit NIC 2008 level. Owing to these statistical anomalies, best matches for the products have been found by matching product descriptions in 2-digit HS Codes and 3-digit NIC 2008 Codes. In this process, even approximate matches could not be made for six product groups.
| Table 17: Mapping of 2-digit HS Codes and 3-digit NIC 2008 Codes |
| HS code |
Description |
NIC Code |
| 29 |
organic chemicals |
201,202 |
| 84 |
nuclear reactors, boilers, machinery and mechanical appliances; parts thereof |
Could not be matched with NIC data |
| 87 |
vehicles, other than railway or tramway rolling stock, and parts and accessories thereof |
Could not be matched with NIC data |
| 73 |
articles of iron or steel |
Could not be matched with NIC data |
| 39 |
plastics and articles thereof |
222 |
| 42 |
articles of leather; saddlery and harness; travel goods, handbags and similar containers; articles of gut (other than silkworm gut) |
151,152 |
| 40 |
rubber and articles thereof |
221 |
| 68 |
articles of stone, plaster, cement, asbestos, mica or similar materials |
239 |
| 83 |
miscellaneous articles of base metal |
Could not be matched with NIC data |
| 94 |
furniture; bedding, cushions etc.; lamps and lighting fittings not elsewhere specified or indicated; illuminated signs, nameplates and the like; prefabricated buildings |
310 |
| 76 |
aluminum and articles thereof |
Could not be matched with NIC data |
| 85 |
electrical machinery and equipment and parts thereof; sound recorders and reproducers, television recorders and reproducers, parts and accessories |
Could not be matched with NIC data |
| Data Source: National Industrial Classification (NIC) 2008 published by the Central Statistical Organisation (CSO) |
The broadly matched six sectors are then analysed by examining the following elements. First, total persons engaged in the sector (labour) is divided by the output which is represented by the L/Y ratio. This ratio would indicate how much labour is used for each rupee worth of output. Therefore, if there is a fall in output as a result of a fall in exports on account of an increase in the cost of exports (due to the withdrawal of the GSP benefits), this ratio would show the impact on employment. Or in other words, how the fall in output may lead to a fall in employment as the owner would seek to reduce costs and therefore maintain revenue and profits. Second, a ratio of exports to the domestic production (taken from the Commerce Ministry site which has been taken at the HS 2 code level) in that particular sector (according to ASI data) – in percentage – has been calculated for the financial years 2014-15, 2015-16, and 2016-17 to see the relative importance of exports in the production and sales of that particular sector. Further, it must be noted that data from Indian government sources is provided according to the financial year from April to March. The data below provides a trend over three years of 2014, 2015 and 2016.
Table 18 highlights the sectors, among these, which are in the danger zone according to the earlier HS Code-based analysis.
| Table 18: Analysis of the impact of GSP withdrawal on the employment and output of Indian Industries |
| HS Code |
Description |
L/Y (2014) |
L/Y (2015) |
L/Y (2016) |
Ratio of exports to domestic production 2014-15 |
Ratio of exports to domestic production 2015-16 |
Ratio of exports to domestic production 2016-17 |
| 29 |
organic chemicals |
0.013 |
0.012 |
0.014 |
14% |
13% |
14% |
| 39 |
plastics and articles thereof |
0.025 |
0.026 |
0.027 |
19% |
21% |
19% |
| 42 |
articles of leather; saddlery and harness; travel goods, handbags and similar containers; articles of gut (other than silkworm gut) |
0.064 |
0.063 |
0.068 |
30% |
26% |
27% |
| 40 |
rubber and articles thereof |
0.025 |
0.028 |
0.027 |
23% |
20% |
21% |
| 68 |
articles of stone, plaster, cement, asbestos, mica or similar materials |
0.044 |
0.047 |
0.044 |
4% |
4% |
4% |
| 94 |
furniture; bedding, cushions etc.; lamps and lighting fittings nesoi; illuminated signs, nameplates and the like; prefabricated buildings |
0.036 |
0.041 |
0.038 |
46% |
64% |
47% |
| Data Sources: Ministry of Commerce and Industry, and Ministry of Statistics and Programme Implementation |
The L/Y shows the corresponding units of labour that is used for every hundred unit of output. The ratio is greater than 1 for all. Thus, the larger this ratio, the bigger would be the impact on employment and thus the more vulnerable the sector would be. The ratio is largest for product 42 (articles of leather; saddlery and harness; travel goods, handbags and similar containers; and articles of gut (other than silkworm gut)). Further, more than one-fourth of the domestic production in the leather products (product 42) are exported and the sector has a L/Y ratio of more than 0.06—therefore the withdrawal of GSP will likely impact this sector negatively even in employment generation. Meanwhile, product 94 (furniture; bedding, cushions etc.; lamps and lighting fittings not elsewhere specified or included; illuminated signs, nameplates and the like; prefabricated buildings) shows the highest level of export dependence in the given table, at around 50 percent on average over the last three years. Further, the L/Y ratio is greater than 0.03—therefore this sector is likely to be one of the most severely affected by the GSP withdrawal.
For product 29 (organic chemicals) export dependence is below 15 percent; moreover, the L/Y ratio is around 0.01. Dependence on exports is relatively less than other four product groups and more importantly, the use of labour input in the production process is low. On the other hand, product group 68 (furniture; bedding, cushions etc.; lamps and lighting fittings not elsewhere specified or included; illuminated signs, nameplates and the like; prefabricated buildings) has relatively higher L/Y ratio at around 0.04 but the export dependence is the lowest among all groups.
Therefore, for both product groups 29 and 68, the impact of GSP withdrawal will be difficult to predict in the short run. Some clusters of production may get affected but the overall impact may well be muted, unlike in the other four sectors.
However, due to the usual approximation and matching procedure applied in the analysis, it is prudent to highlight the statistical fact that these are likely impacts, estimated by overcoming the classification and data-availability hurdles.
V. Conclusion
The analysis presented in this paper clearly suggests that there will be sizeable negative impact on Indian exports to the US due to the GSP withdrawal. It further elucidates the impact on output, exports and employment in related sectors in domestic economy. There is a definite reason to worry about the GSP withdrawal.
Given the US administration’s recent combative attitude in trade, the US is unlikely to reconsider its decision withdrawing India’s GSP benefits. As the GSP has always been a privilege and not a right, India has to try its best to convince the US to not go for a total withdrawal of this benefit. Per-capita income figures of India, along with many other human development indicators, indeed suggest that India is still in the bracket of “developing country” and it has a long way to go before achieving the status of a “developed country”. The foremost GSP aim of lifting the countries with relatively lower per capita income to a higher level is still very much applicable in the case of the Indian economy.
Meanwhile, the Indian government should craft an elaborate plan to cushion the negative effect of the GSP withdrawal on domestic sectors. Such a plan has to consider the realistic possibility of an unrelenting United States. Finding new export markets for the worst-affected domestic sectors will be pivotal to that future plan. In an uncertain global trade scenario, finding new export markets is going to be an extremely difficult job. However, pushing the economy to the next level of growth has never been an easy task for any country.
REFERENCES
- Bhandari, G. R. “Has Generalized System of Preferences Scheme Influenced Nepalese Exports to the United States?” The Economic Journal of Development Issues, 17 & 18, No. 1-2, pp 29-39 (2014)
- Congressional Research Service. “Generalized System of Preferences (GSP): Overview and Issues for Congress”. Version 64, Updated on January 08, 2019.
- Department of State of the USA. “Country Reports on Economic Policy and Trade Practices: Submitted to the Committee on Foreign Relations, Committee on Finance of the US Senate and the Committee on International Relations, Committee on Ways and Means of the US House of Representative”. US Government Printing Office, Washington (2000).
- Graham, T. R. “The U.S. Generalized System of Preferences for Developing Countries: International Innovation and the Art of the Possible.” The American Journal of International Law, Vol. 72, No. 3 (July), pp. 513-541, 1978.
- Hoda, A., and Prakash, S. “Is the US GSP Scheme Benefitting Indian Trade?” ICRIER Policy Series, No. 7, November, 2011.
- Hoda, A., and Prakash, S. “Has India’s Trade Benefitted from the US’ Generalised System of Preferences?” Economic and Political Weekly, Vol. 47, No. 41, pp 59-68, 2012.
- International Business Publications. “India Business Law Handbook: Volume 1 – Strategic Information and Basic Laws”. Washington DC, USA, 2019.
- Kennedy, M. “WTO Dispute Settlement and The TRIPS Agreement: Applying Intellectual Property Standards in a Trade Law Framework”, Cambridge University Press, UK, 2016.
- Prydz, E. B., and Wadhwa, D. “Classifying countries by income.” The World Bank, 9 September 2019, https://datatopics.worldbank.org/world-development-indicators/stories/the-classification-of-countries-by-income.html
- UNCTAD – United Nations Conference on Trade and Development. “Food Safety and Environmental Requirements in Export Markets – Friend or Foe for Producers of Fruit and Vegetables in Asian Developing Countries?” United Nations, New York and Geneva, 2007, https://unctad.org/en/Docs/ditcted20068_en.pdf
APPENDICES
The graphical representation of the trends in export value and growth rates of the exports to the US under the GSP programme for the twelve selected HS product groups are given here. All data are extracted from USITC DataWeb.
HS Code: 29 (organic chemicals)
HS Code: 84 (organic chemicals)
HS Code: 87 (organic chemicals)
HS Code: 73 (organic chemicals)
HS Code: 39 (organic chemicals)
HS Code: 85 (organic chemicals)
HS Code: 42 (organic chemicals)
HS Code: 40 (organic chemicals)
HS Code: 68 (organic chemicals)
HS Code: 94 (organic chemicals)
HS Code: 83 (organic chemicals)
HS Code: 76 (organic chemicals)
[1] “Trump terminates preferential trade status for India under GSP”, 1 June, 2019, Business Line, https://www.thehindubusinessline.com/economy/trump-terminates-preferential-trade-status-for-india-under-gsp/article27398318.ece
[2] “GSP withdrawal will not have much impact on India’s exports: Commerce secy”, Livemint, 5 March 2019, https://www.livemint.com/news/india/gsp-withdrawal-will-not-have-much-impact-on-india-s-exports-commerce-secy-1551788173907.html
[3] Public Country Practice Hearing for the U.S. Generalised System of Preferences (GSP)
[4] Data source: USITC DataWeb
[5] UNCTAD, “About GSP”, 5 September 2019, https://unctad.org/en/Pages/DITC/GSP/About-GSP.aspx
[6] Hoda and Prakash (2012)
[7] Ibid
[8] Prydz and Wadhwa (2019)
[9] “World Development Indicators”, The World Bank, 17 September 2019, https://databank.worldbank.org/source/world-development-indicators
[10] “Low income” countries are those with per capita GNI $1,025 or less; “lower middle income” countries are those with a GNI per capita between $1,026 and $3,995; “upper middle income” economies are those between $3,996 and $12,375; “high income” economies are those with a GNI per capita of $12,376 or more.
[11] Hoda and Prakash (2012), op. cit.
[12] Ibid
[13] Ibid
[14] Hoda and Prakash (2011)
[15] Kennedy (2016)
[16] Federal Registrar, “Initiation of Country Practice Reviews of India, Indonesia, and Kazakhstan”, 27 April 2018, https://www.federalregister.gov/documents/2018/04/27/2018-08868/initiation-of-country-practice-reviews-of-india-indonesia-and-kazakhstan
[17] White House Proclamation, “Proclamation to Modify the List of Beneficiary Developing Countries Under the Trade Act of 1974”, 31 May 2019, https://www.whitehouse.gov/presidential-actions/proclamation-modify-list-beneficiary-developing-countries-trade-act-1974-2/
[18] Ministry of Commerce & Industry, “Impact of U.S. decision to end preferential terms for India”, Press Information Bureau (PIB), 21 June 2019, https://pib.gov.in/newsite/PrintRelease.aspx?relid=190588
[19] Ibid
[20] Ibid, Total Indian export figure is taken from USITC Dataweb, https://dataweb.usitc.gov/
[21] UNCTAD (2007)
[22] Shariq Khan, “Withdrawal of GSP benefit to India: Stakeholders weigh in on ramifications of Trump trade war”, Economic Times, 7 March 2019, https://economictimes.indiatimes.com/small-biz/trade/exports/insights/withdrawal-of-gsp-benefit-to-india-stakeholders-weigh-in-on-ramifications-of-trump-trade-war/articleshow/68298617.cms?from=mdr
The views expressed above belong to the author(s). ORF research and analyses now available on Telegram! Click here to access our curated content — blogs, longforms and interviews.

 PDF Download