This paper creates an index to track the achievement of UN Sustainable Development Goal 6 (SDG 6: Clean Water and Sanitation) across India’s states. The SDG 6 index incorporates both supply-side indicators and demand management variables, as well as institutional interventions. In this paper, state-wise indices are constructed to identify their respective performances in the domains of access to clean water and provision of sanitation facilities. The analysis finds that the worst-performing states in SDG 6 are the ones that are not facing shortages in water supply; this calls for a paradigm shift that will focus policymaking on demand management. While outlining the imperative for such a policy shift, the paper highlights the importance of the index within the broader emerging framework of Integrated Water Resource Management (IWRM).
Attribution:
Soumya Bhowmick, Nilanjan Ghosh and Roshan Saha, “Tracking India’s Progress in Clean Water and Sanitation: A Sub-National Analysis,” ORF Occasional Paper No. 250, June 2020, Observer Research Foundation.
1. Introduction
In 2015, the international community agreed to the UN Sustainable Development Goals (SDGs) – a list of 17 goals targeted to solve the problems of poverty and hunger, and tackle the effects of climate change, amongst others. Almost all the SDGs are embedded in one form of capital or the other: human (SDGs 1 – 6: poverty, hunger, health, education, water, sanitation, and gender equality); physical (SDGs 8 and 9: employment, growth, industry, innovation and infrastructure); natural (SDGs 13, 14 and 15: climate, life below water and life on land); and social (SDGs 10 and 16: social equality, peace, justice and strong institutions).[1]Amongst these, SDG 6—ensuring inclusive access to clean water and sanitation facilities—is of paramount importance as it is closely associated with a) health, in terms of water-borne infections and hygiene-related diseases; b) food security, for access to irrigation facilities; and c) livelihoods for millions of people across the globe, especially in the developing world.[2]In other words, SDG 6 should be viewed not only from the perspective of basic human rights but as a measure of how a country’s human capital base operates.[3]
Indeed, SDG 6 is a common developmental agenda in today’s world: to both ensure distribution, and sustainable demand management. Issues like water scarcity, flooding and lack of proper wastewater management impede sustainable socio-economic development. Since independence in 1947, India has been committed to provide water and sanitation to its people. After 1960, India started making progress on clean water and sanitation issues, keeping hygiene education as a primary goal. India’s water and sanitation program, supported by UNICEF, has provided not only services but also long-term training and technical support. The programs have also encouraged technological innovation and sought international expertise while at the same time strengthening inputs from the local communities and private sectors.[4]
The UN Sustainable Development Solutions Network’sSDG Index Report 2019places India at a rank of 115 out of 162 countries (score of 61.1 percent),[5]in terms of SDGs performance, lagging behind East Asia and South Asia’s average regional score of 65.7 percent. India’s massive population and its sheer diversity makes the implementation of policies a difficult task and progress on SDG 6 has been moderate. The same SDG Index Report observes that if India does not pick up its pace, the country will fail to reach the SDG 6 targets for 2030. At present, India scores 56.6 percent in terms of its SDG 6 achievement. The government think tank, NITI Aayog, has also published various reports on India’s water and sanitation situation—the Composite Water Management Index Reports and SDG India Index Reports – that will be discussed in the subsequent sections of the paper. Table 1 illustrates the major objectives of various goals under SDG 6.
Table 1. SDG 6 Targets and Indicators
SDG 6 Sub-Goals
Objectives
Indicators
6.1
Universal and equitable access to safe and affordable drinking water.
Proportion of population using safely managed drinking water services.
6.2
Adequate and equitable sanitation for all.
Proportion of population using safely managed sanitation services, including a hand-washing facility with soap and water.
6.3
Improvement of water quality through reduction of water pollution.
Proportion of wastewater safely treated; Proportion of bodies of water with good ambient water quality.
6.4
Increase of water use efficiency across sectors and reduce number of people suffering from water scarcity.
Change in water-use efficiency over time; Level of water stress: freshwater withdrawal as a proportion of available freshwater resources.
6.5
Implementation of integrated water resource management at all levels.
Degree of integrated water resources management implementation (0-100); Proportion of transboundary basin area with an operational arrangement for water cooperation.
6.6
Protect and restore the health of water-related ecosystems.
Change in the extent of water-related ecosystems over time.
6.a
International cooperation and capacity building in developing countries through waste water treatment, desalination, recycling and reuse technologies etc.
Amount of water- and sanitation-related official development assistance that is part of a government-coordinated spending plan.
6. b
Participation of local communities for improvement of water and sanitation.
Proportion of local administrative units with established and operational policies and procedures for participation of local communities in water and sanitation management.
Source:Sustainable Development Goals Knowledge Platform[6]
2. Changing Paradigms in Water Management
Contemporary human history involves the evolution of human interventions in the hydrological cycle, enabled by their ability to build increasingly bigger engineering structures to modify the flows of streams and rivers. For example, human control over the aquifers was established through stronger pumping technologies to take water out from the deep levels. Dams were erected to control floods and generate hydro-electricity at a large scale. These offered reasonable protection against seasonal water shortages and even spatial inequities in water availability. Moreover, irrigation canals made it possible for humans to both expand the land area that can be grown to food, and lengthen the growing season as well.
At the same time, as demand for water for meeting basic human needs started being satisfied, the ill-effects of development showed its signs. As urbanisation increased, the massive water demand of these burgeoning populations has resulted in scarcity in the agricultural areas. Indeed, increasing water demand was not seen as a threat, as water was viewed as being “abundant”, and its supply was “spatial”: i.e., water can be diverted to the water-scarce zones from the water-rich ones, through appropriate supply augmentation plans. For water to be distributed equitably, according to this view, societies only need to expand supply through interventions in the natural hydrological flows.[7]Eventually, water resource planning became reliant on linear projections of future populations, per capita demand, agricultural production, and levels of economic productivity.[8]
This paradigm began to shift towards the middle of the 20thcentury. Despite the impressive short-term successes of these interventions in providing larger volumes of water supply, it became apparent that addressing the new and emerging challenges is no longer possible in the long term unless fundamental changes take place in the way humans viewed water resources, to begin with. The “business as usual” approach became counter-productive, and a new interdisciplinary paradigm gained ground over the years in the form of Integrated Water Resource Management (IWRM).
This changing water paradigm[9],[10]represents a real shift in the way humans think about water and is reflected in some of the policy actions of the developed world, primarily amidst worsening of ecological concerns.[11]The preoccupation with investments in huge engineering interventions is being challenged by those who believe that higher priority should be assigned to projects that meet basic and unmet human needs for water.[12]In contemporary history of modern technology, the United States (US), which started the global trend of large engineering interventions over stream flows, is following “… a new trend to take out or decommission dams that either no longer serve a useful purpose or have caused such egregious ecological impacts so as to warrant removal. Nearly 500 dams in the USA and elsewhere have already been removed and the movement towards river restoration is accelerating.”[13]
Following these paradigmatic shifts in notions worldwide, other means to conserve water instream are becoming evident in various parts of the world.[14],[15]In Australia, for example, the Murray-Darling Basin Commission is contemplating on extending financial remuneration to farmers for saving on their allocation of irrigation water and to allow the savings to remain instream.[16]Meanwhile, Chile’s National Water Code of 1981 established a system of water rights that are transferable and independent of land use and ownership. The most frequent transaction in Chile’s water markets is the ‘renting’ of water between neighbouring farmers with different water requirements.[17]Helming and Kuylenstierna,[18]while cautioning against the damages that can be caused by supply augmentation plans, emphasise that “…Demand side management is therefore slowly becoming a new paradigm for water governance.”
Agriculture, for its part, has historically accounted for a big proportion of water demand all over the world.[19]Research has shown that water in agriculture can be used more efficiently as most of the water coming in agriculture through irrigation systems end up being wasted. Analysis shows that efficiency of water in agriculture worldwide is only 40 percent;[20]the situation is worse in India, where the efficiency of water in agriculture is 30 percent at best. The physical and economic water productivity of some of the most water-intensive crops like paddy is very low.[21]Agricultural fields in Punjab and Haryana, Uttarakhand and western Uttar Pradesh with abundance of irrigation, see heavy use of water from the Himalayan Rivers. This has reduced the flow of water downstream and increased water scarcity in the plains. A similar situation prevails in the Kaveri and Godavari basins. Such “water stress” has led to animosity between regions that share trans-boundary water.[22]
The problem and its solution is evident using mainstream economic analysis. Traditionally, water was seen as a common property resource, and policymakers ensured access through subsidies and other supply-side arrangements, not putting any limits to indiscriminate extraction. This has resulted in the classic problem of the “Tragedy of Commons”,[23]where individual consumption of common property resources resulted in overconsumption and depletion of the resource. Economic theory prescribes two solutions: the command and control approach, which entails a tough implementation; or inducing excludability in the resource, which is easily implementable by treating water as an economic good. Efficient pricing decisions and ‘metering’ of water can help improve conservation efforts.
In many cities, like Bogor in Indonesia, this practice has already started.[24]Closer home, Delhi too has been practicing water pricing mechanisms for many years, coordinated by the Delhi Jal Board.[25]There is growing interest in using “block rates” or conservation rates, whereby as households increase the amount of water they consume, they are charged higher; this encourages conservation. This is another form of demand management. In building upon the economic solutions for water conservation, there is a need to think of comprehensive evaluation through the “inclusive valuation” framework in which ecological economics has an important role to play.[26]Water pricing entailing the operation and maintenance costs—and also recovering the environmental costs from users—has widely been acknowledged as an important mode of demand management. This helps not only in sustaining the resource for future use, but also in keeping water in-stream and ensuring “environmental flows”.[27]
3. The Tenets of Integrated Water Resource Management (IWRM)
The paradigm change introduced in the earlier section has been defined as the shift from a reductionist “hydrologic” paradigm to a “hydro-eco-social” paradigm.[28],[29]The objectives are clear under this new thinking: securing water for humans, securing water for ecosystems, and securing water for food. At the same time, the gender dimension in governance of scarce resources is also becoming more critical.
The professional and scientific views of water resource management are changing rapidly, based on scientific analyses of past mistakes and availability of new information. The new paradigm recognises human society as a subsystem of the biosphere in which water is a key element.[30],[31]Based on the various contending thoughts and ideas, the notion of Integrated Water Resource Management (IWRM) has been conceptualised in the form of the following points:[32]
a)Water is viewed as an integral part of the global hydrological cycle, and not as a stock of material resource to be used for the satisfaction of human requirements: With continued emphasis on the economic benefits of water, its ecological functions in sustaining ecosystem health, and therefore human health, have been largely ignored. In the emerging holistic and interdisciplinary paradigm, water is viewed in the context of the broader global hydrological cycle. Neglecting to recognise the ecological cost of diverting water is internally subsidising the use of water for economic purposes at will.[33]
b)Supply of ever-increasing volumes of water is not a pre-requisite for continued economic growth. The availability of water has traditionally been seen as a pre-condition for continuing economic growth.[34]The new paradigm, however, suggests the opposite: economic growth is delinked from water supply augmentation plans. This helps shift the focus to demand-side management of water, an approach long overdue. It also helps create a pathway for low-carbon growth.[35],[36]
c)Clear and strict prioritisation of various types of needs and demands for water, including those by ecosystems, is needed. The new and interdisciplinary paradigm prioritises the various competing uses of water: one is between the needs of the ecosystem and the needs of human society; the other is among the needs of human societies themselves.[37]An important component of current water resource management is setting the right priorities by understanding the trade-offs involved.
d)There is a need for comprehensive assessment of water development projects within the framework of the full hydrological cycle. A crucial element of the new and holistic paradigm is the creation of an interdisciplinary knowledge base able to offer non-partisan and comprehensive assessments of the justifications and impacts of water resource development projects.[38],[39]
e)A transparent and interdisciplinary knowledge base for understanding the social, ecological and economic roles played by water resources is required. The complexities of managing water-related problems include a real understanding of the nature of water resources and their complex links and interrelations with other systems. This means that single-disciplinary approaches will no longer work and new, innovative strategies will have to be developed for coping with water problems, involving multidisciplinary approaches.[40],[41]
f) Droughts and floods are to be viewed in the wider context of the ecological processes associated with them.
g)Appropriate new social and economic instruments for promoting careful and efficient use of water resources or for the reduction of damage to their quality from pollution should be developed. The new paradigm emphasises the need for a new economic perspective evaluation of water. The question of pricing of water, the desirability, or otherwise, of the growing trend towards privatisation of water resources as the final solution, the ecological economic valuation of the ecosystem services provided by water systems, are all part of a rapidly emerging knowledge base of water economics.
h)There is a need to accept restructuring the institutional frameworks for water resource development at local, state, river basin and national levels for making it equitable, sustainable and participatory.
The above list is indicative and not exhaustive. The elements are subject to further refinement as the process of the shaping of a new paradigm progresses. Such a list, for the time being, can offer the fundamental guidelines for putting the new paradigm into force. Given the above, the new emerging paradigm recognises that irrigation development has often come with a high environmental cost,[42]including degradation of aquatic ecosystems, fragmentation and desiccation of rivers, and drying up of wetlands. In many cases the monetary values generated by irrigation have been less than the monetary values generated by the ecosystems they replaced.[43],[44]Falkenmark[45]stresses that by benefitting from the shared dependence of humans and ecosystems on water, IWRM can integrate land, water and ecosystems and promote the three E’s – two human dependent ones (social equity and economic efficiency), and one related to the ecosystem (environmental sustainability).
4. The Scenario in India
a Water Demand in India
Fuelled primarily by industrial requirements, demand for water in India was projected to double from 23.2 trillion litres to 47 trillion litres between 2015 to 2025.[46]During the same period, domestic demand was expected to grow by 40 percent from 41 to 55 trillion litres where irrigation will require 14 percent more—592 trillion litres up from 517 trillion litres currently.[47]Indeed, demand for water has always been rising due to increase in population. The traditional method of meeting demand was through supply-side interventions. India has substantially increased its water supply coverage with bigger engineering structures built to modify the flows of streams and rivers. Groundwater is also used with the help of stronger pumping technologies. The annual groundwater resource of India has been estimated at 433 billion cubic meter (bcm), of which 399 bcm is considered to be available for various uses. The irrigation sector is the major consumer of groundwater, accounting for 92 percent annually.[48]
The drinking water problem has also been effectively tackled through these advance technological methods. This whole process could only be made possible by high-level political commitment and technologically strong experimentation. At the same time, excessive subsidisation of electricity and irrigation waters have led to unsustainable extractions of groundwater, and have even led to conflicts over transboundary water sharing.[49]The estimated rate of depletion of groundwater in north-western India is 4.0 centimetres of water per year, equivalent to a water table decline of 33 centimetres per year.[50]
b India’s Policy Challenges
Global estimates show that around 2 billion people drink water from sources that are contaminated by faecal matter.[51]Although since 2000, 2.1 billion people have gained access to basic sanitation facilities, some 2.4 billion people still lack access to basic sanitation as of 2017 – out of this almost 673 million people continue to practice open defecation.[52]In India, 163 million people do not have access to safe water and 210 million lack access to improved sanitation as of 2017.[53]According to the NITI Aayog in 2019, 75 percent of households do not have drinking water on premise and about 84 percent of rural households do not even have piped water access.[54]The government-commissioned survey, the National Annual Rural Sanitation Survey (NARSS) 2018-19, estimated that 93.1 percent of rural households now have access to toilets. The second edition of the survey also recorded that 96.5 percent of people who had access to toilets use these facilities.[55]
Building facilities for safe water and sanitation will not work without behavioural change. In majority of households, even if the source of water is safe, the water is contaminated by unhygienic conditions and practices by people in the households.[56]As early as in 2010, the World Bank estimated that inadequate water and sanitation facilities reduces India’s gross domestic product by about 6.4 percent.[57]Additionally, open defecation remains a major concern in India, despite the Swachh Bharat Abhiyan scheme (Clean India Campaign), of the Central government.
The UN points to India’s seminal mission – Swachh Bharat Abhiyan in addressing SDG 6 in India. This flagship programme, launched on 2 October 2014 is aimed at promoting cleanliness and sanitation in a holistic manner. The programme claims to have built more than 100 million household toilets and created more than 700 open defecation-free districts across India.[58]In the Union budget 2020-21, approximately INR 123 billion was allocated to the Swachh Bharat Abhiyan.[59]
The major Union-level initiatives in the past two decades on urban water and sanitation needs are outlined in Table 2. Most of these policies depict an effort to provide guidance to the states and cities in adopting specific policies and governance structures for improving service delivery to the customers. As services are decentralised to the urban local bodies, appropriate institutions at the local levels are also needed which can implement them in a responsible, efficient, and accountable manner as per the Advisory Note on Improving Urban Water Supply and Sanitation Services (WSS) in India.[60]The Advisory guides cities in undertaking the Service Improvement Plans (SIPs) by focusing on outcomes rather than outputs and ensuring efficiency of capital investments. It also identifies policies and principles for clarifying the mandates, improving governance, financing and developing infrastructure, regulating services, and building capacity.
Table 2. Central Government Initiatives for Urban Water and Sanitation
Initiatives
Objectives
1. Jawaharlal Nehru National Urban Renewal Mission (JNNURM);
2. Ministry of Urban Development – High Powered Expert Committee, 2008;
3. 12thFive Year Plan Committee.
Urban infrastructure, water supply, drainage.
1. Ministry of Urban Development – Advisory Note on Improving Water Supply and Sanitation Services, 2012;
2. National Water Policy 2012;
3. MoUD and MoHUPA Centres of Excellence and National Resource Centre.
Development of water supply and sanitation, operationalising business plans, service improvement plan, capacity building, reducing leakages in water supply and re-use of water.
Steering Committee on Drinking Water Supply and Sanitation, Planning Commission, GOI, 2002.
Levy of water charges for maintenance and future improvement schemes, supply of healthy drinking water.
1.Swachch Bharat Mission;
2. National Urban Sanitation Policy;
3. Service Level Benchmarking Initiative;
4. National Sanitation Ratings of Cities;
5. Central Public Health and Environmental Engineering Organization Manuals;
6. Septage Management Advisory;
7. Advisory on Water and Sanitation Services.
Healthy sanitation practices, awareness and behavioral change in people with regard to urban water and sanitation, waste management and drainage, private sector participation.
Source:Compiled from various MoWR and MDWS Reports
Water and Sanitation can solve public health problems significantly in India.[61]Globally, diarhhoea, a water-borne disease highly prevalent in the poorer nations, alone kills more children in a year than HIV/AIDS, tuberculosis, and malaria, combined.[62]According to the United Nations, one-fifth of all child deaths in the world due to severe diarhhoea are in India. Hygiene, Sanitation and Water (HSW) interventions can reduce occurences of illnesses like diarrhoea, ascariasis, cholera, scabies, trachoma, amebiasis.[63]The benefits of HSW are not limited to these effects; it has positive spillovers as well. Malnourished children, recovering from diarrhoea, are vulnerable to pneumonia in 26 percent of all childhood pneumonia cases. Thus, preventing diarrhoea will help bring down the incidence of other dieases as well.[64]Reduction in health risks and malnutrition will also have positive effects in school performance and attendances of children,[65]mitigating development issues such as hunger and poverty in the long run.
The Ministry of Jal Shakti (MoJS) was formed in May 2019 by merging the two erstwhile ministries—theMinistry of Water Resources, River Development & Ganga Rejuvenation and theMinistry of Drinking Water and Sanitation– to deal with water and sanitation issues in India both at national and international levels.[66]Coincidentally, this move has also shifted the focus of the share of budget allocation away from drinking water (from 87 percent in 2009-10 to 31 percent in 2018-19). In the same period, the share of allocation to rural sanitation has increased from 13 percent to 69 percent.[67]Urban drinking water supply and sanitation are dealt with by the Ministry of Housing and Urban Affairs (MoHUA).
The flagship programme of the MoJS, NamamiGange in 2014 with a budget outlay of INR 200 billion, created an impetus for the implementation of SDG 6 by focusing on maintaining adequate water supply from the River Ganga and its tributaries which is an essential source of usable water for a large portion of the Indian population. A few key achievements of the Namami Gange programme in line with SDG 6 include, creating sewerage treatment capacity, river surface cleaning, river front development, and public awareness.[68]Memorandums of Understanding (MoUs) have been signed with various central ministries for synergising the government schemes.[69]
The Estimates Committee of Parliament (2015) observed that piped water supply was available to only 47 percent of rural habitations, out of which only 15 percent had household tap.[70]As of February 2018, 74 percent of households have access to safe drinking water (receiving 55 litres per capita per day), and 22 percent are partially covered (receiving less than 55 litres per capita per day).[71] Under the Government’s Har Ghar Jal scheme (currently known as the Jal Jeevan Mission) initiated in the Union Budget 2019, the Jal Jeevan Mission aimed at providing Functional Household Tap Connection (FHTC) to every rural household by 2024. It is estimated to be operationalised at an expected cost of INR 3.6 trillion that will cover 81 percent of all rural households in India.[72]
Under the Budget 2020-21, the Finance Minister declared the budget around ‘ease of living’ in synchronisation with the ‘ease of doing business’ for inclusive access to opportunities. Theoretically, the budget portrays a comprehensive framework that looks at addressing the interconnectedness between financial equity, economic progress, and a progressive society through its three main themes: ‘Aspirational India’, ‘Economic Development’ and ‘Caring Society’. Water, wellness and sanitation were identified as a key theme under ‘Aspirational India’ – highlighting the importance of enhancing the human capital base in the country. As expected, most of the policies announced under this sub-theme show a deep correlation[73]with SDG 3 (Good Health and Well-Being) but misses out on the larger concerns of demand-side aspects of efficient water management and enhancement of sanitation infrastructure – which forms the core of SDG 6.
5. Metrics of Water Management
Evidence from the poorer countries suggest that women and children spend a significant proportion of their productive time in procuring water for daily use.[74]Most economic analyses fail to either estimate these costs or incorporate them into the analytical framework. According to thecapabilities approachto defining poverty, proposed by Nobel laureate Amartya Sen, the real costs associated with procuring water in rural areas add to the opportunity cost that they have to bear in terms of access to opportunities for better education, health and food.[75]Concerns such as these link poverty, and its drivers, to water management in an equally significant manner. While many measures of poverty have identified its links with health, education, food, politics and vulnerability, related issues on water have mostly appeared in the fringes of these discourses. A more explicit link between water availability and poverty is the primary motive behind the creation of a Water Poverty Index of 2002.[76]Previously, most economic measures of poverty have been monetary in nature which resulted in a failure to attribute the non-monetary qualities of human well-being, and more so of the depreciation of natural capital. The health of an ecosystem is paramount in determining the health of human life-support systems.
A holistic water poverty index must include components that capture physical water availability, water quality, ecological water demand, social and economic measures of poverty, and institutional factors that influence access to water. When the link between poverty and water availability is established, effective water management will require an understanding of the relationship between water availability and water demand. Understanding patterns of water demand will in turn be essential in ensuring efficient use of the resource. Since human behaviour is a major factor influencing demand patterns of natural resources like water, achieving a sustainable development pathway will only be possible if humans can be incentivised to act accordingly. Quantifiable estimates from a water poverty index will help determine the exact nature and source of demand. Based upon information and indication from the WPI, sectors that have the highest impact on an economy can be identified. Subsequently, policies can be formulated to push[77]the economy in the desired direction of sustainability.
The index may be calculated using various methods such as the conventional composite index, capturing the gap between predetermined standards and actual empirical values for each parameter, matrix approach or time-analysis approach. It is a comprehensive tool that will aid water management decision-making and make a direct contribution to the alleviation of poverty in poor and water-stressed countries—the concentration of which is likely to increase with time.
In the same vein, the Composite Water Management Index (CWMI) was first developed by the NITI Aayog in 2018. The second edition of the report was launched in 2019 as a tool to assess and improve the management of water resources in the country. The CWMI 2.0 is an extended version of the previous report as it includes two new Union Territories—Delhi and Puducherry.[78]The index was calculated based on weights (in brackets) assigned to nine broad themes such as: source augmentation and restoration of water bodies (5), source augmentation for groundwater (15), major and medium irrigation (15), watershed development (10), rural drinking water (10), urban water supply and sanitation (10), policy and governance (15), participatory irrigation practices (10), and sustainable on-farm water-use practices (10). However, the CWMI framework has some weaknesses, outlined in the following paragraphs. (The SDG6 index constructed by the authors of this paper attempt to address these failings.)
There is lack of clarity on how the ranking scheme was conducted and why these parameters were included. Even if it is assumed that the CWMI paradigm has been unconventional in prioritising sustainability, water usage efficiency and the supporting policies, there has been an ongoing debate regarding the scientific reliability, authenticity and the completeness of this exercise by the NITI Aayog.[79]
For example, it makes little sense why the states are divided into ‘Northeastern and Himalayan states’ and ‘Non-Himalayan States’ where the river systems for the two kinds of region have been assessed. This seems like a redundant exercise as a river basin-based approach would have been more methodical.[80]The CWMI document has also missed out on Jammu and Kashmir in the states it has ranked.
Further, CWMI does not take into consideration the physical condition of the resource in terms of availability subject to the demand-side changes. This cannot provide a holistic picture for better governance mechanisms.to emerge. There needs to be a shift in the country’s policy of managing water crises—from an approach of “supply and supply more water” towards measures and interventions that improve water-use efficiency.[81]A holistic composite index will require a better representation of both supply, demand, and institutional interventions, as attempted in this paper.
The CWMI exercise fails to contain information needed to identify new opportunities and the requirement of new investments after identifying the gaps in the existing infrastructure.[82]It is for this reason that the SDG 6 index developed in this paper argues that a holistic water management score needs to include parameters related to sanitation alongside indicators of water demand, water supply, and other environmental concerns. The index developed in this paper contains indicators ranging from slum population to waste disposal which are elemental in prescribing water policies and also help in underpinning the importance of water and sanitation infrastructure in India.
6. SDG 6 in India: Sub-National Evaluation
The lack of data availability and monitoring heavily constrains measuring the implementation progress with regard to all the SDGs. The present sub-national evaluation of SDG 6 uses cross-sectional data on seven parameters (see Appendices 1 – 7) that were chosen as per the latest data availability with reference to recommendations from the Central Statistics Office, Ministry of Statistics and Programme Implementation.[83]For example, the Swachhata Report of 2016-17 is the latest database available at the state level in India and the successive Swachh Survekshan reports of 2018 and 2019 disaggregate the data across cities. The list of parameters in Table 3 is not exhaustive but is indicative of the ‘clean water and sanitation’ scenario in the 23 Indian states. The Union Territories and the Northeastern States (except Assam) have been excluded from the study due to unavailability of data.
Table 3.Indicators of ‘Clean Water and Sanitation’
SDG 6 Components
Sub-Goals & Indicators
Data Sources
Clean Water
6.a. Composite Water Index Score (2018-19)[84]
NITI Aayog, June 2018-19 – Composite Water Management Index: A Tool for Water Management.[85]
6.6. Water Body (2018)[86]
School of Oceanographic Studies, Jadavpur University (2018).
6.4. (Complement Of) Water Withdrawal Per Unit of Ground Water Availability (2012)[87]
Q. No. 2131, Dated: 24/07/2014, Ministry of Water Resources, River Development and Ganga Rejuvenation, LokSabha&LokSabhaUnstarred Question No. 4426, dated 03.05.2012.
Sanitation
6.b. (Complement Of) Slum Population (2011)[88]
Registrar General of India, Census of India, 2011.
6.2. Number Of Households Having Access To Water For Toilets (2016-17)[89]
Swachhata Report, 2016-17 (MOSPI).
6.2. Wards Having Access To Liquid Waste Disposal For Community And Public Toilets (2016-17)[90]
Swachhata Report, 2016-17 (MOSPI).
6.2. Solid Waste Disposal – Total Waste Processed (2016-17)[91]
Swachhata Report, 2016-17 (MOSPI).
Source:Authors’ own
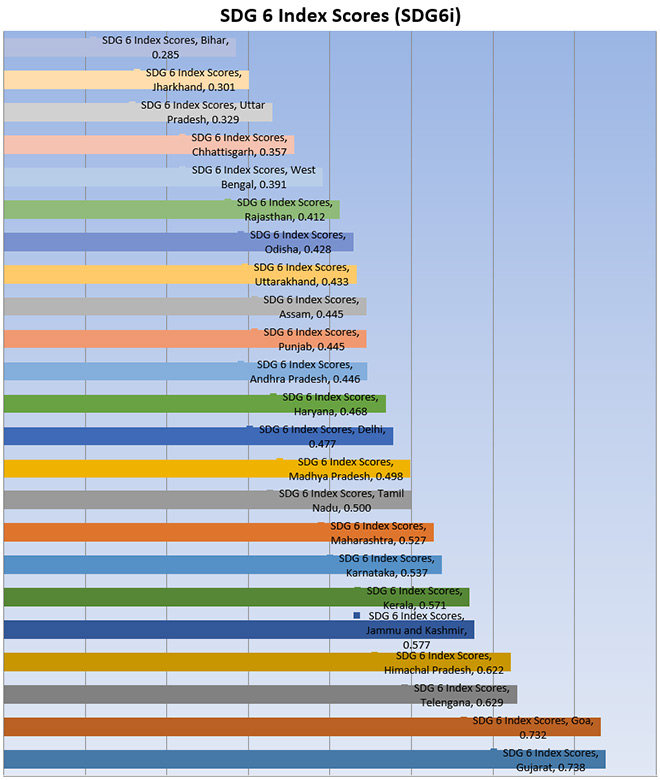
Using the data[92]on these seven parameters,[93]weights were assigned to each of them by Principal Component Analysis[94]for statistical robustness. Finally, the state-wise composite SDG 6 indices are derived (See Figure 1.)
This index is an advancement over the NITI Aayog’s SDG 6 index scores both in 2018 and 2019[95]mainly on two accounts: (1) the “ad-hoc” nature of weight determination of the component indicators has been removed through robust statistical methods like principal component analysis; and (2) The NITI Aayog’s SDG 6 indicators are fewer in number, compromising on most of the aspects covered by the targets of SDG 6. Even the UN SDSN’s SDG Index and Dashboard Reports do not evaluate India at a sub-national level.
Figure 1. SDG 6 Index Scores (out of 1)
Source:Authors’ own
It is noteworthy that most of the states that are not performing well in SDG 6 are endowed with water resources as they lie along the Ganges basin (Bihar, Jharkhand,Uttar Pradesh, Chhatisgarh, West Bengal); while the better performing states are relatively water scarce. In the construction of the indices, greater emphasis has been given on the efficient use of water and its availability of improved sanitation facilities. Further, this study looks at the correlation between water availability in the states versus the management of water and sanitation facilities. In this context, SDG 6 is presented in terms of classifications delineated by the following formula. This analysis assumed the SDG 6 index to be a sample from a symmetric distribution (normal), and classifies the states as the following:
where, μ (= 0.485) is the mean of the SDG6i scores across the states and σ (= 0.122) is the standard deviation of the SDG6i scores across the states.
Similarly, using a geographical estimation of water availability in India by the World Resources Institute (WRI),[96]the states are categorised into three sections: High Availability, Medium Availability, and Low Availability.[97]Finally, the water availability and the SDG6i are juxtaposed to arrive at the following matrix.
The matrix shows that the states of Gujarat and Telangana have the worst water availability but high SDG 6 index scores. Conversely, Uttar Pradesh, Jharkhand and Bihar, in spite of having high water availability, are the worst performers in terms of SDG6i. It is noteworthy that out of the 23 states studied for this paper, only one (Goa) shows a positive correlation between the two variables. Rather, there is some form of clusterisation of the states around the downward sloping 45-degree line, indicating a negative relation between the two variable classifications. Indeed, most of the states (12) can be found in the diagonal cells along the downward sloping 45-degree line – (Bottom Performers x High Availability), (Medium Performers x Medium Availability) and (Top Performers x Low Availability). Thus, this analysis re-establishes that the focus of water issues in India should be shifted from a reductionist supply-side perspective towards better management and governance of water resources.
These observations establish that scarcity drives better utilisation and management of resources since the marginal utility derived from the particular scarce resource is much higher than that of an abundant resource. In the Indian scenario, distribution of water resources is not uniform and therefore needs a differential approach towards water management by efficiently tackling the demand side. According to a study by the WRI[98], out of 17 countries facing the highest levels of water stress in the world, India receives the maximum amount of annual rainfall. Despite a heavy supply of water resources in many Indian regions, the Ministry of Water Resources points towards over-exploitation and mismanagement of water for the prevailing water stress in the country— where irrigation plays a critical role in contributing towards the deterioration of water resources in the country.
7. A Holistic Index in IWRM
This paper proffers that the SDG index developed here is a holistic index that is embedded in the notion of IWRM. A plethora of supply-side indicators exist, including the ones by Falkenmark et. al.[99]and another by Ghosh and Bandyopadhyay.[100]However, their application requires highly sophisticated mathematical and econometric treatments, and the use of extensive time-series data. NITI Aayog’s CWMI has a strong demand-side variable presence, but its weaknesses have already been explained earlier. Therefore, it is proposed that a holistic index like the ones represented by SDG 6 index taking into consideration both demand and supply is embedded in the emerging paradigm of IWRM. The elements are outlined in the following paragraphs.
a. Greater supply of water is not a pre-requisite
It is well known by now that supply development has led to disputes between regions that share water resources, as illustrated in the cases of Cauvery in India and Colorado in the US.[101]To obtain economic benefits, there was the associated social cost of conflicts, which led to unsustainable resource use and hostile and untenable hydropolitical conditions in the basins.[102]That supply augmentation plans can be counter-productive by raising the social and ecological costs, has been exhibited by these two cases. That proper demand management can lead to effective development is exemplified by Israel.[103]One needs to look at the performance of the index developed here that reflects on the overall water governance, rather than only per capita physical availability of water.
b. All water systems are viewed as integrally linked with the hydrological cycle and contribute to the ecological system
The rationale of water diversion and the pursuit of supply augmentation plans were based on the old paradigm of water resource development. The SDG 6 index, by taking into consideration the demand-side indicators, reinforce the fact that water can be left for the ecosystem so as to meet the ecological needs. In the process, it acknowledges the basic tenet of IWRM: addressing the trade-off between human economic needs and the broader ecosystemic needs for the concerns of sustainability.
c. Comprehensive assessment of the water development projects keeping the integrity of the full hydrological cycle
From the holistic viewpoint of eco-hydrology, human intervention in the hydrological process for extracting economic services has negative ecological consequences, which is in contravention with the principles of “sustainable development”. The attempt to diminish scarcity of water for the economic services imposes an inherent cost in the form of an enhanced “scarcity value” of the ecosystem services. This is captured in the SDG 6 index, albeit not strongly. Therefore, the need for understanding the optimal trade-off between the two “scarcity values” is important, and can serve as an important criterion in the comprehensive assessment of water development projects.
d. Prioritisation of water needs
This index, in a disaggregated format, helps in understanding the priorities in terms of water allocation. However, this is still at an emerging stage, and requires to be strengthened further.
e. The New Economics of Water
The index provides an overall assessment of the state of the resource, which helps in providing a means to understand and evaluate the emergence of institutional mechanisms for water resource management, provides institutions with an objective instrument for better management practices, and offers the foundation for a new ecological economic valuation through the scarcity valuation of ecosystem services provided by water systems.
f. An Interdisciplinary Knowledge Base
Transdisciplinary interactions, as argued by Falkenmarket al,[104]become extremely important in the context of IWRM. SDG6 index takes into consideration various variables, but the flexibility lies with making it more robust by bringing in more variables from the hydro-meteorological sciences and social sciences at the various levels. In the regime of the old paradigm, disciplines were not intersecting with each other in a way that truly understands the potential contributions of other areas of competence, not even from closely neighbouring disciplines.
The new paradigm demands a real understanding of the nature of water resources, their complex links and interrelations with other systems, and how societies manage them. Such complex interactions can no longer remain compartmentalised as a single-disciplinary approach. A holistic governance mechanism requires a transdisciplinary knowledge base (that requires interaction of social sciences, geophysical sciences, agricultural sciences, economic sciences, and ecology and the environment.) Simultaneously, it would go on to buttress the existing framework of water law, with the use of objective tools like this index.
8 The Way Forward
India’s progress towards the achievement of SDG 6 is subject to the type of federalism that exists in the country and its impacts on governance. In theory, a competitive economy produces outcomes that are superior and efficient; in a federal system, competition between states is likely to produce policy outcomes that will benefit the entire nation. The fact that the best and worst states are named in the public domain in terms of their SDG 6 achievements will lead to a competitive spirit amongst states which may be a way forward for connecting good water governance with good politics. It establishes that the concepts of regional competitiveness are gaining equal importance as national competitiveness.[105]
A caveat is in order: The index developed for this study does not consider eco-hydrological processes and environmental flows variables, nor shows its application at the basin scale. Yet, there is indicative evidence of the presence of such variables, as a lower human demand for water implies that more is left for the ecosystem. Leaving water instream and making them flow through the river channel for sustenance of the ecosystem so that its structure and functions are sustained, and ecosystem services are not disrupted, are the pillars of IWRM. From that perspective, however, this index can capture the performances of states which have done better in demand management as also being endowed with less natural supplies.
The Business and Sustainable Development Commissions Report[106]identifies immense business opportunities associated with the SDGs and estimates their aggregate global potential value in 2030 at US$ 12 trillion in current prices. More than half of these business solutions reside in developing economies such as India with large markets. International public-private, public-public, private-private partnerships leveraging on individual comparative advantages is the way forward to incentivise projects and successfully implement measures related to clean water and sanitation.
Apart from financial assistance from the multilateral development banks, many multinational companies in this sector such as AquaFed, Cargill and P&G are actively collaborating with state and non-state actors in developing nations for drinking water and sanitation facilities. For example, according to the US Council for International Business, the clothing retail company,Gap Inc.has partnered with Swasthi Health Resource Centre in building water filtration plants in rural India which already caters to approximately 5,000 households and 29 schools in 30 villages across India as part of their Corporate Social Responsibility initiatives.[107]Despite such measures, it must be acknowledged that private investment in water sector has not been adequate and it has mostly been concentrated in the urban spaces. Another policy which holds much relevance in contemporary India is pricing water across all urban regions for efficient utilisation and progressive distribution of funds for areas that are lagging behind in terms of water and sanitation facilities. However, water pricing is an increasingly competitive, state-specific political issue.
In the current scenario the importance of water and sanitation infrastructure is bound to grow—in order to contain the COVID-19 pandemic in the near future, and also to keep similar hygiene-related morbidities in check. In conclusion, it must be noted that implementation of SDG 6 will effectively influence the long-term capital infrastructure in India – physical, human, natural and social – and therefore the realisation of these goals are imperative for FDI inflows and enhancing the ‘ease of doing business’ in the long term. Earlier research by these authors has shown,[108]with the help of an econometric exercise, that promoting SDGs essentially improve business competitiveness in an economy thereby creating enabling conditions in India’s competitive federalist structure. Finally, there is a desperate need to realign India’s water and sanitation policies towards demand management and replace the myopic focus on supply augmentation.
Appendices
Appendix 1: Composite Water Index Score (2018 – 19)
Rank
States
Scores
1
Gujarat
1.000
2
Madhya Pradesh
0.860
3
Andhra Pradesh
0.840
4
Karnataka
0.600
5
Maharashtra
0.580
6
Himachal Pradesh
0.540
7
Jammu and Kashmir
0.540
8
Punjab
0.540
9
Tamil Nadu
0.500
10
Telengana
0.480
11
Chhattisgarh
0.460
12
Rajasthan
0.440
13
Goa
0.360
14
Kerala
0.320
15
Odisha
0.320
16
West Bengal
0.260
17
Bihar
0.240
18
Delhi
0.240
19
Haryana
0.240
20
Uttar Pradesh
0.240
21
Jharkhand
0.180
22
Assam
0.100
23
Uttarakhand
0.000
Appendix 2: Water Body (2018)
Rank
States
Scores
1
Jammu and Kashmir
1.000
2
Odisha
0.913
3
Goa
0.604
4
Assam
0.484
5
Telengana
0.436
6
Himachal Pradesh
0.408
7
Gujarat
0.388
8
Maharashtra
0.369
9
Karnataka
0.350
10
Chhattisgarh
0.337
11
Madhya Pradesh
0.286
12
Andhra Pradesh
0.269
13
Kerala
0.225
14
Tamil Nadu
0.189
15
Jharkhand
0.187
16
Uttarakhand
0.161
17
Bihar
0.145
18
West Bengal
0.138
19
Uttar Pradesh
0.128
20
Rajasthan
0.126
21
Punjab
0.044
22
Haryana
0.003
23
Delhi
0.000
Appendix 3: (Complement of) Water Withdrawal as a Percent of Water Availabilty (2012)
Rank
States
Scores
1
Uttarakhand
1.000
2
Assam
0.988
3
West Bengal
0.985
4
Maharashtra
0.981
5
Punjab
0.981
6
Madhya Pradesh
0.972
7
Chhattisgarh
0.967
8
Andhra Pradesh
0.966
9
Telengana
0.966
10
Uttar Pradesh
0.963
11
Odisha
0.957
12
Bihar
0.953
13
Gujarat
0.949
14
Karnataka
0.947
15
Haryana
0.937
16
Jharkhand
0.933
17
Tamil Nadu
0.914
18
Goa
0.866
19
Jammu and Kashmir
0.852
20
Rajasthan
0.850
21
Himachal Pradesh
0.844
22
Kerala
0.746
23
Delhi
0.000
Appendix 4: (Complement of) Slum Population (2011)
Rank
States
Scores
1
Kerala
1.000
2
Goa
0.953
3
Assam
0.908
4
Jharkhand
0.902
5
Gujarat
0.849
6
Himachal Pradesh
0.781
7
Bihar
0.734
8
Delhi
0.723
9
Rajasthan
0.688
10
Karnataka
0.637
11
Uttar Pradesh
0.634
12
Punjab
0.633
13
Uttarakhand
0.577
14
Tamil Nadu
0.560
15
Haryana
0.497
16
Jammu and Kashmir
0.483
17
West Bengal
0.403
18
Odisha
0.397
19
Maharashtra
0.367
20
Madhya Pradesh
0.223
21
Chhattisgarh
0.118
22
Andhra Pradesh
0.000
23
Telengana
0.000
Appendix 5: Number of Households Having Access to Water for Toilets (2016-17)
Rank
States
Scores
1
Kerala
1.000
2
Himachal Pradesh
0.994
3
Goa
0.955
4
Haryana
0.923
5
Uttarakhand
0.887
6
Punjab
0.740
7
Assam
0.614
8
Telengana
0.604
9
Gujarat
0.561
10
West Bengal
0.529
11
Jammu and Kashmir
0.505
12
Delhi
0.473
13
Maharashtra
0.378
14
Andhra Pradesh
0.361
15
Rajasthan
0.313
16
Tamil Nadu
0.302
17
Madhya Pradesh
0.233
18
Odisha
0.146
19
Karnataka
0.118
20
Bihar
0.082
21
Jharkhand
0.040
22
Uttar Pradesh
0.023
23
Chhattisgarh
0.000
Appendix 6: Wards Having Access to Liquid Waste Disposal for Community and Public Toilets (2016-17)
Rank
States
Scores
1
Delhi
1.000
2
Gujarat
0.728
3
Tamil Nadu
0.706
4
Maharashtra
0.663
5
Uttarakhand
0.663
6
Telengana
0.588
7
Goa
0.522
8
Jammu and Kashmir
0.491
9
Himachal Pradesh
0.467
10
Chhattisgarh
0.416
11
Karnataka
0.382
12
West Bengal
0.373
13
Haryana
0.303
14
Madhya Pradesh
0.298
15
Rajasthan
0.264
16
Uttar Pradesh
0.241
17
Jharkhand
0.224
18
Assam
0.185
19
Odisha
0.179
20
Andhra Pradesh
0.107
21
Bihar
0.101
22
Punjab
0.058
23
Kerala
0.000
Appendix 7: Solid Waste Disposal – Total Waste Processed (2016-17)
Rank
States
Scores
1
Delhi
1.000
2
Goa
1.000
3
Kerala
0.962
4
Telengana
0.942
5
Karnataka
0.654
6
Gujarat
0.538
7
Haryana
0.481
8
Himachal Pradesh
0.385
9
Rajasthan
0.308
10
Tamil Nadu
0.308
11
Madhya Pradesh
0.269
12
Uttar Pradesh
0.250
13
Assam
0.192
14
Maharashtra
0.192
15
Punjab
0.192
16
Andhra Pradesh
0.154
17
West Bengal
0.115
18
Jammu and Kashmir
0.038
19
Odisha
0.038
20
Uttarakhand
0.019
21
Bihar
0.000
22
Chhattisgarh
0.000
23
Jharkhand
0.000
Endnotes
[1]Nilanjan Ghosh, Soumya Bhowmick and Roshan Saha, “SDG Index and Ease of Doing Business in India: A Sub-National Study”, Observer Research Foundation Occasional Paper, no. 199(June 2019).
[2]“SDG 6: Clean Water and Sanitation”, United Nations in India.
[3]“The Human Right to Water and Sanitation“, UN-Water Decade Programme on Advocacy and Communication and Water Supply and Sanitation Collaborative Council.
[4]The State of Asia-Pacific’s Children 2008: Child Survival(UNICEF, 2002), 3-4
[5]J. Sachs et. al., “SDG Index and Dashboard Report 2019” (New York: Bertelsmann Stiftung and Sustainable Development Solutions Network, 2019).
[6] “Sustainable Development Goal 6”, Sustainable Development Goals Knowledge Platform.
[7]K. L. Rao,India’s Water Wealth(New Delhi: Orient Longman, 1975).
[8]P.H. Gleick, “The Changing Water Paradigm: A Look at Twenty-first Century Water Resources Development,”Water International,25 (1), 2000, 127-38.
[9]P. H. Gleick,The World’s Water 1998-1999: The Biennial Report on Freshwater Resources(Washington DC: Island Press, 1998).
[10]J. Bandyopadhyay, “Adoption of a New and Holistic Paradigm is a Pre-condition for Integrated Water Management in India” in G. Saha (Ed.)Water Security and Management of Water Resources(Kolkata: National Atlas and Thematic Mapping Organization, 2004).
[11]Supranote 8.
[12]P. H. Gleick, “Basic Water Requirement for Human Activities: Meeting Basic Needs,”Water International,21 (2), 1996, 83-92.
[13]Supranote 8.
[14]R. Gazmuri, “Chilean Water Policy Experience” paper presented at theNinth Annual Irrigation and Drainage Seminar,Agriculture and Water Resources Department (Washington DC: The World Bank, 1992).
[15]Supranote 10.
[16]J. Bandyopadhyay and S. Perveen, “Interlinking of Rivers in India: Assessing the Justifications”Economic and Political Weekly,39 (50), 2004, 5308-16.
[17]Supranote 14.
[18]S. Helming and J. Kuylenstierna, “Water – A Key to Sustainable Development” Issue paper for theInternational Conference on Freshwater, Bonn, 03-07 December, 2001.
[19]“Water and Agriculture”, OECD.
[20]Water for Sustainable Food and Agriculture(Rome: Food and Agriculture Organization of the United Nations, 2017).
[21]Preeti Kapuria and Roshan Saha, “Resource Use Efficiency and Productivity: An Analysis of India’s Food Grain Sector“, Observer Research Foundation Occasional Paper,No. 229 (January 2020).
[22]Nilanjan Ghosh and Jayanta Bandyopadhyay, “A scarcity value based explanation of trans-boundary water
disputes: the case of the Cauvery River Basin in India,”Water Policy, 11, 2009, 141–167
[23]The tragedy of the commons is an economic problem in which every individual has an incentive to consume a resource at the expense of every other individual with no way to exclude anyone from consuming. It results in overconsumption, under investment, and ultimately depletion of the resource.
[24]Eiman Karar,Freshwater Governance for the 21stCentury(Pretoria: Springer Publications, 2017).
[25]“Water”, Delhi Jal Board, Government of NCT of Delhi.
[26]Nilanjan Ghosh, Jayanta Bandopadhyay and Jaya Thakur,Conflict over Cauvery waters: Imperatives for innovative policy options(Observer Research Foundation, 2018).
[27]Nilanjan Ghosh, “From Reductionist to Holistic Paradigm: Combining Ecology, Economics, Engineering, and Social Sciences in a Transdisciplinary Framework for Water Governance,”Ecology, Economy and Society—the INSEE Journal, 1 (2), 2018, 69–72.
[28]Jayanta Bandyopadhyay,Water, Ecosystems and Society: A Confluence of Disciplines(SAGE Publications, 2009).
[29]Nilanjan Ghosh, “Water, Ecosystem Services, and Food Security: Avoiding the Costs of Ignoring the Linkage,” in Rajat Kathuria et. al. (eds.) Low Carbon Pathways for Growth (New Delhi: Springer, 2017): 161 – 176.
[30]M. Falkenmark, “Society’s interaction with the water cycle: A conceptual framework for a more holistic approach,Hydrological Sciences,42, 1997, 451-466.
[31]M. Falkenmark, “Water Management and Ecosystems: Living with Change”,TEC Background Paper 9. (Stockholm: Global Water Partnership, 2003).
[32]Supranote 29.
[33]K.W. Flessa, “Ecosystem services and the value of water in the Colorado River delta and Estuary, USA and Mexico: Guidelines for mitigation and restoration,”International Seminar on Restoration of Damaged Lagoon Environments, Matsue, Japan, 2004, 79-86.
[34]Supranote 10.
[35]Supranote 8.
[36]M. Falkenmark, L. Gottschalk, J. Lundqvist, and P. Wouters, “Towards Integrated Catchment Management: Increasing the Dialogue between Scientists, Policy-makers and Stakeholders”,Water Resources Development,20(3), 2004, 297-309.
[37]Supranote 10.
[38]E.B. Barbier, E.B. and J.R. Thompson, “The value of water: Floodplain versus large-scale irrigation benefits in northern Nigeria”,Ambio,27(6), 1998, 434-40.
[39]Supranote 10.
[40]Supranote 36.
[41]Supranote 10.
[42]D. Molden and Fraiture, “Investing in Water for Food, Ecosystems and Livelihoods,” Discussion draft,Comprehensive Assessment of Water Management in Agriculture,Stockholm, 2004.
[43]M. Acreman,Background study for the World Commission of Dams, reported in World Commission on Dams, 2000.
[44]Supranote 38.
[45]Supranote 31.
[46]Tariq Ahmad Bhat, “An Analysis of Demand and Supply of Water in India,”Journal of Environment and Earth Science4, no. 11, 2014.
[47]Ibid.
[48]B.M. Jha and S.K. Sinha, “Towards Better Management of Ground Water Resources in India,”Water and Energy International, 67, 2009.
[49]Jayanta Bandyopadhyay and Nilanjan Ghosh, “Holistic Engineering and Hydro-Diplomacy in the Ganges-Brahmaputra-Meghna Basin.” Economic and Political Weekly 44(45), 2009, 50-60.
[50]Praveena Sridhar, “Images and facts of the ground water situation in India“, India water portal, November 23, 2009. Accessed at:
[51]“Drinking-water”, World Health Organization.
[52]“Sanitation”, UNICEF.
[53]SK Sarkar, “Water, sanitation and hygiene must be looked at holistically“, The Hindu Business Line, March 21, 2019.
[54]Prabhash K. Dutta, “Why India does not have enough water to drink“, India Today, June 28, 2019.
[55]“National annual rural sanitation survey (NARSS) 2018-19”, India Environment Portal.
[56]“Drinking-water”, World Health Organization.
[57]“Inadequate sanitation costs India the equivalent of 6.4 per cent of GDP”, The World Bank, December 20, 2010.
[58]“Swachh Bharat Mission”, Ministry of Jal Shakti, Government of India.
[59]Dinesh Raj Bandela, “Union Budget 2020-21: Constant decline in Swachh Bharat Mission allocation“, Down To Earth, February 4, 2020.
[60]“Improving Urban Water Supply & Sanitation Services“, Ministry of Urban Development, Government of India.
[61]Ajishnu Roy and Koushik Pramanick, “Analysing progress of sustainable development goal 6 in India: Past, present, and future,”Journal of Environmental Management, 232, 2018, 1049-1065.
[62]Boschi-Pinto et. al., “Estimating child mortality due to diarrhoea in developing countries,”Bulletin of the World Health Organisation, 86(9), 2008.
[63]J. Bartram and S, Cairncross, “Hygiene, Sanitation, and Water: Forgotten Foundations of Health,”PLoS Med,7(11), 2010.
[64]Schmidt et. al., “Recent diarrhoeal illness and risk of lower respiratory infections in children under the age of 5 years,”International Journal of Epidemiology, 38(3), 2009, 766-72.
[65]Anjali Acharya and Mikko Paunio, “Environmental health and child survival: epidemiology, economics, experiences,“Environment and Development, The World Bank, Washington DC, 2008.
[66]PTI, “Govt forms ‘Jal Shakti’ Ministry by merging Water Resources and Drinking Water Ministries,”Business Standard, May 31, 2019.
[67]Roopal Suhag, “Status of Drinking Water and Sanitation in rural India“, PRS Legislative Research, April 2, 2018.
[68]“NamamiGange,”Ministry of Jal Shakti. Accessed at: mowr.gov.in/schemes-projects-programmes/schemes/namami-gange
[69]Ibid.
[70]Supranote 67.
[71]“Jal Jeevan Mission”, The Hindu.
[72]“PM Modi to release operational guidelines for Jal Jeevan Mission”, The Economic Times, December 24, 2019.
[73]“Budget 2020: Full text of Nirmala Sitharaman’s budget speech“, livemint, February 1, 2020.
[74]Val Curtis,Women and the Transport of Water(London: Intermediate Technology Publications, 1986).
[75]Amartya Sen, “Poor, Relatively Speaking,”Oxford Economic Papers,35 (2), 1983, 153-169.
[76]Caroline Sullivan, “Calculating a Water Poverty Index,”World Development,30(7), 2002, 1195-1210.
[77]Richard H. Thaler and Cass R. Sunstein,Nudge: Improving decisions about health, wealth, and happiness(New York, Penguin Books, 2009).
[78]Government of India,Composite Water Management Index(New Delhi: NITI Aayog, 2019).
[79]KAS Mani, “NITI Aayog’s water management index not really useful, needs major changes“, Business Standard, June 27, 2018. Accessed at:
[80]Ibid.
[81]Mahreen Mato, “India’s water crisis: The clock is ticking“, Down to Earth,June 21, 2019.
[82]Supranote 79.
[83]“Sustainable Development Goals – National Indicator Framework,”Social Statistics Division, Central Statistics Office, Ministry of Statistics and Programme Implementation, Government of India,2016, 11 – 14.
[84]Originally expressed as Composite Water Index Scores, the values have been normalized to range from 0 to 1. The missing value of Delhi is substituted by the average values of its neighbouring states that are Haryana and Uttar Pradesh. The missing value of West Bengal is substituted by the average of its neighbouring states – Odisha, Jharkhand, Bihar, Sikkim and Assam. The missing value of Jammu and Kashmir is substituted by the average values of its neighbouring states that are Himachal Pradesh and Punjab.
[85]The Composite Water Management Index (CWMI) uses data collected at central and state level from 2016 – 2018. Their findings show that the water scarce states (Gujarat performs best) perform much better in terms of the CWMI than the relatively water abundant states (Meghalaya performs worst).
[86]In order to capture the total water availability in a state we have used the total area under water bodies as a measure. These figures were originally in hectares which have been converted into sq. metres and then the per capita values have been calculated (as per Census 2011) to remove scale biases. This data set has then been normalised to range from 0 to 1.
[87]Individual data for Ground Water Availability and Ground Water Withdrawal have been obtained from the mentioned sources. Water withdrawal as a percentage of water availability for each state has been calculated from the given data sets. These figures have then been normalised to range from 0 to 1. Andhra Pradesh values have been used as a proxy for Telengana. The normalised values have been subtracted from 1 to convert into its complement to make the score positive.
[88]Originally expressed figures are in percentage of total urban population. The values have been normalized to range from 0 to 1. The value for Andhra Pradesh has been used for Telengana. The normalised values have been subtracted from 1 to convert into its complement to make the score positive.
[89]Original figures were expressed in percentage. These values have been normalised to range from 0 to 1.
[90]Original figures were expressed in percentage. Missing value for Delhi has been replaced by the average of Uttar Pradesh and Haryana while missing value of Goa has been replaced the average of Karnataka and Maharashtra. These values have then been normalised to range from 0 to 1.
[91]Original figures are expressed as percentage of waste processed. We have normalised this data to range from 0 to 1.
[92]The data collected across 23 Indian states, owing to either the population size or geographical area in most cases, has inherent scale biases. The variables have been converted into per unit format (to remove the relevant scale bias). Further, all the data points have been normalized by the following formula to range from 0 to 1 (unit free). Now, for the negative indicators, the complement of 1 for their respective normalized values has been taken, so as to convert them into a positive indicator. This has been done so as form a uniform, unit and direction free, composite SDG 6 index/score.
Where,denotes the value of the component indicatorkof SDG 6for statej;denotes normalised value of the component indicatorkof SDG 6for statej;denotes the minimum value of the row vector ofykjvalues across the states; denotes the maximum value of the row vector ofykjvalues across the states. With ‘k’denoting an indicator, it is defined by the closed set k = [1, 7] and‘j’denoting a state, it is defined by the closed set j = [1, 23]
[93]Principal Component Analysis is conducted on 7 component indicators. However, some of these component indicators are constructed using more than one indicator. All computations are performed on Stata 12.0.
[94]Calculation of weights for each indicator under SDG 6, for each of the 7 observations has been conducted by Principal Component Analysis (PCA) to rank the states. This methodology has been chosen over a simple average technique to understand the dominant patterns in the dataset, in terms of weights that should be assigned to each parameter. Now let us define the weight attached, by PCA, to an indicator ‘m’ in SDG 6 aswm wherewm= [max{component1, comp2,……, compm}]2* explanatory power[94] of [max{comp1, comp2,…,comp m}]. Each of the weights has been scaled up to sum up to 1 (100%), in order to avoid under representation.
[95]Government of India,SDG India Index Baseline Report 2018(NITI Aayog, 2018).
[96]“India Water Tool”, World Resources Institute.
[97]Estimation is based on district-wise/region-wise water availability in India.
[98]Bhaskar Tripathi, “With plenty of rainfall, why India is on world’s most water-stressed list”, Business Standard, August 7, 2019.
[99]Supranote 36.
[100]Supranote 49.
[101]Nilanjan Ghosh,Economics of Hostile Hydropolitics Over Transboundary Waters(Saarbrucken: VDM Verlag Publishing, 2009).
[102]Naho Mirumachi,Transboundary Water Politics in the Developing World(Oxon: Routledge, 2015).
[103]Eiman Karar,Freshwater Governance for the 21stCentury(Pretoria: Springer Publications, 2017).
[104]Supranote 36.
[105]Amitabh Kant, “Why cooperative and competitive federalism is the secret to India’s success“, World Economic Forum, October 4, 2019.
[106]Better Business, Better World(London: Business and Sustainable Development Commission, 2017).
The views expressed above belong to the author(s). ORF research and analyses now available on Telegram! Click here to access our curated content — blogs, longforms and interviews.
Soumya Bhowmick is a Fellow and Lead, World Economies and Sustainability at the Centre for New Economic Diplomacy (CNED) at Observer Research Foundation (ORF). He ...
Dr Nilanjan Ghosh is Vice President – Development Studies at the Observer Research Foundation (ORF) in India, and is also in charge of the Foundation’s ...
Roshan Saha was a Junior Fellow at Observer Research Foundation Kolkata under the Economy and Growth programme. His primary interest is in international and development ...

 PDF Download