-
CENTRES
Progammes & Centres
Location
 PDF Download
Tanmay Devi, Vanshika Surana and Rhea Shah, “The PIE Index 2020-21: Measuring the Health of Primary and Secondary Education Systems in India,” ORF Occasional Paper No. 359, July 2022, Observer Research Foundation.
Image Source: The PIE Index 2020-21: Measuring the Health of Primary and Secondary Education Systems in India
Education is perhaps the most significant variable of economic growth for its role in moulding the quality of a country’s labour force. Education contributes to the development of human capital, the opportunity for decent wages,[1] and higher levels of productivity. These, in turn, are related to the country’s growth as measured in gross domestic product (GDP).[2] There is also evidence that higher levels of education result in better health for individuals,[3] and for societies, reduced crime.[4] Therefore, improving enrolment rates and the overall quality of education is an imperative, especially for developing economies like India.
Although education in India is compulsory in the primary and middle levels, only 80 percent of children aged 6-14 attend school.[5] Yet, the disparities are not only in access; among those who do attend school, there are variations in educational content and learning curves, determined by caste, gender, social class, and geographical location. The dropout rate is nearly 1 percent for students in primary school and over 14 percent for secondary schools, as of 2020-21.[6] Children from lower-income households face additional challenges.6 According to the Annual Status of Education Report (ASER) 2019,[7] only 16 percent of children in Class (Grade) I in 26 surveyed rural districts can read text at the specified standard, and nearly 40 percent do not have the basic skill of naming letters. Of these children, only 41 percent are able to recognise two-digit numbers.
An index measuring the health of the education system based on tangible learning outcomes can be a valuable tool for comparing results across states. Since school education is a Concurrent List subject, state-level policies are critical to improving education systems. This study, therefore, aims to present a sub-national analysis.
The results will encapsulate the diversity and complexities of India’s school education environment, providing valuable feedback to states and non-government service providers for data-driven decision-making. These could include better targeting of quality improvement strategies. The index is constructed from the perspectives of both outcomes and processes. It aims to help optimise educational outcomes in terms of Performance, Infrastructure, and Equity, and therefore is called the PIE Index.
A well-known Education Index was created in 1990 by the United Nations Development Programme (UNDP), calculated using normalised values of the expected years of schooling[a] and the mean observed years of schooling. The final index is the geometric mean of the mean and expected years of schooling. It is one of the three sub-indices used in creating the Human Development Index (HDI).[b],[8]
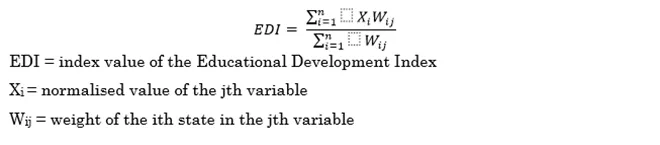
The UN Educational, Scientific and Cultural Organisation (UNESCO) has also developed the Education for All Development Index (EFA Development Index – EDI) using indicators as proxies. The variables for the EDI are: the primary adjusted net enrolment ratios (to measure universal primary education); literacy rates of those above 15 (to measure adult literacy); survival rate till Grade V (to measure quality of education); and the gender parity index. It was used for 115 countries, which were then ranked high, medium, or low.[9] Both these indices look at countries as a whole, and thus, their rankings do not account for country-specific characteristics.
In 2013, welfare economist Antonio Villar[10] developed another Educational Development Index (EDI) using data from the Programme for International Student Assessment (PISA), a worldwide study by the Organisation for Economic Co-operation and Development (OECD). The index has a multidimensional approach to educational achievements, and considers three factors: performance (language and math); equity; and quality. The geometric mean of the normalised values of these variables is the EDI. The distribution of the variables for these three aspects, as well as the final index, are analysed corresponding to the mean of OECD countries. The study showed that the ranks obtained through the EDI did not differ significantly from those provided by considering average PISA scores, but they did uncover differences related to the key features of a country’s educational system. It showed, for instance, that spending on education did not guarantee better educational outcomes.9
In India, under the guidance of NITI Aayog, the Central Square Foundation and Karthik Muralidharan created the School Education Quality Index (SEQI) in 2019 to account for learning, access, infrastructure, equity, and government processes aiding outcomes.[c] The index aims to aid education policy by identifying strengths and weaknesses for policy intervention. States were grouped as ‘large’ or ‘small’, with UTs forming a third category. Within these groups, indicator values were scaled, normalised, and assigned weights to create an overall performance score and ranking. However, the SEQI considered learning outcomes as a whole and any differences between, for example, languages and mathematics were not apparent. However, as shown by Villar (2013), this differentiation is important to understand the strengths and shortcomings of a particular educational system.[11]
More recently, in 2020, Anjali Meena and Anima Vaish of IIS Jaipur, scrutinised the development of education in India using data compiled by the District Information System for Education (DISE)[d] for 2016-17. Their index was built using factor analysis on 22 indicators (access, infrastructure, teachers, outcomes)—a methodology similar to that employed by SEQI, using PCA.
Due to data source limitations, this study was unable to consider the learning outcomes of students. However, it showed that most states had more developed senior secondary education than primary education. It found that states such as Tamil Nadu and Punjab had high EDI scores, compared to others like Bihar and Arunachal Pradesh. The results also reaffirmed the utility of PCA.[12]
Overall, the sub-indices and methodology of the index created by Villar (2013) showed promising results. However, factors such as enrolment and types of schools or the infrastructure within schools, had not been considered. Further, India was not one of the countries in the study. Thus, there was a need for such a study to be conducted in India, and even deeper, for states and UTs in India.
This present index was developed using PCA. It takes into account factors such as learning outcomes, which other education indices did not. This analysis concludes with specific recommendations for policymaking that can help India nurture healthier education systems.
The PIE Index is drawn from three categories: performance (learning outcomes); infrastructure; and equity. These sub-indices were individually computed and the values used to create the index.
Data for this index were taken from the National Achievement Survey (NAS) 2021 by the National Council of Educational Research and Training (NCERT), and the U-DISE Flash Statistics (2020-21) prepared by the National Institute of Educational Planning and Administration (NIEPA). Data from NAS is used to calculate the performance and equity sub-indices, and data from U-DISE for measuring the infrastructure sub-index.
National Achievement Survey
This survey was conducted under the Sarva Shiksha Abhiyan (SSA) to derive insights into the learning achievements of students in the elementary and secondary stages of education in government and government-aided schools. Standardised tests were administered to students of Grades III, V, VIII and X; information about their school environment, socio-economic backgrounds, and teachers’ instructional practices and qualifications, was also collected. The results serve as a baseline against which future progress in education may be evaluated.[13]
U-DISE Flash Statistics
U-DISE[14] is an annual census of recognised and unrecognised schools that reports data on over 4,000 variables. It collects data on school profile, infrastructure, teaching-learning material and equipment, incentives, enrolment, and teachers. The validity and reliability of U-DISE data is ensured through consistency checks by cluster resource centres, block resource centres, and district state management information system (MIS) units, as well as through sample studies of about 5 percent of the schools, generally by a third party. Thus, the U-DISE database is the outcome of collaborative efforts by the NIEPA, state/UT governments, and the union ministry of education.
This paper aims to develop the PIE index to measure the health of primary and secondary education at the state level in India, and to propose a suite of policies for improvement.
Variables in the PIE Index
The variables used to compute the PIE index are the following:
The descriptive statistics are given in Table 1. They will be used to calculate each of the sub-indices, provide summaries of the sample, setting out measures of central tendency (mean) and measures of variability (standard deviation). The range of values has also been provided to offer insights into what the values signify. While these values will not be used directly in computing the actual index, they are useful for providing basic information about variables in a dataset and highlighting potential relationships between variables.
Table 1. Descriptive Statistics
Source: NAS 2021, UDISE+ 2020-21; Created with Data Wrapper.
To account for the differences in the scales of the variables, they have been normalised to ensure a uniform range from 0 to 1.
Sub-indices
a. Performance Index
To evaluate the performance of the school system in a state or UT, using NAS data, scores for performance in English and Math were used. The test had a minimum score of 0 and a maximum of 500 but the actual scores recorded in each grade in each state had a mean of 312 for English and 278 for Math across grades.
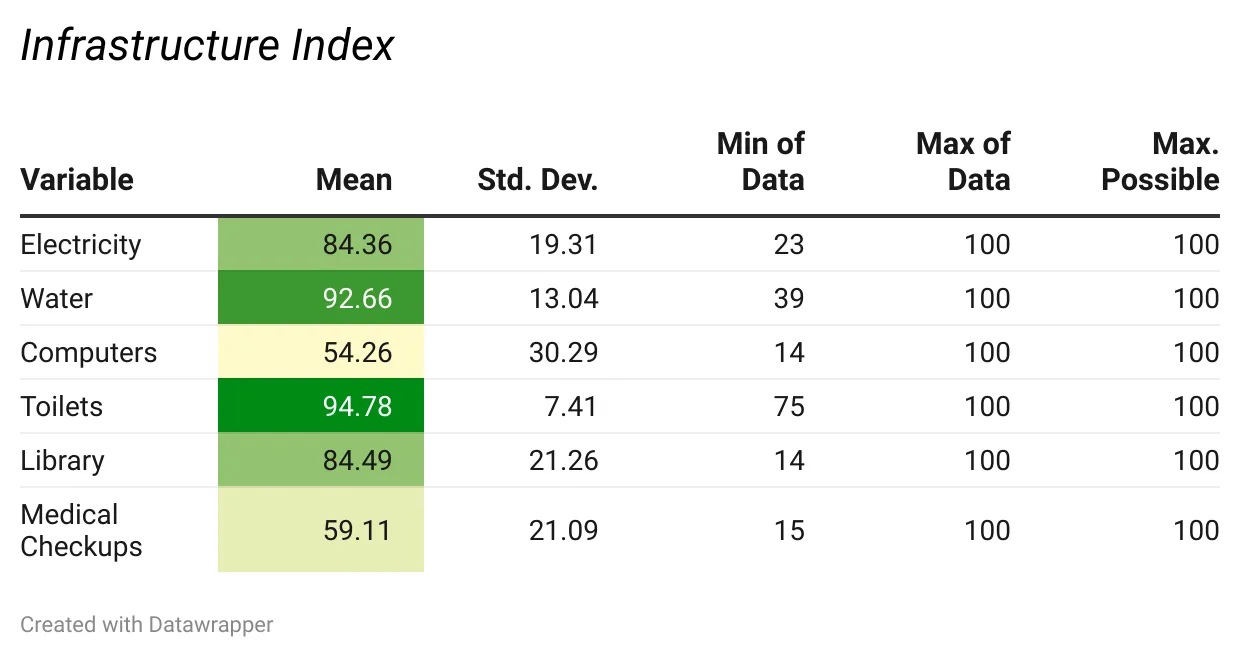
b. Infrastructure Index
To assess the infrastructure of schools in a particular state, variables were taken from the U-DISE database. Each variable recorded the percentage of schools (Grades I – VIII) in a particular state, with a particular aspect of the infrastructure. In most states, around 90 percent of all schools had separate toilets for males and females, drinking water, and functional classrooms. However, only about 85 percent had access to electricity and 50 percent had working computers. Indeed, in some states such as Tripura, only 20 percent of schools had access to electricity, and in Bihar and Meghalaya, the proportion of those with working computers is 15 percent.
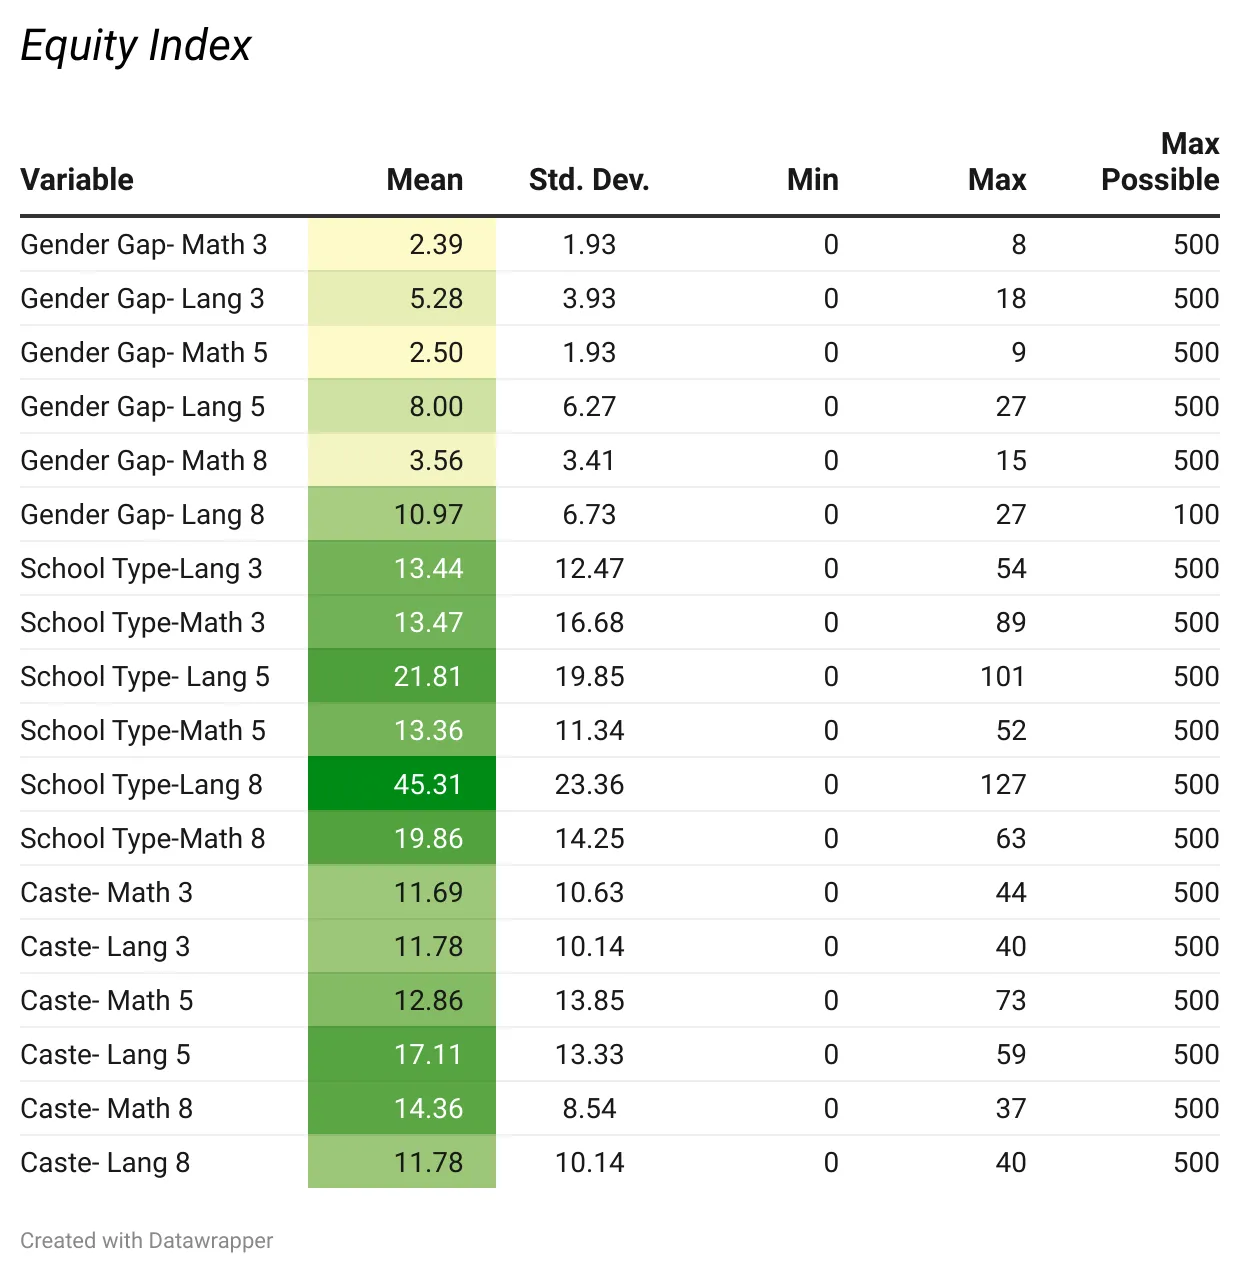
c. Equity Index
To measure equity, the authors considered differences in learning outcomes for typically marginalised communities (on the basis of gender, school type, and caste). This was measured by noting the differences between the language and math scores of students in Grades III, V, and VIII across gender, caste, and type of school. Differences in learning outcomes were considered irrespective of a child’s background or demographic group, with the underlying view that all children should receive quality education (which should be reflected in their academic performance). If differences in background do exist, schools should be able to provide resources to bring all students up to the expected class level.
To identify the performance differences based on gender, the difference in the performance of girls and boys was considered. Similarly, for caste, the authors computed for the difference in performance of Scheduled Caste/Scheduled Tribe students, and general category students. (The SC and ST population was weighted based on projected population proportions in different states derived from U-DISE+ data. For instance, in Sikkim, 5 percent of the population comprise SCs while 35 percent are STs. To account for the difference in group size, weights were assigned accordingly: 0.125 for SC and 0.875 for ST.) Finally, the difference in performance between public and private schools was considered to reflect the differences in learning outcomes of a state-provided free education, and a paid one offered by private schools.
Assumptions
To operationalise the index, the following assumptions have been made:
win > 0 , where w= weight, i= name of the 3 sub-indices, n= position of weight
> 1, where N= number of variables, i= 3 sub-indices,
P, I, E >= 0, where P= Performance Index, I= Infrastructure Index, E= Equity Index
Computing the Sub-Indices
To formulate the final index, the three sub-indices were formulated first. The authors used PCA to identify weights for all variables in each sub-index.
The effort was to figure out if the variables in the input dataset differ from the mean, and to what extent, and to see if there was an association between them. Since variables may be strongly correlated to the point that they produce redundant data, a covariance matrix was computed to find these associations, if any.
The principal components of each sub-index were the new variables generated by combining or mixing the original variables in a linear way. Following the blends, the new variables/principal components were uncorrelated ones, with most of the information from the original variables packed into them. Thus n-dimensional data gives ‘n’ principal components, but PCA places as much information as possible in the first component, and as little as possible in the last.
The process is based on eigenvectors and eigenvalues, since the eigenvectors of the covariance matrix are the directions of the axes with the most variability (information), or the principal components. Eigenvalues are the coefficients attached to eigenvectors that determine how much variation is held in each principal component.
As the first step in PCA, the eigenvalue for each component was calculated. Components with an eigenvalue of 1 and above were then selected for each sub- index. (It is standard practice to discard all components with an eigenvalue of less than one since most of the information is encapsulated through components with an eigenvalue above 1.) Next, the loading value of each variable was computed on the selected components. To get the weights of each of the variables, the absolute value of the loading was multiplied by its respective eigenvalue. The final sub-index value was computed using the weights derived from PCA. This process was applied to each of the three sub-indices to get the three sub-index values for each state/UT.
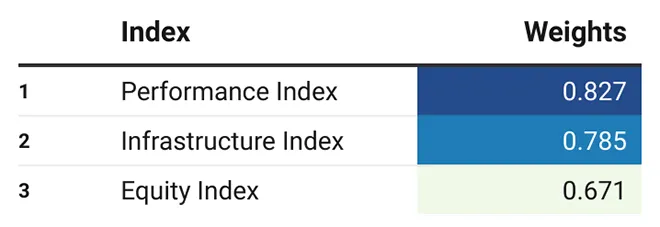
Finally, PCA was applied to the final values of the three sub-indices to obtain the weights for each sub-index:
Table 2: PIE Index Weights
The weights were then used to compute the PIE index by taking a weighted average of the three sub-indices:
Further, to create an index where the value indicates how the state is performing compared with other states, the final values for the PIE index were normalised using
PIE_Normi = Normalized value of PIE index for state i
PIEi = Actual value of PIE index for state i
PIE_min = Minimum value of PIE Index
PIE_max = Maximum value of PIE Index
i = States and UTs in India
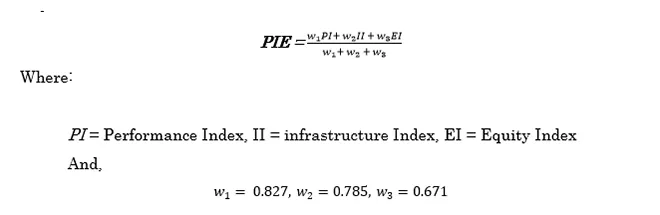
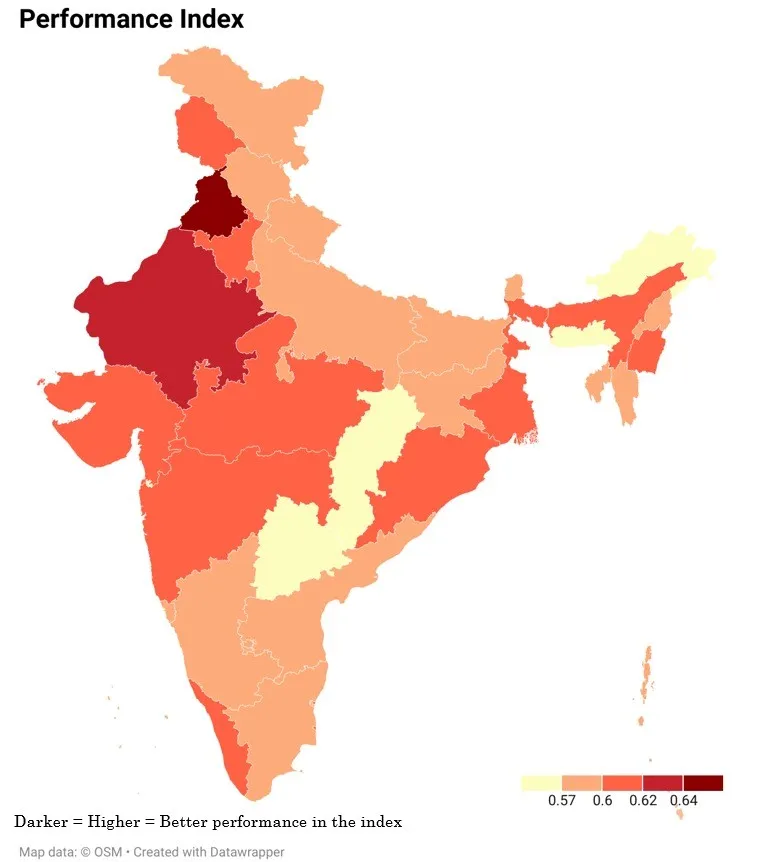
The PIE Index results obtained across all states and UTs in India are represented in the heat map below. As can be seen, there is considerable variation among different regions. A darker colour represents a higher index score, i.e., better performance. A darker patch can be observed in states along the western and southern coast, indicating better performance. The patches are lighter in the east and northeast, indicating poor performance. Punjab is the best performing state, while Meghalaya is ranked the lowest.
Figure 1: PIE Index – Across States
Source: Authors’ own
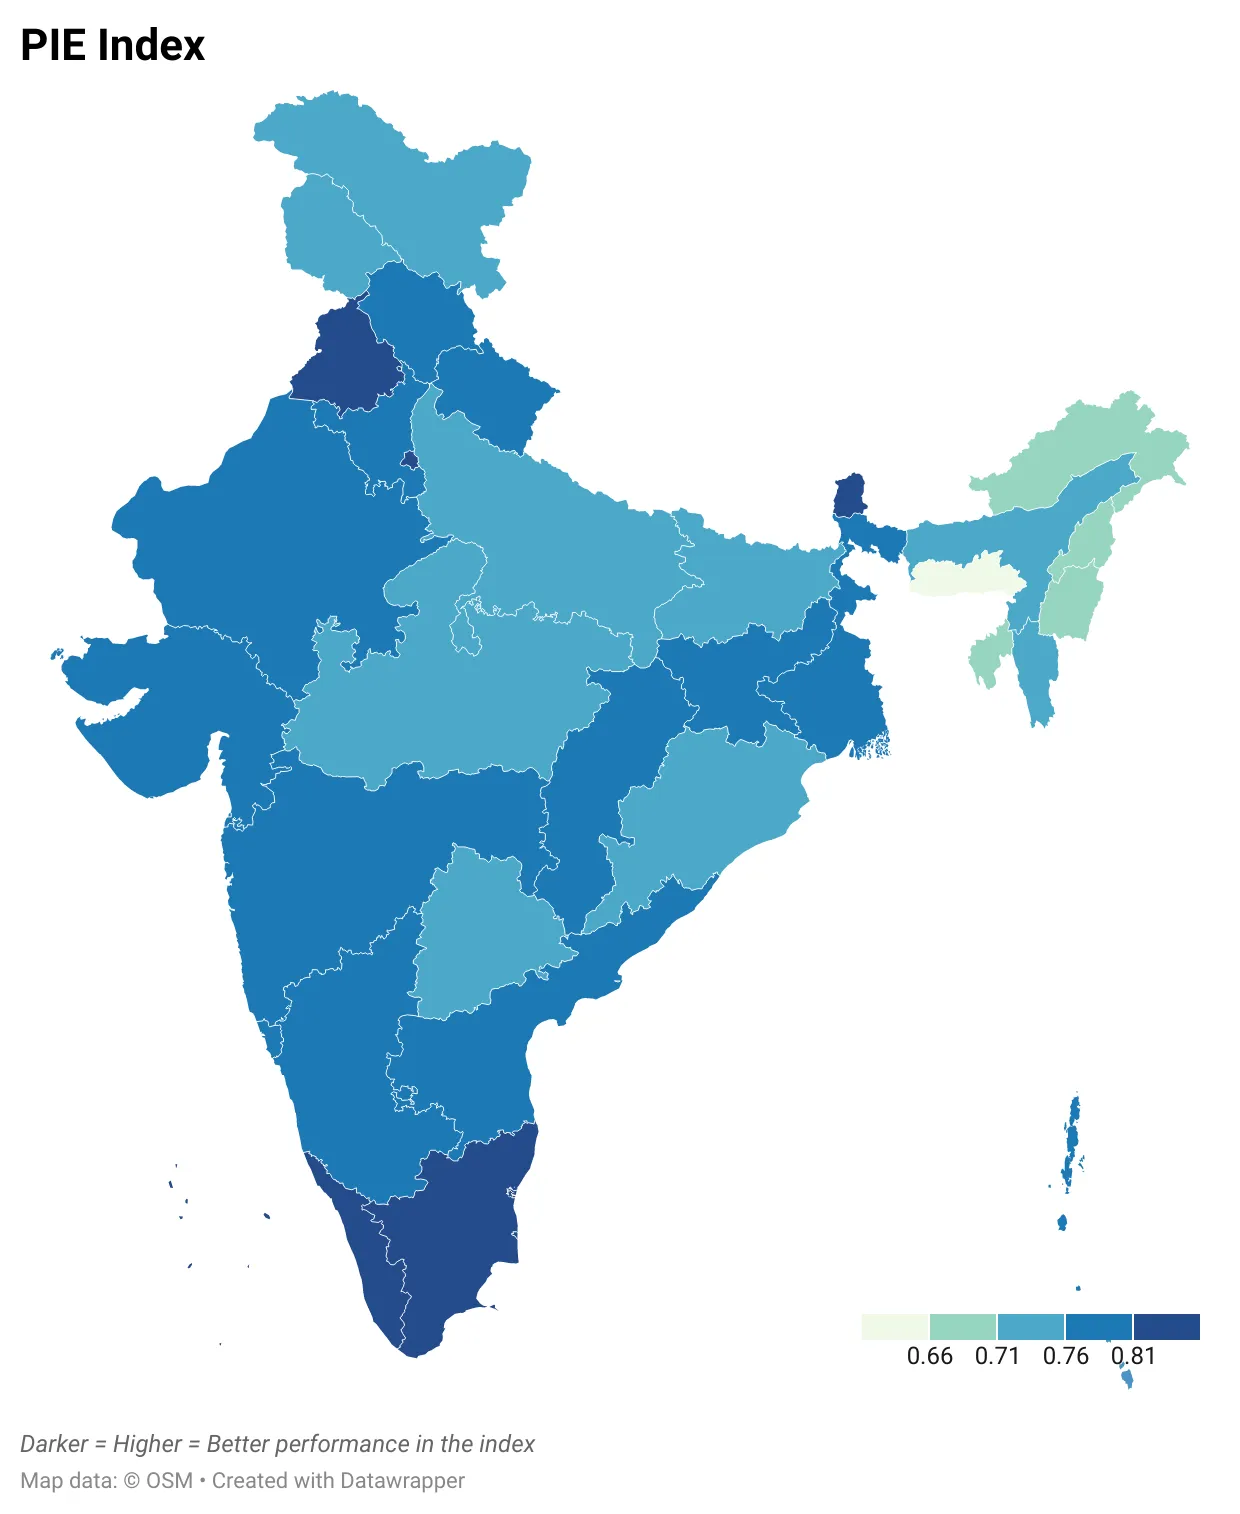
The final PIE Index value for each state, as well as the values of the sub-indices, are given in Table 3. States and UTs have been divided into three categories: large states, small states, and union territories—this allows for like-to-like comparison.
Table 3: Final PIE Index Values
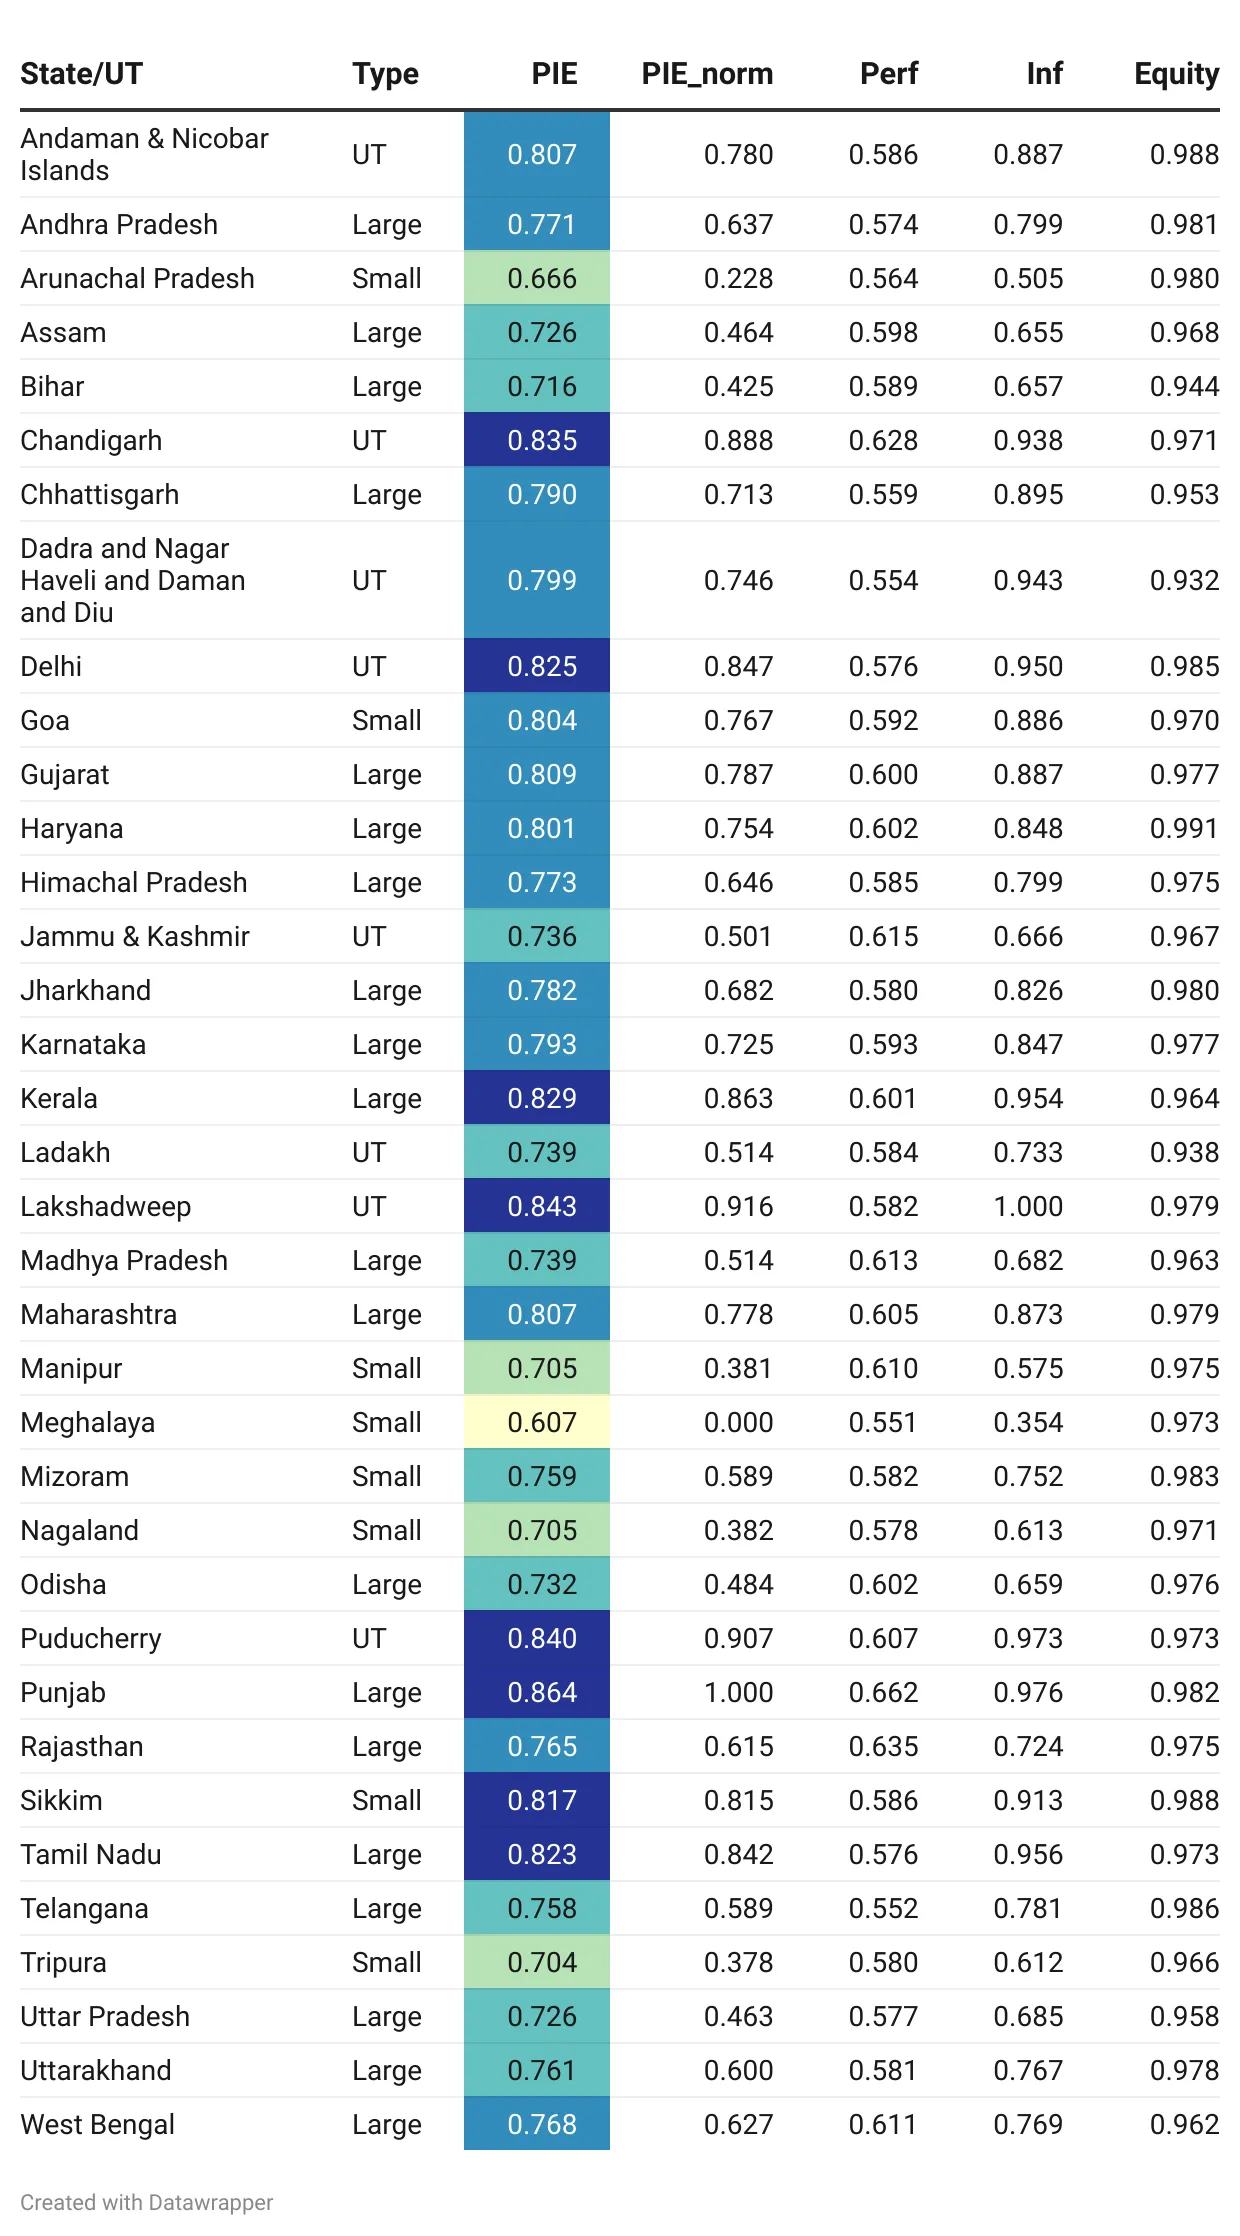
Further, the indicator values in Figure 2 are the normalised PIE values for each state and UT. In general, UTs performed the best and small states are ranked lowest. For 2020-21, it can be observed that the best-ranking large state was Punjab, closely followed by Kerala and Tamil Nadu in that group, while the worst-performing were Uttar Pradesh and Bihar. Among the small states, Sikkim and Goa were top-ranked, while Meghalaya and Arunachal Pradesh were the lowest. Among UTs, Lakshadweep, Puducherry and Chandigarh performed exceedingly well.
Figure 2: PIE Index by State Size
Source: Authors’ own
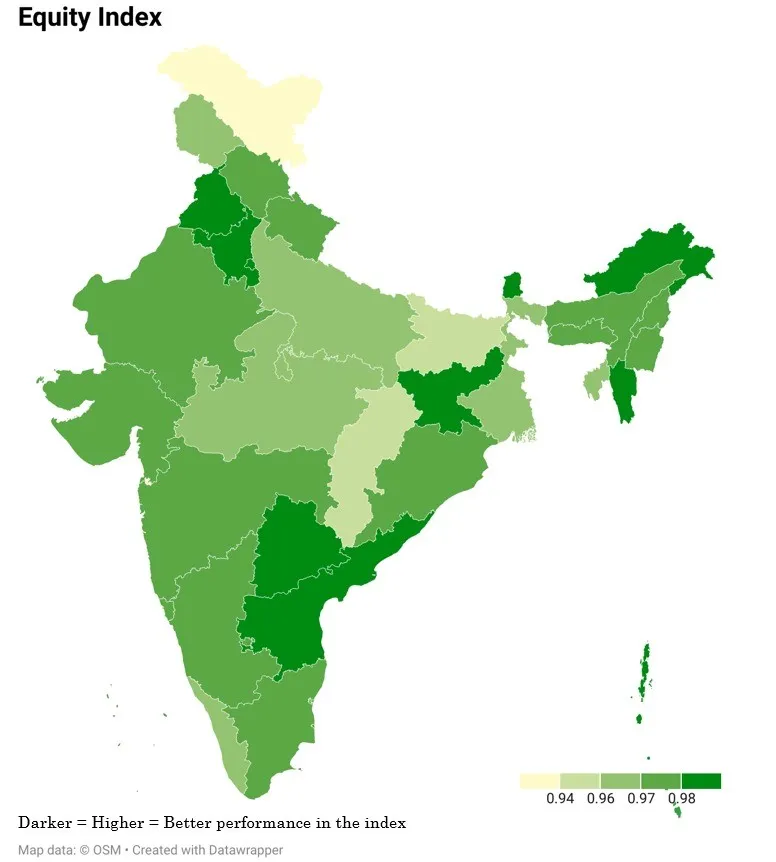
Figure 3 shows the performance of all the states and UTs across each of the three sub-indices. Performance is a function of Learning Outcomes across English and Math. Punjab and Rajasthan emerged as top performing states on the Performance Sub-Index, while Telangana and Meghalaya were at the bottom. Lakshadweep and Punjab ranked highest in the Infrastructure Sub-Index, while Arunachal Pradesh and Meghalaya were lowest. On the Equity Sub-Index, Haryana and Sikkim are at the top, while Ladakh, Dadra & Nagar Haveli and Daman & Diu are lowest.
Figure 3: PIE Sub-Indices – Across States
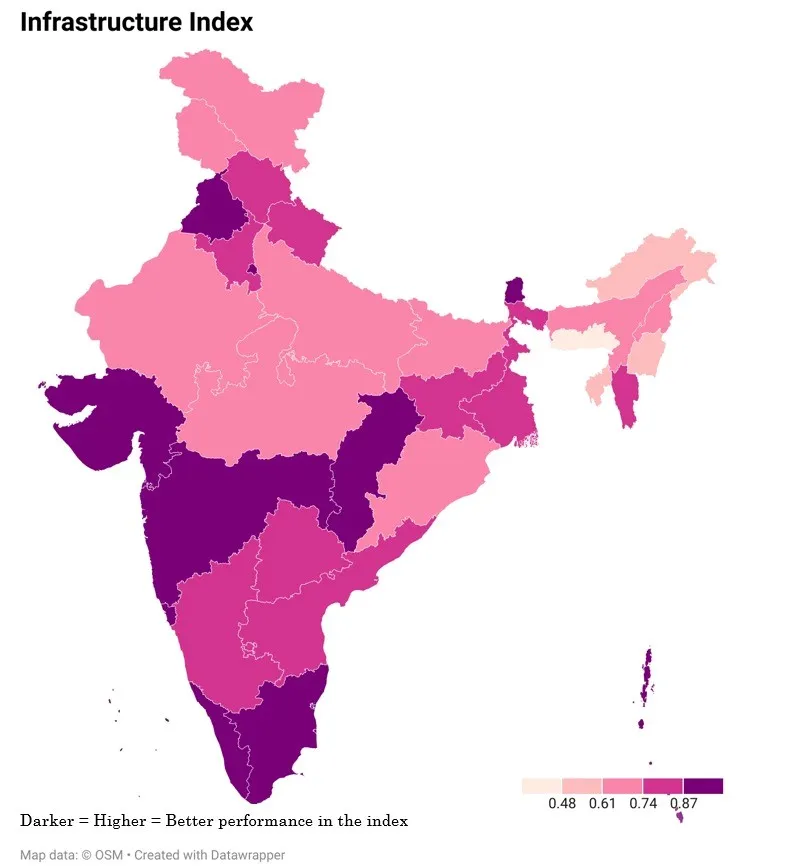
Source: Authors’ own
Punjab emerged as the leading state for primary and secondary education across Learning Outcomes, Infrastructure, and Equity based on caste and gender. Punjab is closely followed by Kerala, the state with the highest literacy level of 93.91 percent (as per the 2011 census). Yet, though it has the highest literacy level, which is a leading variable for the index, Kerala is in second place when all the variables included in the index are considered. This is due to its relatively lower value in Performance and Equity compared to states such as Punjab and Rajasthan. In terms of Infrastructure, among large states, Punjab, Tamil Nadu and Kerala have performed the best. Tamil Nadu’s literacy rate has more than doubled in the last five decades. In contrast, states like Assam, Bihar and Odisha are lagging far behind. The index also shows that Chhattisgarh and Telangana as the worst performing states with regard to Learning Outcomes.
Among smaller states, Sikkim is the best performer, followed by Goa, while Meghalaya in the northeast is at the bottom. It is also the lowest on the infrastructure component of the index. However, Manipur, also in the northeast, has out-performed all other small states with respect to Learning Outcomes (Performance). On the Performance Index in UTs, Chandigarh and Puducherry have out-performed the others. Further, infrastructure across all UTs has been observed to be a defining characteristic in the overall index. States such as Uttar Pradesh, Odisha and Manipur have scored better on the Performance Index than Infrastructure. As noted earlier, eastern and north-eastern states have a poor PIE Index value. Figure 3 demonstrates that although they are doing well on the Performance Index, they lag in Infrastructure.
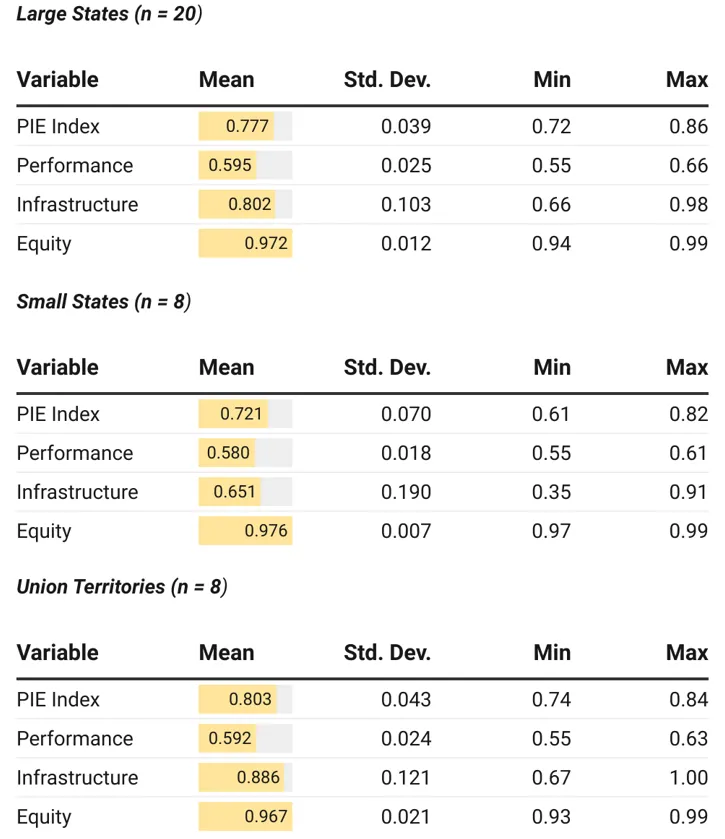
Overall, large states perform significantly better[15] than small states in the PIE Index. However, UTs have out-performed both large and small states, and emerge as the group with a significantly higher index value.[16] On the Performance Index, the mean is the highest in large states and lowest in small states, while variance is the most in UTs. The variation in the Infrastructure Index is extremely high compared to the other sub-indices, implying that certain states fared extremely well on it, while the others fared very poorly. However, UTs seem to be distinctly surpassing the infrastructure of small and large states. Small states have the lowest score on infrastructure with the highest variance. The Equity Index is observed to have the least variance compared to the other two sub-indices, with the lowest shown by the small states.
Table 4: Descriptive Statistics of the PIE Index
While the normalised PIE index values assist in comparisons across states, the absolute values help in deciphering the health of the education system in its entirety. Table 5 shows not only the average PIE index values based on the size of the states, but also the average value of the three sub-indices.
Apart from classifying states on the basis of size or type, this analysis also puts them in quintiles based on the normalised PIE Index values. All states with an index value between 0.8-1 have been categorised as Level 1, while all those below 0.2 were assigned Level 5. States on Level-1 and Level-2 (as shown in Table 5) are the better-performing ones. Those on Level-4 and Level-5 should be concerned about the health of their education systems. They could look at each sub-index and prioritise ways in which they can improve.
Table 5: PIE Index classified in Levels (Quintiles)
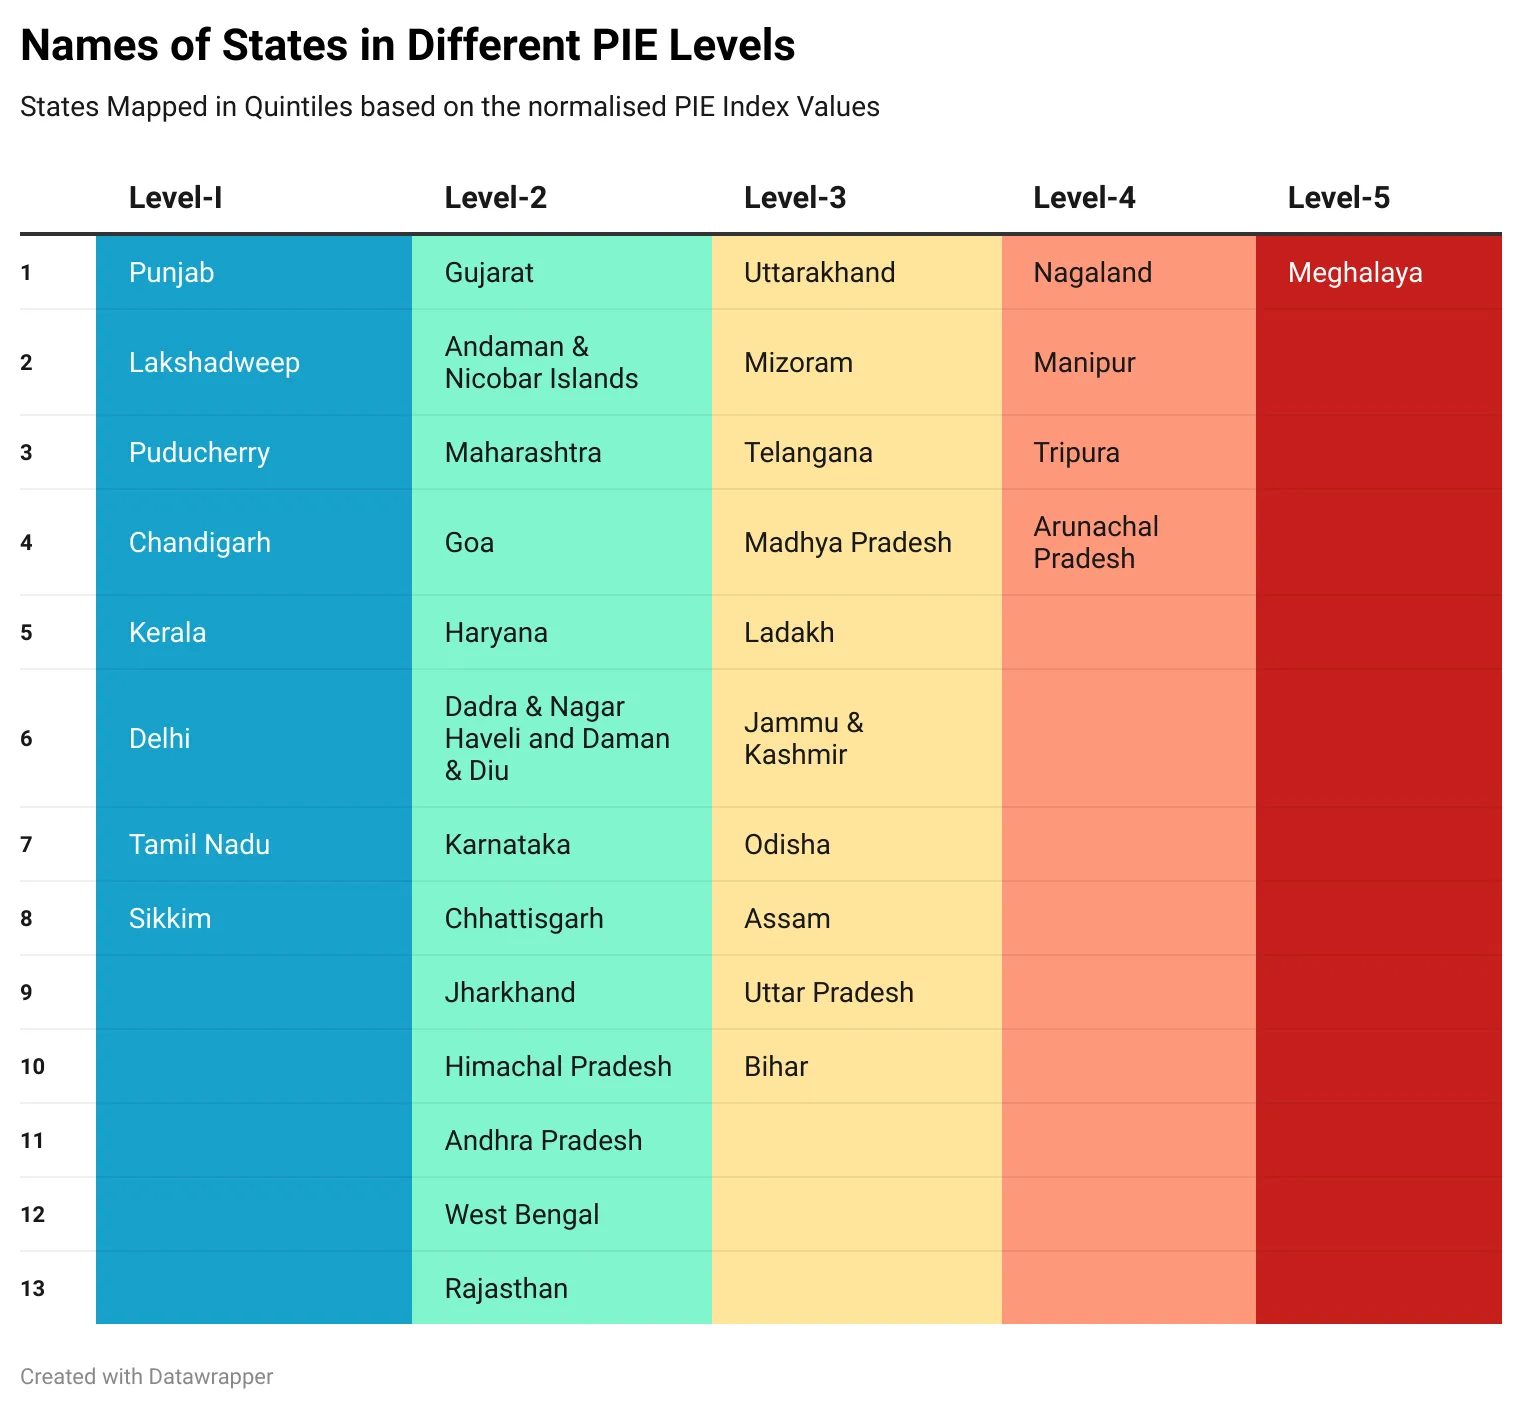
Source: Authors’ own
The results obtained from the PIE Index have been compared with those from the SEQI.[e] The PIE Index has been used to track the changes in the state of Indian education from 2016-17 to 2020-21. It can be seen that from 2016-17 to 2020-21, the rankings are mostly consistent for the large states, but vary for small states and UTs.
Among large states (as can be seen in Table 6) Punjab has shown a huge improvement in rankings, jumping from No. 9 in the SEQI index to first place in the PIE index. This is due to a significant degree of improvement in Learning Outcomes as well as Infrastructure, which in turn can be attributed to its implementation of education reforms. The state restructured its education system by implementing a ‘smart school’ policy, online teacher transfers policy, online education, and distribution of free smartphones through the Punjab Smart Connect initiative. In contrast, Odisha’s ranking has dropped significantly from 2016-17 to 2020-21.
Table 6: Rankings of Large States: SEQI 2016-17 and PIE 2020-21
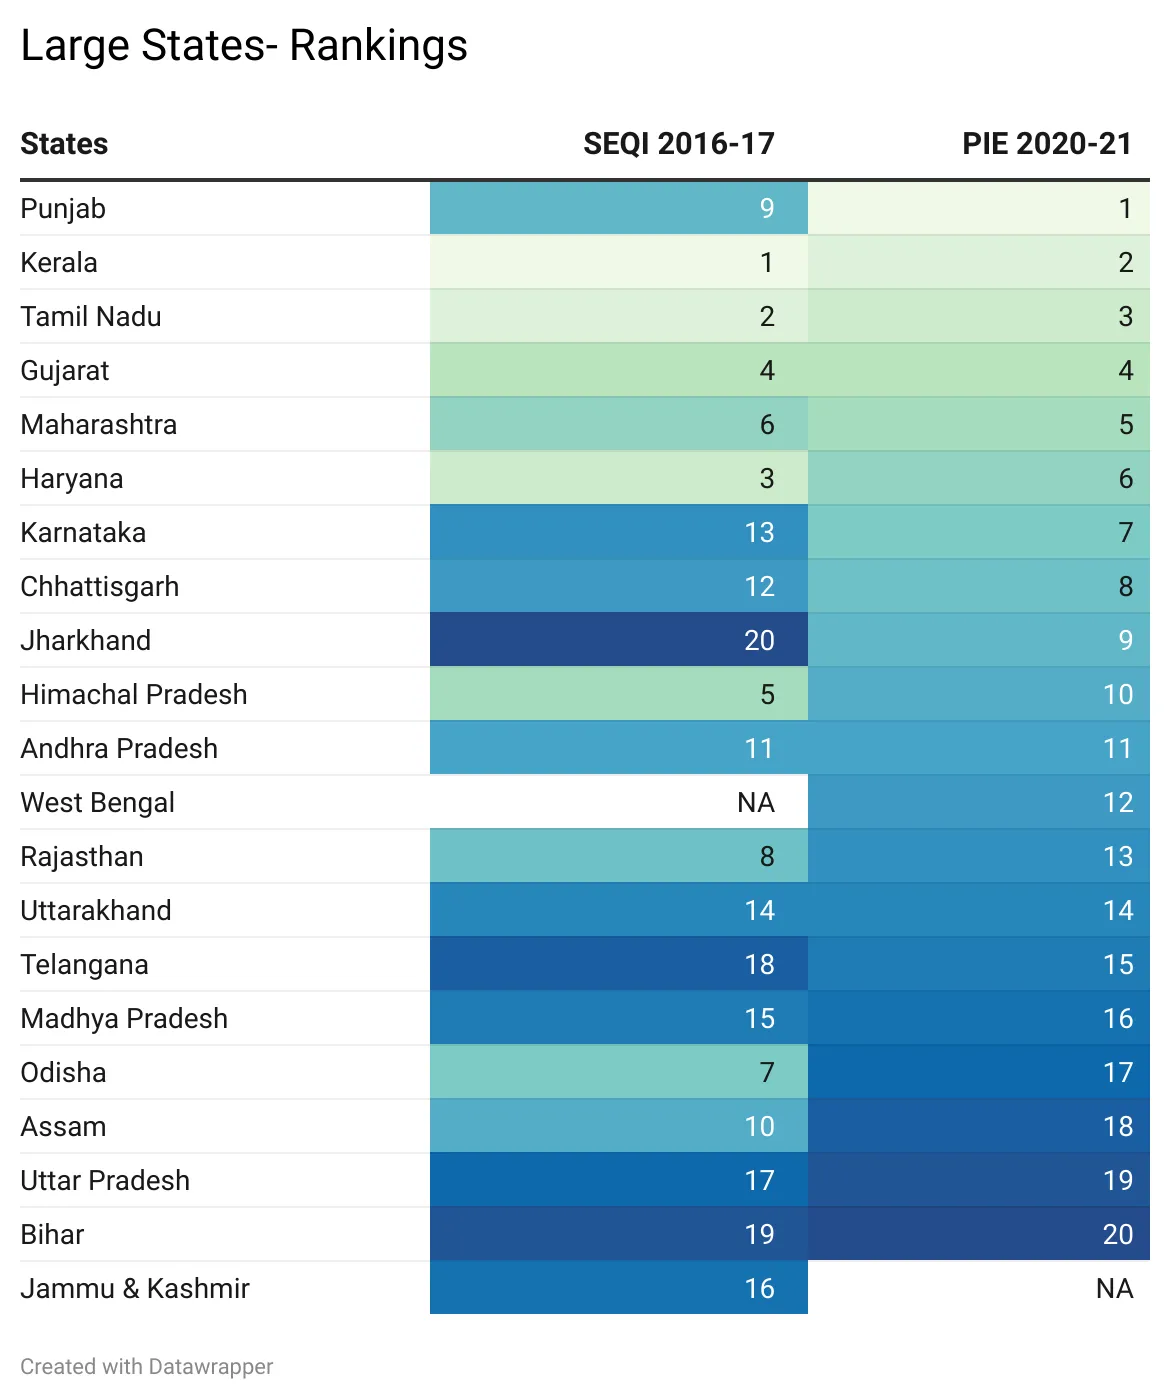
Note: Jammu & Kashmir falls under UTs after 2019.
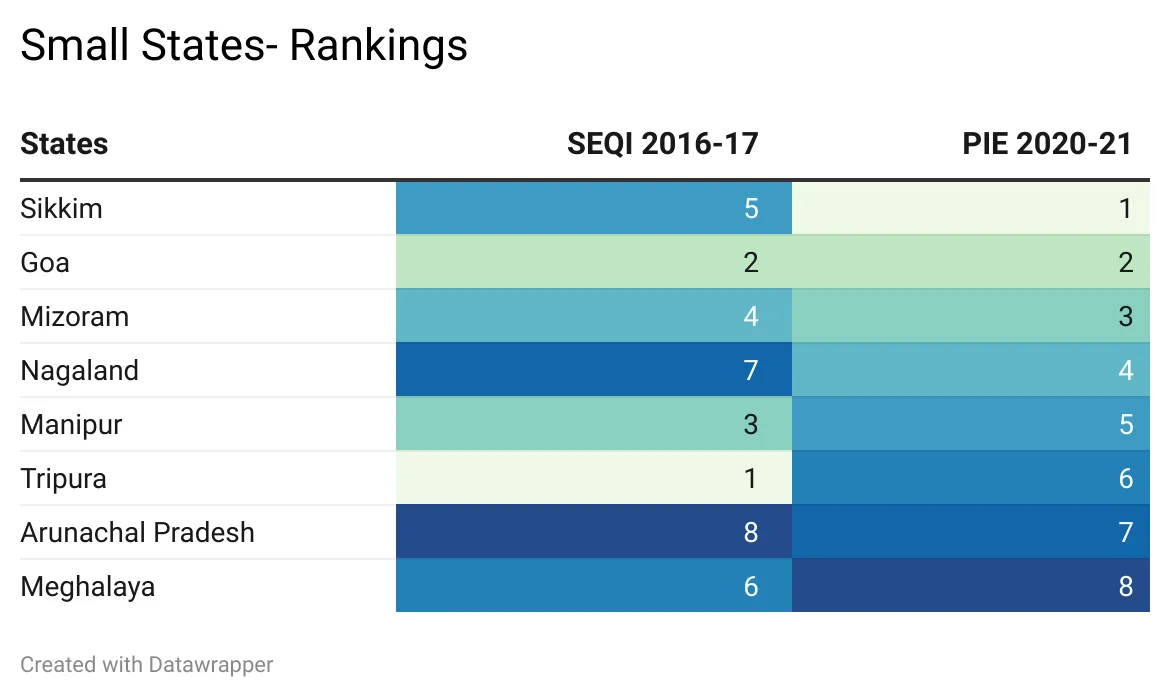
Among small states, there is considerable variation between SEQI 2016-17 and PIE 2020-21. Sikkim has climbed up the rankings with a massive improvement in Infrastructure, and its education system is now comparable to those of states such as Gujarat and Maharashtra.
Table 7: Rankings of Small States: SEQI 2016-17 and PIE 2020-21
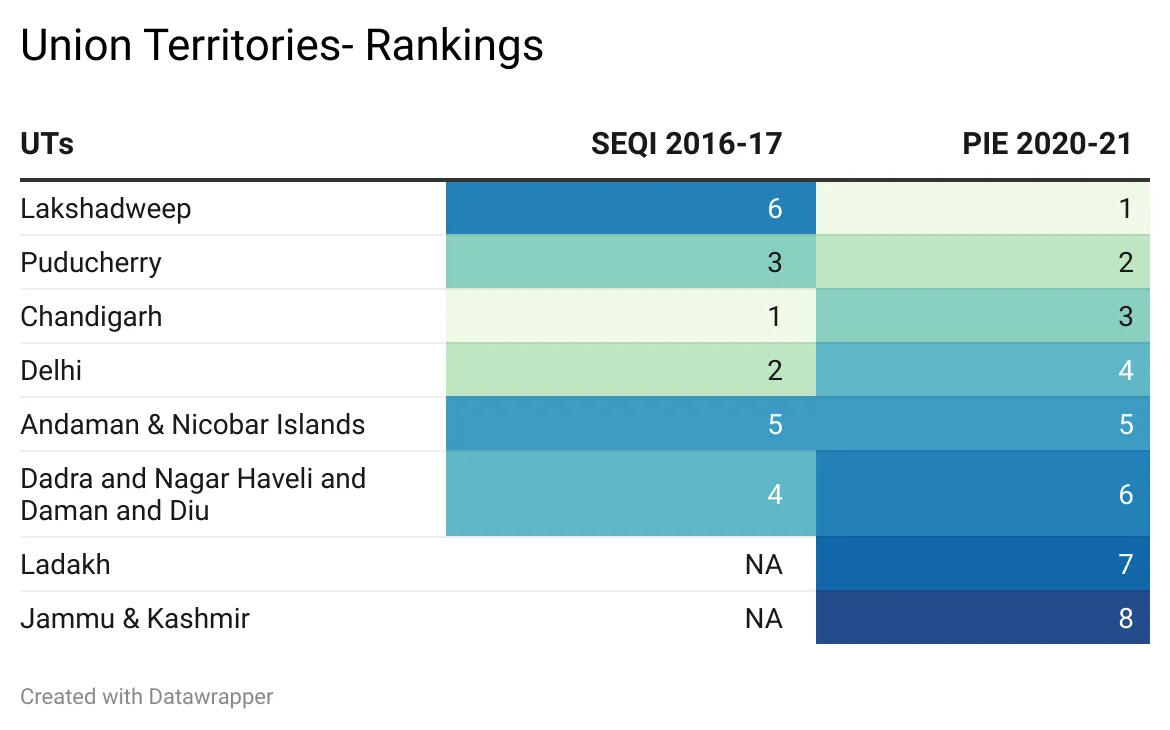
In the PIE Index, UTs are seen as the best performers, better than both small and large states. Lakshadweep has emerged as the top performer, but Puducherry and Chandigarh have surpassed Lakshadweep in terms of Learning Outcomes. Lakshadweep ranks first in Infrastructure among all states and UTs. This could be due to its relatively small number of schools (at around 45)—and therefore a higher likelihood that authorities are able to provide them with computers, electricity, water, toilets, library, and other such facilities. Another point to note is that in the PIE Index, Lakshadweep, Puducherry and Chandigarh are all very close to one another, with values of 0.842, 0.840 and 0.835, respectively.
Table 8: Rankings of Union Territories: SEQI 2016-17 and PIE 2020-21
The PIE Index gives insights into the overall quality of primary and upper primary education (Grades I – VIII). Its disaggregation by state and UT, as well as its three sub-indices, provide further understanding. The results of this exercise should prove useful for policymaking at both the national and state levels. For example, the findings show that the north-eastern states have the lowest index values, especially with respect to infrastructure. Therefore, focused attention and targeted resources need to be allocated to these states. Small states should be given added emphasis as well, since they show the poorest performance among all groups—large states, small states, and UTs. The emergence of Punjab as the best-performing state in the PIE Index 2020-21, could be explained by its active implementation of education reforms. Other states can learn from its experience.
This paper submits that for India to construct a robust education system, learning outcomes, infrastructure, and equity must all be given attention. States and UTs should strive towards bridging the gap between private and government schools, boys’ and girls’ education, and caste-based differences in grades. Finally, it is imperative that education be made accessible to all. From policies such as the Right to Education (RTE) Act to campaigns that encourage education, the government has taken many initiatives, but it should also ensure that no student is discriminated against. Affirmative action is needed to make certain that girl students and other marginalised groups are not left behind.
The National Education Policy (NEP), 2020, is expected to usher in substantial improvements in education, and this will be reflected through the PIE Index once the policy comes into force. The NEP has proposed a curriculum and pedagogy transformation to instil stronger academic abilities, computational reasoning, and logical thinking in students. One of the most significant facets of the NEP is the shift it has proposed from annual exams to a foundational assessment system. It has also suggested holding a low-stakes board test in Grade X, as well as several tests during the year.[17] This could favourably impact learning outcomes across the nation.
Overall learning outcomes will improve further following increased emphasis on professional preparation for teachers. Based on the current trend and NEP recommendations, technology is likely to be used further to optimise learning outcomes, with emphasis on disadvantaged sections. The NEP also seeks to increase access and equity through online courses, which would have a positive effect on equity. Digital infrastructure for enhanced learning is therefore something to look forward to and take into account in the coming years.
The construction of the Index was subject to a few limitations. Data has been obtained from two different datasets, and therefore, a slight difference in the method of data collection can be expected. Although there is considerable variation among primary and secondary schools, two separate PIE indices could not be constructed. This was due to the lack of separate infrastructure-related data for primary and secondary level. Lastly, the PIE index is more outcome-based than process-driven. It does not factor in governance processes aiding outcomes such as attendance, teacher availability, and transparency.
The PIE Index can be reconstructed following the implementation of the NEP. Since one of the objectives of the NEP is to introduce coding and lessons in artificial intelligence, all children will have to be exposed to computers in their early schooling years. It would also be useful to include digital infrastructure as a variable in the Infrastructure sub-index. Moreover, since the NEP also aims at generating holistic progress reports, the Performance sub-index could reflect holistic progress by expanding its vision from only academic abilities to emotional and intellectual abilities as well.
This discusses the detailed methodology of the index.
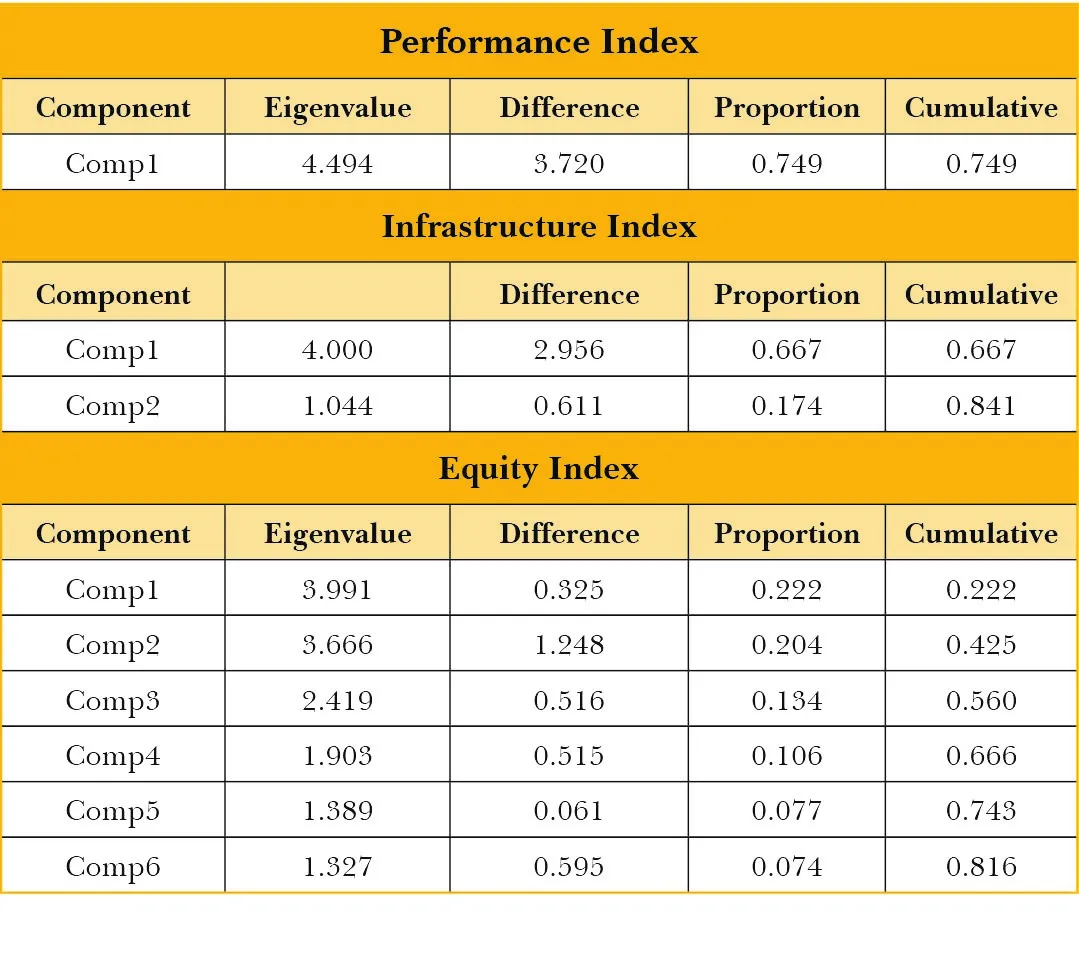
The table below shows the eigenvalues for each of the selected components used in the construction of their respective sub-indices. The ‘Difference’ column calculates the difference between the eigenvalue of the current component and the succeeding one. The ‘Proportion’ column depicts the proportion of total variation explained by each component. The ‘Cumulative’ column represents this proportion in a cumulative manner. The components are always segregated and sorted in descending order of their eigenvalues.
Source: Authors’ own
In the Performance Index, the first component is selected since its eigenvalue is greater than 1. The cumulative value till Component 1 is 0.7491. This implies that 74.91 percent of the variation in the data is being explained by the first two components. Similarly, the first two components in the Infrastructure Index have been selected, which explain 84.06 percent of the variation in the data. Lastly, the first six components in the Equity Index are chosen with 81.64 percent explanation of the variation.
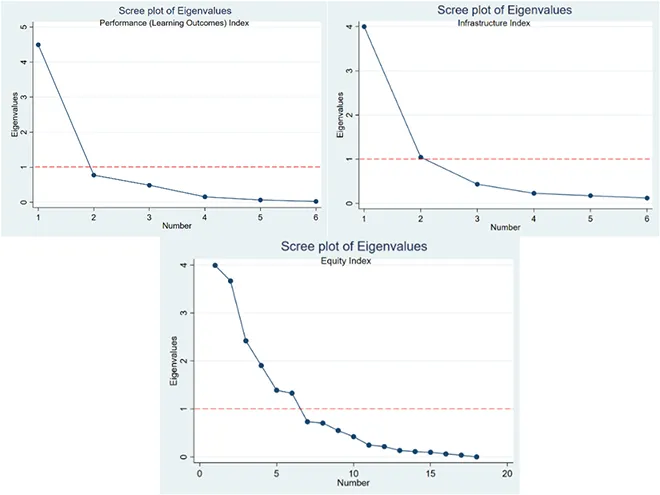
The figure below gives a visual representation of the eigenvalues of all the components.
Source: Authors’ own
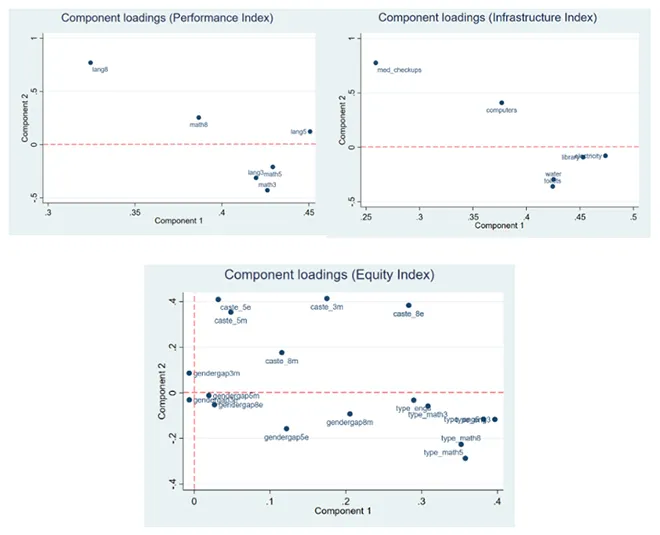
For each of the three sub-indices, the points (representing the components) that lie above the reference line were selected. The loading of each variable on all the selected components was calculated. This represents the correlation of the original variables with the components. The graph below visualizes the loadings of each variable on the first two components.
To ensure that the index is robust, it was subjected to the Kaiser-Meyer-Olkin (KMO) test. The test confirmed that the data was suitable for Principal Component Analysis. The evaluation assesses the sampling adequacy of each sample variable as well as of the whole model. The statistic is a measure of the proportion of variance that is normal among variables[18]. It is standard practice to conclude that a KMO greater than or equal to 0.5 can justify the use of PCA. The results of the KMO test for the PIE index were as follows:
Kaiser-Mever-Olkinof (KMO) Sampling Adequacy
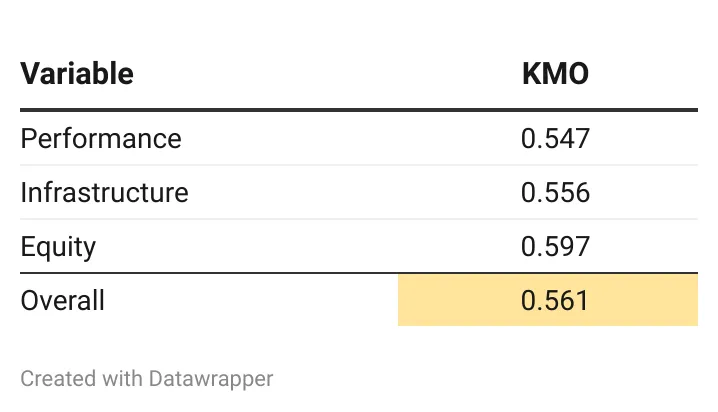
Results for the PIE Index suggest that all the variables have a KMO higher than 0.5. This justifies the use of PCA in the formulation of a robust PIE Index.
As a final step, the eigenvalues and the loading values are used to arrive at the weights for each variable. The eigenvalue of each variable was multiplied by the absolute loading of that variable on the corresponding component. This was then summed over all components for each variable to get the weights.
Mathematically, it can be represented as:
wi = |Lij| Eij
where wi is weight of the ith variable, Ei is the eigenvalue of the jth component, Lij is the loading value of the ith variable on the jth component, i = 1, 2, 3…n variables, j = 1,2,3…k components
Using this formula, the weights for each variable are listed below:
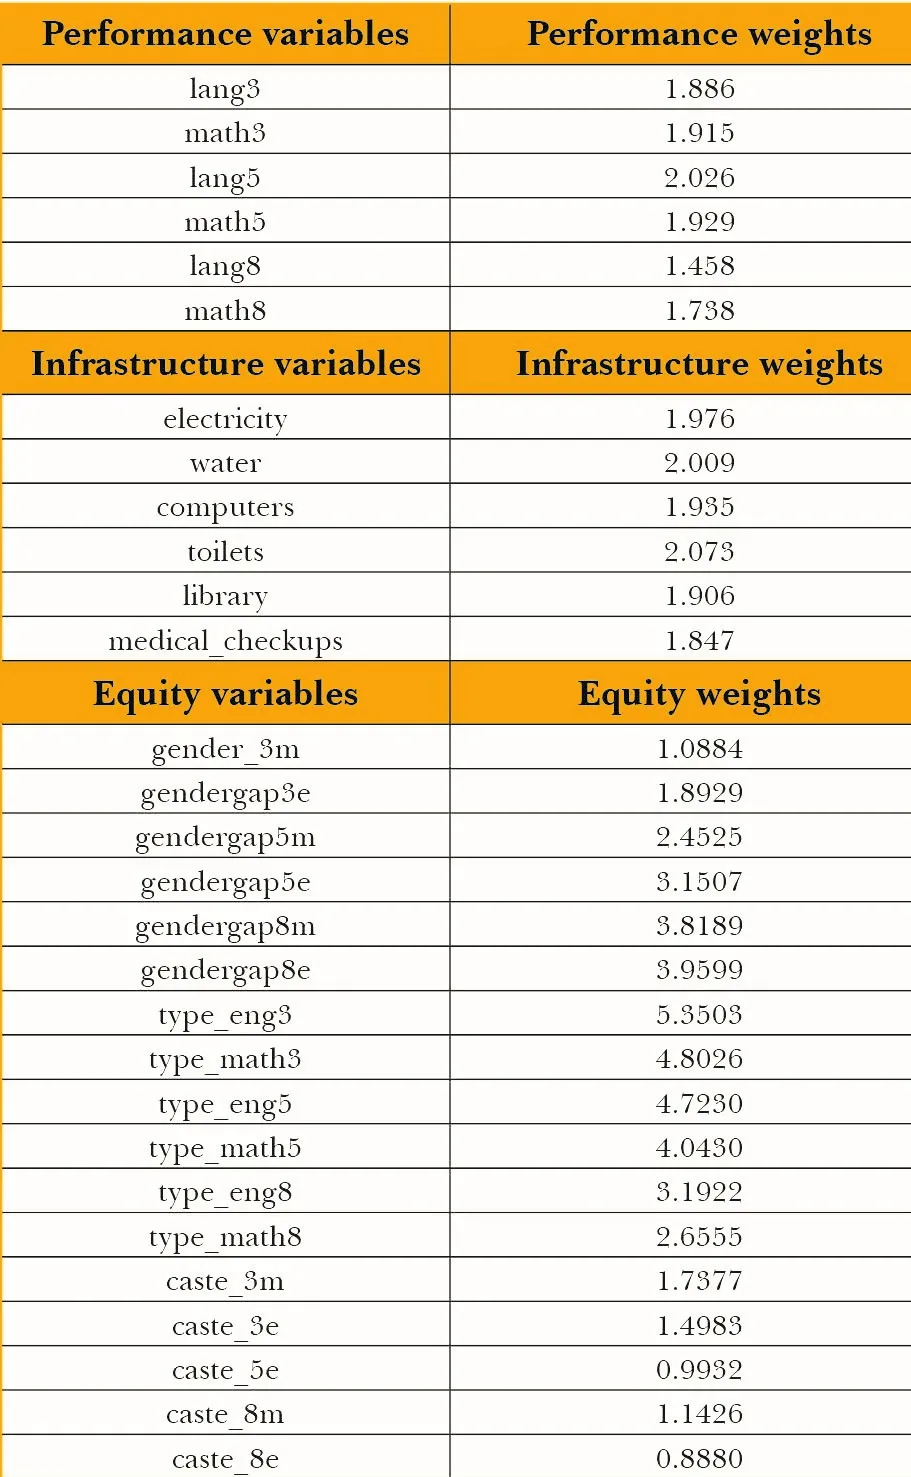
Source: Authors’ own
[a] This is based on the idea that prevailing patterns of age-specific enrolment rates will persist indefinitely.
[b] The other two sub-indices used to measure HDI are life expectancy and gross national income per capita.
[c] These include student and teacher attendance, teacher availability, administrative adequacy, training, and accountability.
[d] UDISE and UDISE+ are improved and updated versions of DISE.
[e] SEQI 2020-21 results have not yet been released; and therefore, SEQI 2016-17, the latest available, was used.
[1] Joshua Angrist and Alan Krueger, “Does Compulsory School Attendance Affect Schooling and Earnings?” The Quarterly Journal of Economics 106, no. 4 (1991): 979–1014.
[2] Eric Hanushek and Ludger Woessmann, “Do better schools lead to more growth? Cognitive skills, economic outcomes, and causation.” Journal of economic growth 17, no. 4 (2012): 267-321.
[3] Adriana Lleras-Muney, “The relationship between education and adult mortality in the United States.” The Review of Economic Studies 72, no. 1 (2005): 189-221.
[4] Lance Lochner and Enrico Moretti, “The effect of education on crime: Evidence from prison inmates, arrests, and self-reports.” American economic review 94, no. 1 (2004): 155-189.
[5] Karthik Muralidharan and Michael Kremer, “Public and private schools in rural India.” Harvard University, Department of Economics, Cambridge, MA 9 (2006): 10-11.
[6] “Flash Statistics on School Education – U-DISE+” (National Institute of Educational Planning and Administration, 2021).
[7] “Annual Status of Education Report (Rural) 2019” (ASER Center, 2020).
[8] Khalid Malik, “Human development report 2013. The rise of the South: Human progress in a diverse world.” UNDP-HDRO Human Development Reports (2013).
[9] “The Education for All Development Index,” Global Education Monitoring Report (UNESCO, 2015).
[10] Antonio Villar, “The Educational Development Index: A Multidimensional Approach to Educational Achievements through PISA.” (2013).
[11] “School Education Quality Index,” NITI Aayog, National Institution for Transforming India, Government of India, 2019.
[12] Anjali Meena and Anima Vaish, “Inter-state Appraisal of School Education Development in India.” Journal of Xi’an University of Architecture Technology, 12 (3), 171-185 (2020).
[13] “National Achievement Survey Class III, V & VIII – NCERT” (National Council of Education Research and Training, 2021).
[14] “Flash Statistics on School Education – U-DISE+” (National Institute of Educational Planning and Administration, 2021).
[15] Using t-test, significant at less than 5% (P-Value: 0.038)
[16] Using t-test, significant at less than 1% (P-Value: 0.000)
[17] “Impact of National Education Policy 2020 and Opportunities for Stakeholders” (KPMG, 2020).
[18] Glen Stephanie, “Kaiser-Meyer-Olkin (KMO) Test for Sampling Adequacy,” Statistics How To, 2021.
The views expressed above belong to the author(s). ORF research and analyses now available on Telegram! Click here to access our curated content — blogs, longforms and interviews.

Vanshika Surana is an Applied Mathematics graduate from FLAME University Pune.
Read More +