-
CENTRES
Progammes & Centres
Location
 PDF Download
Abhijit Mukhopadhyay, “The Central Bank Autonomy Debate and India’s Knife-Edge Credit Crisis”, ORF Occasional Paper No. 190, April 2019, Observer Research Foundation.
Introduction
India’s monetary policymakers should heed the counsel of former Governor of the United States’ Federal Reserve Bank, Ben Bernanke: “Among other objectives, liquidity guidelines must take into account the risks that inadequate liquidity planning by major financial firms pose for the broader financial system, and they must ensure that these firms do not become excessively reliant on liquidity support from the central bank”. India’s credit supply and liquidity are currently in dire straits. Yet, the recent debates on the Reserve Bank of India’s (RBI) autonomy, while serving as fodder for extensive media coverage, only ended up masking the tensions within the government about the curtailing of the liquidity in the country’s credit supply. The showdown, which saw the ouster of Urjit Patel and the subsequent appointment of Shaktikanta Das as RBI Governor, in fact has more to do with credit supply and liquidity than the central bank’s autonomy.
Maintaining the autonomy of a country’s central bank, according to existing literature, ensures the effective operation of inflation-targeting mechanisms. However, in India’s case, if the decreasing inflation rates are any indication, it would appear that the country’s inflation-targeting mechanisms are not under any threat from the lack of autonomy of its central bank. What then is the reason behind the public showdown between the Ministry of Finance and the RBI? Is it about a gradual decrease in the interest rates, which seems to be a fair demand from the government? If it is about a rate cut, could that not have been solved by discussions between the finance ministry and the RBI? Principally, the tussle is about ensuring uninterrupted credit which resulted in the flow of funds into various non-bank financial intermediaries in recent years. Those funds boosted the market valuations of such non-bank entities and finally resulted in a sustained good showing of the stock market indices.
The government can do little to rejuvenate a faltering economy, reeling under the shocks of demonetisation and GST implementation. As a result, various macroeconomic fundamentals (other than the GDP figures, which some analysts have called “suspect”)[i] have refused to show any sign of true revival. Growth rates of GDP have been constantly estimated above seven percent, except for the year 2017-18. GDP growth in 2018-19 in advanced estimates is calculated to be 7.2 percent, compared to 6.7 percent in 2017-18.[ii]
| Table 1: Comparison of UPA-II and NDA-II Governments in Growth Rates of Non-GDP Macroeconomic Parameters (in %) |

** Projection on the basis of data between April-December 2018 # Revised estimate for 2019 ^ India Brand Equity Foundation production forecast for 2018-19 |
| Source: Vivek Kaul, “Manmohan Vs Modi: The real growth story”, Mint, 12 April 2019 Original data sources: CMIE, IBEF, Indian Railways, Ministry of Road and Surface Transport, Budget Documents, PIB, Government of India |
Apart from GDP figures, there are other parameters to measure the economy, and in growth rates of nine such different parameters (out of total 12) the present National Democratic Alliance (NDA-II) government fails to match the performance of the second term of United Progressive Alliance (UPA-II) government (See Table 1). Indeed, it is important to note that in these indicators, UPA-II’s performance is lower than UPA-I’s. In the absence of any real sector revival, the performance of the stock market becomes crucial. Therefore, uninterrupted credit flow acquires an important dimension.
However, is it prudent to ensure credit flow even at the cost of diluting the existing Prompt Corrective Action (PCA) framework[1] of the banking system? Have the banks – which were earlier laden with bad loans – fully recovered? If not, then what can be the repercussions of continuing in the current credit path?
Meanwhile, the IL&FS (Infrastructure Leasing & Financial Services) and DHFL (Dewan Housing Finance Corporation Limited) crises exposed the chinks in the armour of quite a few NBFCs.[2] After the RBI started taking stringent measures to tackle the non-performing assets (NPAs) even in the NBFCs – some of these entities had to make provisions for the bad loans, which restricted their lending capacity. The cost of borrowings for the NBFCs is expected to further rise in the immediate future. All these can threaten already under-risk profit margins of these NBFCs.
The first section of this paper provides a timeline of the recent showdown between the RBI and the finance ministry. The second section outlines a theoretical background on central bank independence and connects the literature with India’s experience. The third section then analyses the composition, flow and risks of bank lending. The penultimate section examines the NBFC lending patterns, and the paper closes with a conclusion.
The RBI-Finance Ministry showdown: A timeline
Although not often mentioned, the shadow of previous RBI Governor Raghuram Rajan looms large in the current debates on central bank autonomy. Rajan’s efforts to regulate the issuance of bad loans and to crack down on wilful defaulters resulted in the establishment of the Prompt Corrective Action (PCA) framework for the scheduled commercial banks (SCBs) – under which, until recently, eleven public sector undertaking (PSU) banks were barred from lending.[iii] As expected, three PSU banks – Bank of India, Bank of Maharashtra and Oriental Bank of Commerce – have been taken out of the PCA framework by the RBI in February 2019 after capital infusion in December.[iv] A few more banks are expected to be taken out of the PCA framework in the near future. Rajan was also instrumental in creating various complementary mechanisms—such as the Asset Quality Review (AQR) and Central Repository of Information on Large Credit (CRILC)—to identify and ring-fence bad and risky loans. It would serve the debates well to note that these mechanisms were finalised after due consultation with the Central Government, rather than falsely assuming that the RBI embarked on the task unilaterally.
The recent showdown between the government and the RBI had built up for some time, with the government persistently criticising the RBI for not ensuring the flow of credit. On the part of the RBI, the central bank disagreed with the decision to merge the Bank of Baroda, Vijaya Bank and Dena Bank. Two additional, recent points of difference widened the fissure. One was the INR 126-billion scam involving the Punjab National Bank (PNB); as the incident unravelled, the central government pointed to the failure of the RBI, as regulator, to prevent the fraudulent transactions.[v] The RBI proposed to withdraw its nominee directors from the boards of the PSU banks, which make credit decisions, to avoid conflict of interest. The Finance Ministry turned down the request.[vi] The second incident is related to the September 2018 ouster of Nachiket Mor, an Indian banker and National Director of the Bill and Melinda Gates Foundation (BMGF), from the central board of the RBI.[vii] The Swadeshi Jagran Manch (SJM), an organisation affiliated with the Rashtriya Swayamsevak Sangh (RSS), had earlier written to the prime minister asking for his removal, alleging conflict of interest. (The RBI also oversees the flow of overseas funds to NGOs such as the BMGF.)[viii] While there is no available official confirmation of the linkage between these two, in August 2018 the government inducted the SJM convenor, S Gurumurthy, as RBI board director.[ix]
The tension reached a flashpoint when the government expressed desire to invoke Section 7 of the RBI Act, 1934,[x] which allows the Central Government to “give directions” to the RBI “in the public interest”. The provision also says, “Subject to any such directions, the general superintendence and direction of the affairs and business of the Bank shall be entrusted to a Central Board of Directors which may exercise all powers and do all acts and things which may be exercised or done by the bank.”[xi] Although the section has not been used since Independence, its sheer mention roiled the central bank establishment, resulting in a public outburst by the RBI Deputy Governor Viral Acharya.[xii] Acharya articulated the need for central bank independence in running the financial markets, and highlighted issues like the regulation of the PSU banks, and transfer of reserves from the RBI balance sheet.[xiii] He also drew parallels between Argentina’s financial crisis and its central bank’s autonomy. In response, the finance minister accused the central bank of “looking the other way” amidst indiscriminate lending by the PSU banks.[xiv] He blamed the RBI when the earlier UPA government “artificially propped up the economy by allowing banks to lend indiscriminately (between 2008 and 2014), resulting in accumulation of stressed assets to INR 10 trillion”.[xv] A day after, in a move to calm down the jittery markets the Union Government issued a press release: “Both the government and the RBI, in their functioning, have to be guided by public interest and the requirements of the Indian economy”.[xvi] At that point, it seemed that both the RBI and the finance ministry buried the hatchet.
In early December 2018, in a sudden turn of events, the sitting RBI Governor Urjit Patel resigned, citing “personal reasons”.[xvii] The government then appointed Shaktikanta Das as the 25th Governor of the RBI.[xviii] (Das oversaw the execution of demonetisation as Secretary of the Department of Economic Affairs, and is a trusted bureaucrat of the present government.) As a result of this appointment, there are expectations that the PCA framework will be relaxed to smoothen the flow of credit into the economy. Going by the recent announcements in the credit policy, those expectations are turning out to be true.
Thus, in what was a fierce public battle between the government and the central bank, the government prevailed. Indeed, with a new RBI governor and the induction of new members in the board, the government has virtually implemented Section 7 of the RBI Act, without constitutionally and legally imposing it. In the end, although the confrontation is widely viewed as revolving around central bank autonomy, the real bone of contention has been the liquidity or the credit flow in the economy.
Monetary policy, inflation targeting, and central bank independence
Debates around the responsibility of the central bank are not new. After the Second World War until the 1960s, Keynesian economics dominated economic policymaking in most countries. In a typical Keynesian framework, the role of monetary policy—and therefore that of a central bank—is limited, because the economic system revolves around direct government intervention and participation in economic activities, particularly in investment and capital formation. The principal duties of the central bank are delivering credit to the priority sectors, as fixed by the government, and ensuring the stability of the financial system, particularly of the banking sector.[xix]
The accordance of such limited role to monetary policy traces back to the Great Depression of the 1930s, when central banks were accused of causing—and exacerbating—the depression. In most countries, monetary policy was placed under the control of the Treasury, and in the wake of rising Keynesianism, fiscal policy became dominant within the policymaking circles. The central bank followed a low interest peg to stimulate the economy and aid the Treasury in mobilising its debt requirements. In the 1950s, as inflation started making a comeback worldwide and economies steered away from Keynesianism, the function of monetary policymaking was restored to the central banks. For example, in the United States, Federal Reserve got its so-called ‘independence’ back after the Treasury-Federal Reserve Accord of 1951.
During the Second World War, the Federal Reserve pledged to keep the interest rate at the lowest possible level, and continued to support the government borrowing even after the war ended. But there was a resistance within the Fed against continuous monetising of government deficit. A brief period of price stability followed until the mid-1960s, but beyond that period there was a significant build-up in inflation worldwide. The inflation in the early 1980s was broken ostensibly by concerted tight monetary policies in the United States, the United Kingdom and other countries. The era of monetarism’s dominance,[xx] as the mainstream school of thought in monetary policymaking, started during the 1970s, and the new norm placed emphasis on the importance of low inflation based on ‘credible’ monetary policies. Essentially, the importance of monetary policymaking remained almost the same since then.[xxi]
This hegemony resulted in the formation of an “inflation targeting” framework – where the central bank fixes a range of price growth for the next one year as a “monetary policy rule” and tries to keep inflation within that range. If inflation rises and crosses that target range, the central bank intervenes by contracting money supply by increasing rates of interest until inflation comes back to the range. As Bernanke et al pointed out, “Inflation targeting is a framework for monetary policy characterized by the public announcement of official quantitative targets (or target ranges) for the inflation rate over one or more time horizons, and by explicit acknowledgement that low, stable inflation is monetary policy’s primary long-run goal. Among other important features of inflation targeting are vigorous efforts to communicate with the public about the plans and objectives of the monetary authorities, and, in many cases, mechanisms that strengthen the central bank’s accountability for attaining those objectives… in practice, inflation targeting serves as a framework for monetary policy rather than as a rule for monetary policy”.[xxii]
What does central bank independence have to do with this inflation targeting framework? Monetarists believe that even with an “inflation targeting rule” in effect, the government or the treasury is tempted in each period to utilise inflation ‘shocks’ to expand output in the short term and to reduce government debt liability, which may then give rise to a “time inconsistency problem”.[xxiii] Assume that inflation is targeted to be kept between four to five percent for the next one year in this framework, and the central bank makes the public announcement. Sellers and buyers will then make decisions according to those price levels, creating an expected equilibrium in the economy. The central bank will work to keep inflation within the target range; if it fails, buyers and sellers will not form their economic expectations on the basis of its inflation targeting in the future. Adhering to the inflation target is therefore a question of credibility for the central bank. On the other hand, if the decision to control price levels is left to the government, it may decide to renege on the target and cross it. This is because an extra amount of inflation (or an “inflation shock”) may induce producers to produce more to increase their profits, which may boost production and output of the economy – at least in the short run. Moreover, since the government is also usually a borrower, any amount of extra inflation can lessen the debt burden.[3] The government will thus always have some macro incentives to “cheat” on the inflation targets. This will cause a dent on the reputation of the government, and thereafter the central bank, and both buyers and sellers will stop trusting “inflation targets”, rendering them completely ineffective.
This tendency to “cheat”, according to monetarists, can threaten the viability of the rules equilibrium and take the economy towards an “inferior equilibrium” under discretionary policymaking.[xxiv] The argument behind central bank independence is that while potential loss of credibility motivates the policymaker (i.e., the central bank) to abide by the rules, the government—which has an incentive to expand output—does not have such compulsion. Therefore, “… the policymaker foregoes the short-term benefits from inflation shocks in order to secure the gain from low average inflation over the long term”.[xxv] A strong case of central bank independence is made to enhance the credibility of the central bank’s commitment to control inflation.
India’s inflation rates and credit supply in recent years
Figure 1 shows how inflation has plunged in recent years – both in terms of wholesale price index (WPI) and consumer price index (CPI). Though 2015-16 onwards, WPI inflation shows an upward trend, it is still at a lower level at 2.9 percent in 2017-18. It remained at low levels even in 2018-19. Triggered by the fall in prices of fuel and some food commodities, WPI inflation fell to an eight-month low of 3.8 percent in December 2018.[xxvi] In the same month, CPI inflation fell to an eighteen-month low of 2.19 percent.[xxvii]
| Fig. 1: Trends in Inflation Rates (annual average) |

* WPI base is 2011-12=100, and CPI base is 2012=100 |
| Source: Handbook of Statistics on the Indian Economy, RBI at dbie.rbi.org.in |
The Sixth Bi-monthly Monetary Policy Statement by the Monetary Policy Committee (MPC) of the RBI, released in February 2019, has taken cognisance of this fact and decided to change the monetary policy stance from “calibrated tightening” to “neutral”. This is also “in consonance with the objective of achieving the medium-term target for CPI inflation of four percent within a band of +/- 2 percent, while supporting growth”.[xxviii] As can be seen, the inflation is within that target range. It would appear that the central bank is succeeding with its “inflation targeting framework”, and gradual interest rate cuts can be undertaken. The question is whether such a flare-up around central bank autonomy was needed to resolve the issue of rate cuts.
Figure 2 provides the direction for an answer. Insufficient credit growth in the past three years, as can be seen in the trends in incremental credit-deposit ratio, points towards the real reason behind the actual grievance of the government against the RBI.
| Fig. 2: Trends in Incremental Credit-Deposit Ratio of the Banking System |
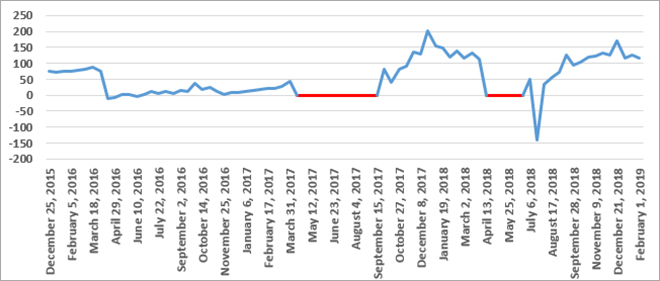 |
| Source: Weekly Statistical Supplement, RBI at dbie.rbi.org.in |
The red lines in Figure 2 represent the figures where both numerator and denominator are negative (i.e., both incremental credit and incremental deposit were negative.) The ratios are positive in these red regions in spite of the fall in both incremental credit and incremental deposit. That is why these ratios are omitted from the time-series. A low-level movement during the period between December 2016 and September 2017 is signified by the imposition of demonetisation and the implementation of the GST (general services tax), after which incremental credit hit a real rough patch. More alarming is a recent repeat of the same trend, particularly after April 2018 till June 2018. Normally, during the festive season of September onwards, overall credit picks up until the calendar year-end, like it happened in 2017. Instead, there were volatile movements in the incremental credit-deposit ratio, with a substantial part of it falling in the low or negative zones.
It is noteworthy that during the period before and immediately after the resignation of Urjit Patel as RBI Governor, incremental credit sporadically went up – only to slide back once again in the succeeding periods. This implies that there have been desperate attempts (including the process of “taming” the RBI) to unclog the credit channel, but in spite of these efforts the symptoms of credit choking remain, and credit growth is not picking up adequately.
Recent GDP figures have shown moderately healthy growth, and even in fiscal year 2018-19 the CSO (Central Statistical Office) expects the GDP growth rate to be 7.2 percent.[xxix] However, the growth of incremental credit in the banking system does not corroborate that kind of consistent healthy GDP growth in the last three years. The resentment of the government against the apex bank originates from this phenomenon, rather than anything strictly related to central bank independence.
A distinct stagnation in credit growth of the banking system can be observed more clearly in Figure 3. Looking at the trends of credit growth in this one year, then apart from outstanding loans and advances in the range of six to nine percent – all other loans with interest rate ranging from nine percent to more than 20 percent stagnated in this year. Loans in some of these interest rate ranges declined in absolute amounts as well.
| Fig. 3: Interest Rate Range-Wise Classification of Outstanding Loans and Advances of All Scheduled Commercial Banks (in INR Million) |
 |
| Source: Quarterly Basic Statistical Returns (BSR-1): Outstanding Credit of Scheduled Commercial Banks, RBI at dbie.rbi.org.in |
A comparison of interest rates as recorded in the State Bank of India website[xxx] with other PSU and private banks’ rates reveals that the range between six and nine percent mainly belongs to the retail loans category (such as personal loans and education loans.) Business loans are charged interest rates of 11 percent and upwards. One can then conclude that there was a stagnating trend in business loans in FY17, which persisted even in FY18. Here the government’s point of view (i.e., the RBI as monetary policymaker might have failed in ensuring the flow of credit in the economy) may gain some credence. However, credit demand may also have played its role in ensuring this stagnation.
Figure 4 depicts the general lack of demand in the economy since 2014-15. Capital formation growth, or investment growth in real sector, has been falling after that year. In view of this falling investment growth rate, it is obvious that credit demand for new investment would also automatically fall. Therefore, the onus of low or stagnating credit growth does not lie solely with the RBI. If no investments are made in the economy, then credit demand to finance such investments will also fall. Therefore, even if credit supply is bolstered further by some means, there may not be any credit offtake, after all.
| Fig. 4: Trends in Growth Rates of Gross and Net Capital Formation (in %) |
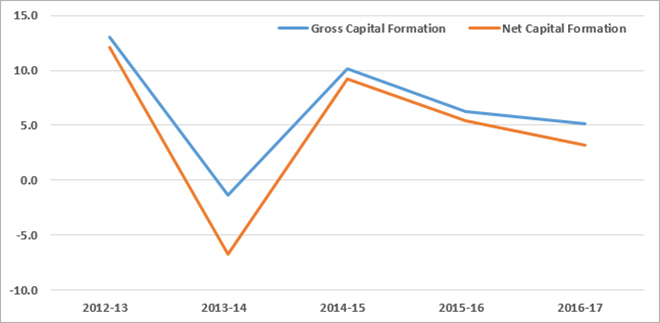 |
| Source: Handbook of Statistics on the Indian Economy, RBI at dbie.rbi.org.in |
The government clearly expected the RBI to allow the banks (i.e., the PSU banks) to restart lending to the economy (including the NBFCs)– even if that means diluting the regulatory norms of the PCA framework. The RBI under Urjit Patel did not appear willing to do that. Otherwise, there is no good reason that can be cited for his resignation.
Most discussions on central bank independence are on two key dimensions of independence. The first dimension relates to those institutional characteristics that insulate the central bank from political influence in defining its policy objectives. The second dimension encapsulates those aspects that allow central banks to freely implement policy in pursuit of monetary policy goals.[xxxi] The public spat between the RBI and the Ministry of Finance proves that the first principle has been violated in the current case. Similarly, the second principle has also been violated – since the central bank has the responsibility to protect the financial stability of the system as one of its core monetary policy goals. Diluting the PCA framework may result in serious repercussions for the entire banking system, particularly in the face of huge amounts of NPAs. Increasing credit flow into the system, ideally, should not be done at the cost of making the banking system and the entire financial system vulnerable.
The problem of credit flow
The serious crunch in credit growth came into the headlines immediately after the crisis-hit Infrastructure Leasing and Financial Services (IL&FS) failed to honour their loan repayment commitments in September 2018. The company’s unexpected default was followed by a take-over by the government.[xxxii] While the resultant panic in the capital and money market had an adverse impact on the overall credit channel of the economy, the problem in the credit channel was already brewing for some time (See Figure 2).
NBFCs, particularly the housing finance companies (HFCs), grew rapidly in the last four years due to some unusual factors.[xxxiii] Most PSU banks, showing risk-averse behaviour under the pressure of mounting NPAs,[xxxiv] did not lend to the riskier set of borrowers including SMEs and lower income borrowers seeking housing loans. The banks, however, were willing to lend money to the NBFCs, whose capital base provided a sense of security—which would later be proved false—in case of a default.
Meanwhile in the macroeconomy, the household and corporate savings were compelled to invest in other financial assets as savings rates (including small scale savings rates) and long-term bond yields were continually slashed. Both household and corporate savings flowed into various financial assets, principally in mutual funds (MFs). A large part of these MFs come through a steady stream of systematic investment plans (SIPs).
| Fig. 5: Trends in Mutual Fund Investments |
 |
| Source: Mobis Philipose (2019), Livemint[xxxv] |
As seen in Figure 5, MF net purchases peaked as the stock market did. It would appear that Indian MF investors invest only after seeing a peak in stock market returns. The problem with such an approach is that once the returns are poor, investment through the MF route will also tend to dry up (see Figure 5). On the other hand, as also gleaned from Figure 5, the FIIs (foreign institutional investors) have a more market-related perception and they sell their market assets particularly when the market is at a peak. Such a contrast between the domestic and foreign investors’ stock market buying and selling behaviours also points towards a risky situation where the domestic investors may lose their money through the MF channel in the event of a crash. This discussion is beyond the scope of this paper. What is relevant here is that going by the trends, one can assume that mutual fund inflows into the system is likely to come down (or, at least not pick up) in the immediate future. Therefore, one steady source of funds of the NBFCs may not be available to them in the near future.
To be sure, before the blow-up of the IL&FS default, a steady flow of funds came from these MFs. Demonetisation in November 2016 hastened the process of fund inflow, and resulted in unprecedented liquidity in the banking system. This tide of domestic capital, otherwise unavailable, flowed into debt and equity markets via all kinds of financial channels, including the MFs, which led to a sharp rise in share prices and further fall in interest rates and long-term yields.
| Table 2: Inter-sector Assets and Liabilities – As of March 2018 (in INR billion) | ||
| Financial Entity | Receivables | Payables |
| PSU Banks | 6841.1 | 3236.2 |
| Private Banks | 3036.6 | 8512.3 |
| Foreign Banks | 981.9 | 916.9 |
| Scheduled Urban Cooperative Banks (SUCBs) | 126.2 | 31.6 |
| All-India Financial Institutions (AIFIs) | 2410.4 | 2665.8 |
| AMC-MFs | 8851.8 | 560.4 |
| Insurance Companies | 5022.1 | 207.4 |
| NBFCs | 419.5 | 7169.9 |
| PFs | 583.6 | 1.3 |
| HFCs | 312.4 | 5283.8 |
|
* Analysis is based on a sample including 80 SCBs, 20 SUCBs, 22 AMC-MFs (which cover more than 90 percent of assets under management in the mutual fund sector), 32 NBFCs (both deposit taking and non-deposit taking systemically important companies), 21 insurance companies (which cover more than 90 percent assets of insurance sector), 15 HFCs, 7 PFs and 4 AIFIs (NABARD, EXIM, NHB and SIDBI). * Inter-sectoral exposure does not include transactions among entities of the same group. |
||
| Source: Financial Stability Report June 2018, RBI. | ||
This is clear from Table 2. Asset Management Companies managing Mutual Funds (AMC-MFs) are the dominant fund providers of the system, followed by the insurance companies and the PSU banks. Notably, all lenders (those who have a net receivable position against the rest of the financial system) except SUCBs (Scheduled Urban Cooperative Banks) recorded an increase in their net receivable position in March 2018 over March 2017. Enough liquidity therefore flowed into the financial system and parked themselves at different financial destinations. These funds mostly went to the NBFCs and the HFCs, as described earlier. Private banks also received substantial portions of this liquidity. However, as they are generally more cautious lenders, their asset quality indicators turned out more favourable.
Riding on this injection of liquidity, the valuation of these NBFCs surged upwards, in turn improving the ratings of their assets. Additionally, on increased valuations, many of these NBFCs could easily raise equity capital. The larger and better rated ones (with AA and above rating) also issued debt papers to mutual funds and insurance companies. In a system flooded with sudden liquidity, most of these NBFCs were able to raise debt capital at interest rates – comparable or even lower than those offered by banks. It resulted in NBFCs receiving funds from all kinds of sources, with the PSU banks being one such primary source. (See Figure 6.)
| Fig. 6: Gross Payables of NBFCs – As of March 2018 |

|
| Source: Financial Stability Report June 2018, RBI |
The data confirms that the main providers of financial resources to the NBFCs were the banks and the mutual funds. The NBFCs grew at an unprecedented pace, taking those very same credit risks that the banks were avoiding. The rapid rise in the number of HFCs is a testimony: the number doubled from around 50 in 2013 to the currently nearly 100.[xxxvi] Most of these new NBFCs and HFCs had lower ratings (BBB or below) and therefore could not access mutual funds or insurance companies.
This also resulted in a game of rating arbitrage. Better rated NBFCs availed their money from banks and mutual funds, and then lent those to the lower rated NBFCs at a much higher rate. The risks (avoided by the banks) of the lower-end NBFCs thus spread to the entire sector.[xxxvii] At the same time, this process of debt spreading to the riskier and thinner side of the NBFC sector also sustained the rapid rise in the stock market valuations of these entities. Meanwhile, as global factors like rising oil prices and increasing trade tensions brought back inflationary expectations, Indian interest rates started to rise. The yield on the benchmark 10-year government bond increased from around 6.8 percent to over 8.0 percent in only three months’ time.[xxxviii]
Since then, fresh inflow into mutual funds—especially debt funds—slowed down and debt fund managers started a wait-and-watch policy. This resulted in liquidity drying up, the credit channel getting choked, and borrowing costs rising. In this backdrop, IL&FS defaulted and apprehensions of large-scale redemption of mutual funds gripped the market. There was panic selling, which resulted in the downgrading of debt securities. Two weeks before the default, IL&FS debt were categorised as AAA rating which tumbled to the lowest D after the default.[xxxix] As yields on corporate bonds went up, the debt market almost stalled. At this juncture, the RBI intervened and injected liquidity in the system, calming the markets.
Therefore, the non-bank credit flow to the system choked sufficiently, but these non-bank flows were heavily dependent upon bank credit flows. After the IL&FS episode, banks identified the risks in further contributing to these non-bank credit flows. A September 2018 Credit Suisse note observed that the situation might worsen as 41 percent of total NBFC borrowings are coming up for redemption in the next six months.[xl] That also contributed to the ensuing panic among the prospective lenders to the NBFCs. Yet, the Central Government seemingly did not want the stock market exuberance to end, fuelled as it was by these credit inflows originating from the PSU banks; definitely not before the next parliament elections. There was thus an urgent need to “tame” the central bank so that the credit kept on flowing to the riskier ends of the financial markets.
| Table 3: Sectoral Deployment of Bank Credit (in INR billion) | ||||
| Outstanding as on March 18, 2016 | Outstanding as on March 31, 2017 | Outstanding as on March 30, 2018 | Net credit disbursed between March 2016 & March 2018 | |
| Non-food Credit (1 to 4) | 65469.03 | 70944.90 | 76884.23 | 11415.20 |
| Agriculture & Allied Activities (1) | 8829.42 | 9923.86 | 10302.15 | 1472.73 |
| Industry (2) | 27306.77 | 26798.33 | 26992.67 | -314.10 |
| Micro & Small | 3714.67 | 3697.31 | 3729.99 | 15.32 |
| Medium | 1148.21 | 1048.06 | 1036.80 | -111.41 |
| Large | 22443.89 | 22052.96 | 22225.89 | -218.00 |
| Services (3) | 15410.67 | 18022.37 | 20504.71 | 5094.04 |
| of which – | ||||
| Non-Banking Financial Companies (NBFCs) | 3527.42 | 3910.32 | 4963.93 | 1436.51 |
| Personal Loans (4) | 13922.16 | 16200.34 | 19084.69 | 5162.53 |
| of which – | ||||
| Housing (Including Priority Sector Housing) | 7467.80 | 8600.86 | 9745.65 | 2277.85 |
| Source: Handbook of Statistics on the Indian Economy, RBI (dbie.rbi.org.in) | ||||
As can be seen from Table 3, the NBFCs have been the recipients of INR 1436.51 billion credit between March 2016 and March 2018 – constituting more than 28 percent of the services sector credit in these two years. Housing loans amounted to INR 2277.85 billion, which is more than 44 percent of total personal loans disbursed. In contrast, industrial credit has gone into the negative zone, showing the symptoms of what principally ails the economy.
This set of data tells the real story behind the tussle between the apex bank and the central government. Extraordinary credit flow to the NBFCs and the housing sector sustained the prolonged upward trend in the stock market and overall upbeat perception about the economy, even as the usual credit flowed out of the brick-and-mortar industries – likely due to a lack of industrial credit demand. The flow to the NBFCs and the housing sector was able to create an illusion of overall economic growth.
Inside the NBFC lending matrix
Even as recently as one year ago, the NBFCs were receiving praise for being more efficient than the banks and serving as the “new credit supplier of the economy”. Since the NBFCs have relatively lower operating costs, their profit margins were also higher. Figure 7 illustrates the story in terms of year-on-year growth in advances made by these NBFCs. Although the growth in advances suffered a setback in FY17 (most probably due to demonetisation),[4] the sector made a comeback in FY18. Note that the number of firms taken (sample size) in FY18 in the CRISIL Report (the data source) is much lower than that in the earlier years in all sectors within the NBFCs.
| Fig. 7: Year-on-Year Growth in Advances Made by the NBFCs (in %) |
 |
| Source: NBFC Report 2018, CRISIL |
The diagram also points to some alarming trends. For one, NBFCs related to infrastructure finance, microfinance and wholesale finance could not make as strong a comeback as NBFCs related to housing finance, auto finance and diversified finance. (Note that the data are only upto March 2018, when the problems did not yet show their full impacts.)
The evidence of more credit flows towards auto and housing financing is also corroborated by more latest figures from the RBI (see Table 3.)
| Table 4: Credit to Various Sectors by NBFCs | |||
| (in INR billion) | |||
| End-March 2017 | End-March 2018 | End-Sept 2018 | |
| Gross advances | 14,857 | 17,643 | 19,842 |
| Non-food Credit | 14,855 | 17,640 | 19,837 |
| Agriculture and Allied Activities | 354 | 476 | 596 |
| Industry | 8,940 | 9,655 | 10,374 |
| – of which | |||
| Micro and Small | 508 | 561 | 516 |
| Medium | 172 | 252 | 325 |
| Large | 4,375 | 4,785 | 5,128 |
| Others | 3,885 | 4,055 | 4,405 |
| Services | 2,224 | 3,013 | 3,563 |
| – of which | |||
| Commercial Real Estate | 958 | 1,257 | 1,337 |
| NBFCs | 198 | 240 | 357 |
| Retail Loans | 2,490 | 3,639 | 4,381 |
| – of which | |||
| Housing Loans (including Priority Sector Housing) | 106 | 135 | 165 |
| Vehicle/Auto Loans | 1,035 | 1,675 | 1,942 |
| Other Retail Loans | 984 | 1,326 | 1,650 |
| Commercial Real Estate & Housing Loans | 1064 | 1,392 | 1,502 |
|
* Data are provisional. * This format of reporting of credit to various sectors was introduced from March 31, 2017. Hence, the comparable data for previous years are not available |
|||
| Source: Report on Trend and Progress of Banking in India, 28 December 2018, RBI | |||
Table 4 shows noteworthy patterns that are not discernible from Figure 7. First, the flows of NBFC credit towards large industries constitute the major part of overall industrial credit provided by the NBFCs. Recall from Table 3 that there has been negative credit disbursal by the banking system to this segment of the industry. This explains the gradual increase in dependence of the large industries on NBFCs for credit. A process of replacement of the (PSU) banks as principal lender to large industry, by these NBFCs started in the last two years or so. This is one of the factors explaining the government’s eagerness to maintain the credit flow towards NBFC sector at any cost. Second, housing loans provided by the NBFCs are undoubtedly substantial but relatively much larger credit have been provided to the commercial real estates. Many commentators are talking about vulnerability in housing sector vis-à-vis NBFC loan exposure, but the real story lies in the commercial real estate – rather than in housing sector. If the real brick-and-mortar economy fails to revive substantially in the future, this is the segment that can produce bad assets in the balance sheets of the NBFCs and, consequently, in those of the PSU banks.
| Fig. 8: Trends in GNPA of the NBFCs (in %) |
 |
| Source: NBFC Report 2018, CRISIL |
There has been an overall deterioration in the asset quality of the NBFCs across the sectors, except in wholesale finance segment. (See Figure 8.) As expected, larger gross non-performing assets (GNPA) primarily lie with infrastructure finance and microfinance segments. Continuing bad performance in these two segments will have greater negative ramifications in the overall macroeconomy.
Problems in the infrastructure sector have been lingering for some years now. The RBI, as regulator, sees substantial stress and risks in these sectors. Credit risks arising from exposure to the infrastructure sector – particularly power, transport and telecommunications – can adversely impact the GNPA of the entire banking system. Though not as much as these infrastructure sectors, the potential risk in textile and engineering are also substantial. The results of the standard sectoral credit risk, as given in the Financial Stability Report (June 2018) of the RBI, are shown in Figure 9.
| Fig. 9: Sectoral Credit Risks: Impact on the GNPA ratio of the banking system |
 |
| #: Shock assumes percentage increase in the sectoral NPA ratio and conversion of a portion of standard advances into NPAs. The new NPAs arising out of standard advances have been assumed to be distributed among different asset classes (following the existing pattern) in the shock scenario. |
| Source: Financial Stability Report June 2018, RBI |
The stress test is done by assuming an increase by a fix percentage point in GNPA of a specific sector and then estimating its effect on the GNPA of the entire banking system. The most disturbing aspect of Figure 7 is that even a two-percent shock on the standard advances in any of these sectors can catapult the entire banking system’s GNPA well over the 10-percent level. Combine this fact with the GNPA figures of the NBFCs in different sectors (See Figure 8), and the country’s credit situation becomes even more worrisome.
The cost of borrowings for the NBFCs in the last few years have fallen down (see Figure 10.) However, post-ILFS, this cost is definitely expected to go up. The CRISIL Report on NBFCs expects the liquidity squeeze to affect the growth of the sector, predicting a six-percent decrease in growth in FY19, and a 30-40 basis-point increase in cost of borrowing in FY19 and another 70 basis-point increase in FY20. This will substantially increase the operating costs of the NBFCs.[xli] Except for very large NBFCs, most others are bound to see compression in their profit margins as a result.
| Fig. 10: Average Cost of Borrowings (in %) |
 |
| Source: NBFC Report 2018, CRISIL |
This expected profit compression of the NBFCs is creating panic among all stakeholders in the economy – specifically within the government. Table 5 shows the trends in some key financial ratios of the NBFCs-ND-SI (strategically important non-deposit taking NBFCs), which constitute 84.8 percent of the total assets of the NBFC sector.[xlii] In 2016-17, both income and expenditure of the NBFCs-ND-SI were on the higher side at 11.2 percent and 8.8 percent of total assets. The following year, though the income decreased expenditure also decreased simultaneously – leading to an increased net profit margin of 1.6 percent of total assets.
| Table 5: Trends in Financial Ratios of NBFCs-ND-SI (as % of total assets) | |||
| 2016-17 | 2017-18 | H1:2018-19 | |
| Income | 11.2 | 10.5 | 5.0 |
| – of which | |||
| Fund Income | 10.9 | 10.1 | 4.8 |
| Fee Income | 0.4 | 0.4 | 0.2 |
| Expenditure | 8.8 | 8.2 | 3.9 |
| – of which | |||
| Financial Expenditure | 5.6 | 5.1 | 2.5 |
| Operating Expenditure | 1.6 | 1.7 | 0.8 |
| Tax Provision | 0.9 | 0.7 | 0.3 |
| Net Profit | 1.5 | 1.6 | 0.8 |
| Source: Report on Trend and Progress of Banking in India, 28 December 2018, RBI | |||
However, the first half of 2018-19—at the tailend of which the IL&FS fiasco happened—shows disturbing trends in these ratios: both income and expenditure crashed, leading to a 0.8 percent (of total assets) net profit. Needless to say, net profit as percent of total assets closing towards zero level practically means inadequacy of the assets to cover expenditure.
Avoidance of such a crisis situation is paramount for the NBFC sector and the economy. However, shifting that crisis towards the banking system is definitely not the solution to this problem. But the government is doing exactly that by practically taking over the apex bank in an attempt to keep the credit flowing by diluting the PCA framework.
Compulsion to maintain status quo in credit channel
A slowdown (and sometimes stalling) in credit originating from the banking system is one of the stylised facts of Indian economy in recent times, which can be easily checked from publicly available data. Accumulation of NPAs in the banking system, particularly in the PSU banks, is another stylised fact, although finding precise data on these is relatively harder.
The battle on central bank autonomy towards the end of the last calendar year, in a way, originated from these two problems. The RBI, as the regulator of the banking system, had to address the bad loans existing in the system. Going by the year-on-year percentage change in net interest incomes (NIIs) of the banks under the prompt corrective action (PCA) framework, the RBI’s efforts as regulator showed mixed results on these banks laden with bad loans. While some of these banks showed healthy increase in their NIIs, there are a few which have not shown signs of adequate revival (Figure 11). Overall, one can say that the PCA framework has indeed made some difference in tackling the bad loans of the PSU banks.
| Fig. 11: Year-on-Year Change in Net Interest Income of the Banks under PCA |
 |
| * Year-on-Year change is calculated by using June Quarter data of FY18 and FY19 |
| Source: Ghosh (2018), Livemint[xliii] (original source: Capitaline) |
However, out of these eleven banks the RBI has taken Bank of India, Bank of Maharashtra and Oriental Bank of Commerce out of the PCA framework. Going by the parameter of percentage increase in net interest income, these are not the banks which have made the best progress so far. Comparing this action with the results of Figure 11, this is a distinct sign of diluting the PCA framework. This is where the problem lies.
First risk threshold of PCA framework is defined as breaching of CRAR (capital to risk weighted asset ratio) of 7.75 percent, or breaching of CET 1 (common equity tier 1) ratio of 5.125 percent. But, Risk Threshold 1 can also be triggered by a breaching of 6 percent NNPA (net non-performing assets) ratio, and/or negative ROA (return on assets) for two consecutive years, and/or breaching of 3.5 percent Tier 1 Leverage Ratio.[xliv]
After infusion of capital in PSU banks by the government,[xlv] the capital adequacy ratio would have improved for obvious reasons. However, to ensure sustainable performance and profitability of these banks, the results of at least a few more quarters of these banks should have been observed and monitored. According to the PCA framework, any bank may come under it “based on the audited Annual Financial Results and the Supervisory Assessment made by the RBI”.[xlvi] If entry into PCA framework is based on audited annual financial results, then ideally, exit should also be based on the same. However, the decision to pull these banks out of PCA has been taken on the basis of “audited quarterly results”.[xlvii] The questions on these banks’ long-term profitability, therefore, remain open.
Industry (particularly small-scale industries), services and financial sector require a steady flow of credit undoubtedly. But if that is done by diluting the corrective framework, which is making a difference in improving the affected banks’ performance, then it is guaranteed to make the banking system and thereafter the entire financial system vulnerable to future risks. This may lead to a crisis-like situation within the sector.
Under the burden of mounting NPAs, the banks refrained from channelling credit towards the riskier and thinner ends of the financial sector. Instead, the banking system kept on supplying substantial amount of credit to the NBFCs. Flush with funds from both the banks and MFs, the NBFCs in turn created assets in different sectors which were rated very high by the rating agencies. However, after the crises of both IL&FS and DHFL, it has now become clear that everything is not well with the NBFC sector. On the contrary, suspect assets and bad loans may be prevalent for quite a few NBFCs. Since November 2014, the asset classification norms of NBFCs have been incrementally aligned with those of the banks, leading to higher NPA recognition.[xlviii]
A look at the IL&FS balance sheet in the CRISIL NBFC Report reveals that GNPA data for IL&FS are not available for the past four years. This signifies the opacity of financial performance data of the IL&FS. More stringent the asset classification norms are made by the RBI for the NBFCs, more such instances of opacity in operation of other NBFCs may come into light in future.
In this kind of a scenario, if the RBI – directed by the government – keeps on pushing the banking system to continue supplying credit to the NBFCs as before, then one cannot rule out the possibility of a widespread crisis occurring in the banking system and then in entire financial sector. In an economy with rising unemployment, that financial crisis – if it happens – will turn into an economic crisis in no time. However, uninterrupted credit flow is also important for maintaining higher share prices of the NBFCs. Among other factors, this played its role in the government’s insistence to take charge of the economy’s credit channel.
If one looks into the top 100 companies by market capitalisation in the Bombay Stock Exchange (BSE) then there are six large NBFCs in that list.[xlix] They are – (1) Housing Development Finance Corporation Limited (HDFC), (2) Bajaj Finance Limited, (3) Bajaj Finserv Limited, (4) Indiabulls Housing Finance Limited, (5) Power Finance Corporation Limited (PFC), and (6) L&T Finance Holdings Limited. Collecting month-wise share prices of these six NBFCs since January 2018 and observing the volatility trends in these share prices provide credence to the linkage between stock market indices and performance of such companies. All of these share prices dipped in the month of September 2018 when the IL&FS crisis hit the financial markets. Fear of default by the real estate companies pulled down the Sensex heavily even in the month of October.[l] Only by November the share prices of these NBFCs along with the benchmark Sensex started showing consistent upwards trend again.
| Fig. 12: Movement in Share Prices of the Top Six NBFCs |
 |
|
* PFC and L&T Finance are scaled on the right axis, rest are scaled on the left axis. * Share prices are closing prices, monthly average. Data Source: Bombay Stock Exchange (BSE) website[li] |
One can always argue that the top six NBFCs cannot be representative of the entire NBFC sector, but these share prices trends are indicative. If two out of top six NBFCs (HDFC and Indiabulls Housing), in terms of live share prices, could not fully recover from the IL&FS shock then definitely there will be more such companies. Conversely, if four top NBFCs – in terms of share prices – scored high (compared to the September crash) riding on the sure-shot signals from the government that credit flow towards the NBFCs would not be interrupted, then definitely similar results can be seen in many other NBFCs. This is not to say that all NBFCs are in serious financial trouble post-IL&FS. Surely, there are NBFCs that show safe and sound fundamentals. However, the credit flow from the banks to the NBFCs is important to maintain the high level in their stock market prices and subsequently in the benchmark Sensex. And that is the moot point here. The government’s demand to the central bank for opening a special lending window for the NBFCs bears testimony to this.
Conclusion
The economy is currently on an unsustainable credit path. Banks supply funds to the NBFCs; NBFCs employ those funds in some of the areas which banks initially tried to avoid; in the absence of a revival in credit growth from the banks, some sections of the economy get over-dependent on the NBFCs; financial skeletons come out of some of the prominent NBFCs; malpractices in the financial sector threaten to derail stability, but the government directs the banks – through the RBI – to continue pumping money in the same direction. Indeed, such a credit path is a “knife-edge” walk (borrowing the phrase from 20th-century growth economist Roy F. Harrod) – deviating from this path may result into stagnation and deceleration in real economy, but to keep on walking this path may lead to a banking and a financial crisis.
The accumulation of NPAs in the PSU banks is one stylised fact in the current Indian economy which cannot be wished away. The resultant friction in the credit channel due to unwillingness of the PSU banks is a real problem. However, resolving that conundrum by pushing these PSU banks once again to channel the credit flow towards risky sectors like power, telecommunications and housing – via the NBFC route – is an unsustainable proposition in the longer run.
Rather than treating the RBI and the PSU banks as “saviours” in a time when credit is hard to come by and the economy is stalling, there is a need for fresh thinking in policymaking. A Keynesian route of fiscal stimulus may not be a bad idea after all. However, in an election year, fresh thinking to solve some of the serious economic problems may not be the first thing in the agenda of the government.
References
Endnotes
[1] Prompt Corrective Action (PCA) is a framework, under which the banks with weak financial parameters (primarily on three counts – capital ratios, asset quality and profitability) are put under observation by the RBI. The banks are also subjected to certain restrictions like stopping of lending under this framework.
[2] IL&FS defaulted in payment obligations of bank loans (including interest) and also term loans, and failed to meet the commercial paper redemption obligations – which were due on 14 September 2018. As a result, rating agencies started downgrading the entity’s assets and practically flow of funds from market sources stopped. Subsequently, the government superseded its board through legal recourses and restructured the board. Post-IL&FS crisis DHFL was hit by a liquidity crunch like a few other housing finance companies. In early 2019, allegations of financial irregularities cropped up against the promoters and DHFL plunged into second phase of the crisis. In both the cases, the process of repayment of loans is under risk.
[3] For example, if INR 100 is borrowed at a 10 percent rate of interest and corresponding inflation rate in the year is at 8 percent then in real terms the borrower would be paying a rate of interest of (10-8=) 2 percent.
[4] Housing, infrastructure and microfinance were expected to be hit by demonetisation as these sectors are dependent on cash transactions. Temporary stalling of economic activities post-demonetisation was bound to affect credit demand in the short run and the data also suggest so as sectors like auto and diversified finance were impacted negatively. Only wholesale finance remained relatively unaffected – probably because bigger players are involved in the process and demonetisation’s effect was the largest among medium and small business entities.
[i] Abhijit Mukhopadhyay, “New GDP Series: More questions than answers”, ORF Online, 12 September 2018.
According to the CSO, the new (GDP) series captures value addition in manufacturing better as it uses the MCA (Ministry of Corporate Affairs) database – which includes activities of industries (like sales, marketing and R&D undertaken at locations other than the headquarters of the industries) that were hitherto not considered by ASI (Annual Survey of Industries). Older series was heavily dependent upon the ASI data to make the final estimates of GDP for industries, particularly manufacturing. However, the EPW article by Dholakia et al (Ravindra H. Dholakia, R. Nagaraj and Manish Pandya) states – “… the article has sought to examine if the CSO’s claims about the shortcomings of ASI are in fact true. A careful perusal of the ASI’s Instructions Manual provided to field investigators amply demonstrates that the official contention is largely incorrect… We have then sought to corroborate these findings with the ASI filled-in questionnaires for select enterprises… Information gathered from the field supports our contention: the ASI, in fact, includes value addition in activities outside of factories such as company headquarters and sales force.”
[ii] Central Statistics Office (CSO), “Press Note on First Advance Estimates of National Income 2018-19”, 7 January 2019.
[iii] RBI, “Chapter II, Financial Stability Report”, June 2018
[iv] The Indian Express, “RBI takes three banks out of the PCA framework”, 1 February 2019.
[v] The Economic Times, “After Rs 12,600 crore bank fraud, should Reserve Bank stop policing the banks?”, 12 March 2018.
[vi] The Indian Express, “RBI wanted to pull out nominees from public sector bank boards, Govt says no”, 17 October 2018.
[vii] The Economic Times, “Nachiket Mor’s 2nd tenure on RBI board cut short”, 1 October 2018.
[viii] Financial Express, “RSS-affiliate SJM welcomes Nachiket Mor’s sacking from RBI board”, 1 October 2018.
[ix] Bloomberg Quint, “S Gurumurthy and Satish Marathe appointed to RBI Board”, 7 August 2018.
[x] The Economic Times, “Govt may invoke Section 7 of RBI Act for Governor to follow board’s majority view”, 1 November 2018.
[xi] The Reserve Bank of India Act, 1934.
[xii] Business Line, “Viral Acharya: Govts that don’t respect central bank independence, invite wrath of markets”, 27 October 2018.
[xiii] Ibid
[xiv] Livemint, “The gloves are off in the RBI-Government fight”, 31 October 2018.
[xv] Ibid
[xvi] Ministry of Finance, PIB Release, “Autonomy of RBI”, 14 December 2018.
[xvii] The Economic Times, “Urjit Patel resigns as RBI Governor”, 11 December 2018.
[xviii] The Hindu, “Shaktikanta Das appointed as RBI Governor”, 11 December 2018.
[xix] Samuelson (1985)
[xx] Monetarism revolves around the theory or practice of controlling money supply as the principal method to stabilise the economy. This school of economic thought was initiated by Milton Friedman in the late 1960s.
[xxi] For more details see Bordo (2008)
[xxii] Bernanke et al (2001)
[xxiii] Kydland and Prescott (1977) first formulated this ‘time inconsistency’ problem, while Barro and Gordon (1983a) asserted that any policy rule which can be reneged upon is not ‘credible’ and therefore would fail to solve time inconsistency. Finally, Rogoff (1985) argued that a ‘conservative’ independent central bank is the solution to this problem.
[xxiv] In other words, instead of using an “inflation targeting rule” (where rate of interest is automatically adjusted when there is inflation) if a “discretionary” approach is taken (where rate of interest is changed at the discretion of the government), then the efficacy of interest rate as the policy instrument will be compromised. In the next period, expectations about targeted inflation range will be compromised which will result in distortions in supply and demand, and finally in an “inferior equilibrium”.
[xxv] Barro and Gordon (1983b)
[xxvi] The Economic Times, “WPI inflation falls to an eight-month low of 3.8 per cent in December”, 14 January 2019.
[xxvii] Financial Express, “CPI inflation falls to 18-month low; declines to 2.19% in December”, 14 January 2019.
[xxviii] RBI, “Sixth Bi-monthly Monetary Policy Statement, 2018-19 Resolution of the Monetary Policy Committee (MPC) Reserve Bank of India”, 7 February, 2019.
[xxix] Livemint, “What India GDP growth rate forecast for 2018-19 means”, 16 January 2019.
[xxx] State Bank of India website
[xxxi] Grilli et al (1991), Debelle and Fischer (1994)
[xxxii] Livemint, “IL&FS takeover done, government focus now on financials”, 1 October 2018.
[xxxiii] Harsh Vardhan, “A Moment of Truth for NBFCs…And for the System”, 2 October 2018, Bloomberg Quint.
[xxxiv] According to the RBI database, in 2016-17 the amount of NPAs in scheduled commercial banks has been at a whopping INR 7902.68 billion or 9.3 percent of gross advances, out of which INR 6847.33 billion (86.6 percent of total NPAs) – 11.7 percent of the gross advances – were with the PSU banks.
[xxxv] Mobis Philipose, “The dangers of high mutual fund inflows”, 19 January 2019, Livemint.
[xxxvi] Harsh Vardhan, op. cit.
[xxxvii] Ibid
[xxxviii] Ibid
[xxxix] The Economic Times, “IL&FS fiasco: Why rating agencies need a reform”, 26 October 2018.
[xl] The Economic Times, “India’s shadow banking scare could derail its robust growth story”, 27 September 2018.
[xli] CRISIL, “NBFC Report”, 2018
[xlii] RBI, Chapter VI: Non-Nanking Financial Institutions, “Report on Trend and Progress of Banking in India”, 28 December 2018. Among NBFCs-ND (Non-deposit taking NBFCs), those with an asset size of INR 5 billion or more are classified as NBFCs-ND-SI. At the end of September 2018, there were 276 NBFCs-ND-SI. The number may look small compared to the total number of NBFCs at 10,190 but as mentioned in the text these NBFCs-ND-SI constitute 84 percent of the total assets of the NBFC sector.
[xliii] Shayan Ghosh, “Banks under RBI PCA show mixed results”, Livemint, 31 October 2018.
[xliv] RBI, “Revised Prompt Corrective Action (PCA) Framework for Banks”, 13 April, 2017.
[xlv] Livemint, “Government infuses Rs. 10,882 crore capital in four PSU banks”, 31 December 2018.
[xlvi] RBI, “Revised Prompt Corrective Action (PCA) Framework for Banks”, op. cit.
[xlvii] RBI, “Edited Transcript of Reserve Bank of India’s Sixth Bi-Monthly Monetary Policy Tele-Conference with Researchers and Analysts”, 9 February 2019.
“The banks which were taken out of the PCA, they were not in breach of the parameters of PCA framework except Return on Assets, which is reflected in the capital adequacy. So that is very important and we have seen the quarterly audited numbers as well and we have seen the qualitative improvement in these banks and that is the reason we have taken these banks out of PCA.”
[xlviii] Chapter VI, “Report on Trend and Progress of Banking in India”, op. cit.
[xlix] Bombay Stock Exchange, “Top 100 Companies by Market Capitalisation”, As on 1 April 2019.
[l] Livemint, “Sensex retreats nearly 400 points as NBFC meltdown resumes”, 18 October 2018.
[li] Bombay Stock Exchange, “Historical Stock Prices”, 1 April 2019.
The views expressed above belong to the author(s). ORF research and analyses now available on Telegram! Click here to access our curated content — blogs, longforms and interviews.

Abhijit was Senior Fellow with ORFs Economy and Growth Programme. His main areas of research include macroeconomics and public policy with core research areas in ...
Read More +