Nilanjan Ghosh, Soumya Bhowmick and Roshan Saha, “SDG Index and Ease of Doing Business in India: A Sub-National Study”, ORF Occasional Paper No. 199, June 2019, Observer Research Foundation.
This paper offers a business case for the United Nations Sustainable Development Goals (SDGs): the promotion of the SDGs creates an enabling business environment by nurturing capital in its human, social, natural and physical forms. This proposition is exhibited across the sub-national economies delineated by the Indian states through the development of an SDG index entailing 76 component indicators across 23 states. The paper argues that this index is more useful than the one developed by government’s NITI Aayog, as it possesses statistical robustness and variable inclusivity. Further, econometric analyses suggest that this index is a statistically significant variable explaining the Ease of Doing Business index, and FDI flows to the states. A state’s development policy, through the promotion of the SDGs, is therefore not divorced from its investment promotion strategy.
I. Introduction
Reductionist neoclassical growth perspectives continue to dominate economic discourse. In many parts of the world, however, analysts are increasingly engaging in more holistic discussions of development. Indeed, various scholars have long dwelled on the limitations of growth-fetishism as an anchor of development literature (e.g. Schultz 1963 and 1971; Lewis 1965; Singer 1965; Myrdal 1968; Seers 1969; Haq 1971; Schumacher 1973; Stiglitz 1998; Ayub 2013). These researchers have sought to call attention to the equity concerns of poverty, inequality, health, and education, as equally important parameters of development that often tend to be shrouded under figures such as rising gross domestic product (GDP). This makesgrowtha univariate concept, in contrast todevelopmentwhich is multivariate comprising amongst others, literacy, mortality, life expectancy, financial inclusion, and access to drinking water and healthcare (Banik and Yoonus 2012). These equity concerns came to the fore with the adoption of the Human Development Index (HDI).[1]
At the same time, the very sustainability of economic development was being questioned by the Club of Rome’s hard-hitting thesis,Limits to Growth, because of concerns about the growing environmental crisis. Environmental degradation, resource depletion and pollution were emerging as externalities of “mindless development” (Meadows et al 1972). The question was: Growth at what cost?
Unfortunately, HDI has not been updated to incorporate the principles underlined in the 1992 United Nations Earth Summit in Rio de Janeiro, where countries adopted the Brundtland Commission’s definition of sustainable development: “Development that meets the needs of the present generation without compromising the ability of future generations to meet their own needs” (WCED 1987). This exclusion in the HDI is reminiscent of the old principle of GDP-focused development. Ever increasing emissions and the challenges of global warming and climate change, social conflicts, gender discrimination and violence have far-reaching impacts on well-being. This necessitates the development of a more holistic measure that will encapsulate sustainability concerns along with equity and efficiency.
Munasinghe and Reid (2005) expressed the policy challenge as that of reconciling the impossible trinity of equity, efficiency and sustainability. With these considerations in mind, the international community adopted the Sustainable Development Goals (SDGs) agenda in 2015, as a successor to the Millennium Development Goals (MDGs) of 2000. The SDGs refer to the objectives of alleviating poverty and hunger, preventing violence and discrimination, mitigating threats of climate change, protecting the environment, and cooperating to carry out the common but differentiated responsibilities. By encompassing a wide array of developmental indicators, the SDGs aim to ensure that development is measured in an inclusive way to capture the aspect of space (equity) and time (sustainability). There are 17 goals with 169 well-defined targets. The goals address the issues of poverty, hunger, education, gender discrimination, sanitation and clean water, energy, employment and economic growth, innovation and infrastructure, inequalities, urban planning, waste disposal, climate change, terrestrial and aquatic life, role of institutions, and cooperation between institutions to achieve the targets under SDGs. Evidently, the multi-faceted nature of SDGs makes it a comprehensive measure of development and a marked improvement not only over HDI, but also encompassing factors which different indices of well-being have developed—i.e., Gender Inequality Index (GII), Liveability Index, Governance Index, and Index of Sustainable Economic Welfare (Daly and Cobb 1989).
As the SDGs are multi-faceted, it would require indexation of the various indicators into a single indicator (or composite index) to make such analysis meaningful. Indices provide decision-makers with an integrated and informative overview that would be otherwise difficult, if at all possible (Hammond et al. 1995; Neimeijer 2002). Indexation provides an objective mode of measuring performance and monitoring progress. The widely accepted Multi-dimensional Poverty Index and Human Development Index are a few examples of indices used to monitor progress. The objective is to move from multiple indicators to a single metric (Hajkowicz 2006). Essentially, construction of a multivariate index is based on the theoretical underpinnings of the multi-attribute utility theory. Keeney and Raiffa (1976) suggest that during certain decision analyses that require making informed choices about multiple objectives, the preferences of the decision-maker are represented numerically through utility functions such as the weighted SDG index developed in the following sections.
For India, it is important to move beyond physical and human forms of capital and include natural and social capital in the broader picture, recognising the important feedbacks between them. For example, economic modelling must depict realistic limits to the degree to which we can substitute human capital for natural capital and also account for the critical role of ecosystem services and marketed natural resources (Ayres et al. 1996). It is important to endogenise the different types of capital in economic models, and systematically induce the issue of sustainability in economic planning.
The purpose of this paper is two-fold. First, it develops the much-needed SDG index to propound a holistic measure of development across Indian states. This provides a general idea of the state-wise achievement of SDGs, and brings forth a comparative picture. Second, the paper proposes that promoting SDGs is not merely a measure confined to looking at development, but also an important instrument to reflect on business environments of the federal states. In other words, the sustainability targets are essentially business-inducing parameters that lead to policy implications at different layers of the governance structure in India. As a measure of enabling conditions for business, the Ease of Doing Business Index, developed by the Asian Competitiveness Institute, National University of Singapore, has been considered here, and the causality has been looked at. In the process, the paper also attempts to examine whether SDGs promote foreign direct investment. The latter is investigated because FDI is essentially one of the major indicators of Ease of Doing Business. Since an enabling business environment attracts FDI, this analysis considers both the causalities.
II. SDGs, Governance and Business in India
India and SDGs
The National Development Agenda of the NITI Aayog promotes a long-term vision that combines the national goals with the globally identified sustainable development goals. India has played a major role in shaping the SDGs, by internally launching various programmes to make progress towards these goals (See Table A1.2 in Appendix 1). India has also decided to anchor a global solar alliance, INSPA (International Agency for Solar Policy and Application), of countries located between the Tropic of Cancer and the Tropic of Capricorn. Being one of the volunteers to have taken up the Voluntary National Reviews (VNRs), India needs to carry out regular monitoring and assessment of the progress of SDGs. The development of an index helps the process.
State-wise schemes are not considered in this study for two reasons. First, the index is constructed primarily on the basis of uniform process and outcome indicators, and not schemes. Therefore, the outcomes of state schemes (if at all there is any outcome) are not included here. Second, central schemes apply to the entire country. Financing SDGs happens by incorporating them in the national budgeting systems, which are supposed to have indirect fall-outs on sub-national policies.
Competitive Federalism and SDGs in India
India’s progress towards the achievement of SDGs and nurturing the growth of business is subject to the type of federalism that exists in the country and its impacts on governance. In theory, a competitive economy produces outcomes that are superior and efficient; in a federal system, competition between states is likely to produce policy outcomes that will benefit the entire nation (Breton 1985). This policy, also known as Competitive Federalism, has been adopted for the achievement of the developmental goals in India, from the perspective of the states to compete efficiently amongst themselves in attracting businesses (Giap et al. 2016).
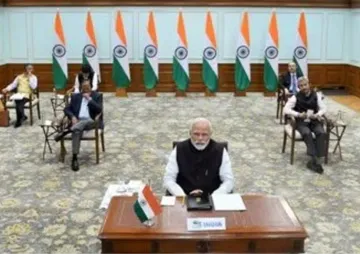
The “Make in India” initiative[2]of the government of Prime Minister Narendra Modi is guided by the principles of “competitive federalism”. Different states have also launched their own campaigns,[3]such as “Vibrant Gujarat”, “Happening Haryana”, and “Magnetic Maharashtra”. These initiatives began in December 2014, when the prime minister’s office issued a set of 98 reform measures mostly based on the 10 business topics monitored by the World Bank’s Doing Business report.[i]The list was later expanded to 340 points encompassing a Business Reform Action Plan (BRAP)[ii]for the Indian states.
The NITI Aayog later developed the SDG India Index across the Indian states (NITI Aayog 2018). As it tracks the state-wise progress on the SDGs, the index indirectly promotes competition amongst the states. The exercise, however, admits to being unable to accommodate goals 12, 13, 14, and 17 (see Figure A1.1 in Appendix 1 for SDGs). The failure of the NITI Aayog index to cover goal 13, i.e. climate action—renders the exercise incomplete. After all, development goals can get hindered by an exogenous force like climate change. NITI Aayog’s index also suffers from its assignment of equal weights to the parameters—this implies equal importance to all indicators, whereas some may be more relevant than others.
This paper argues that working on SDGs improves the input and product market conditions, in turn promoting business competitiveness. For example, SDGs 1-5 (poverty, hunger, health and well-being, education, and gender), are more related to the demographic parameters that improve the labour market conditions. At the same time, SDGs 8 and 9 (decent work and economic growth, and industry and innovation) are more concerned with output markets and innovation, SDGs 14 and 15 talk of natural capital (life on land and water, respectively) while SDG 10 and 16 (inequality, and peace and justice) reduce the possibility of social conflicts. These are the elements of physical capital, social capital, natural capital and human capital embedded in SDGs that are essential for creating a congenial business environment.
Sustainability to Drive Investment
The government has been working to improve India’s ranking in ease of doing business. ‘Make in India’, for one, aims to convert the country into a manufacturing hub. To be sure, various analysts have criticised such an export-oriented growth strategy. Former Reserve Bank of India Governor, Raghuram Rajan, for instance, has counselled “against an export led strategy that involves subsidizing exporters with cheap inputs as well as an undervalued exchange rate, simply because it is unlikely to be as effective at this juncture. I am also cautioning against picking a particular sector such as manufacturing for encouragement, simply because it has worked well for China. India is different, and developing at a different time, and we should be agnostic about what will work” (Rajan 2014).
Indeed, ‘Make in India’ falls short of establishing a holistic and long-run model of development. Although its thrust pertains to manufacturing, FDI data shows that inflows into the manufacturing sector dropped from US$ 9.6 billion in 2014-2015 to US$ 8.4 billion in 2015-2016 (Giap,et al. 2016). Most of the FDI inflows have been absorbed into the services sector. What then is missing in the national agenda to attract FDI?
The Context: SDG and Ease of Doing Business
The need for developing an SDG index is recognised globally. Bertelsmann Stiftung and the Sustainable Development Solutions Network (SDSN), for example, have developed an index and dashboard for all 17 SDGs and illustrated the performance of the 193 signatory countries (Sachs et al. 2016). This paper studies 23 Indian states in a similar vein.
This analysis is constrained by the lack of data. While some of the data sets pertain to inputs (or process data), others are representative of output (or outcome) data. It is a general practice to take proxies for data on certain variables that are not available. As such, in the absence of output data for a particular indicator, its input data has been taken as a proxy. Some data were obtained from satellite observations, and pertains to the present year such as Percentage Area of Water Body across Indian states. Similarly, for certain other variables such as Gini coefficient, the most recent data was for 2011. When available, the most recent data sets have been used for constructing the index. The data for Union Territories in case of certain policy implementations turned out to be uniform, and data across the northeastern states, barring Assam, was not available for many variables with which this exercise has been undertaken. The index has been constructed taking into account 14 out of 17 SDG goals, as not all of the 17 are relevant at the sub-national level.
The paper then examines the link between this SDG index and the state-wise rankings in the Ease of Doing Business (EDB) index. India has taken strides in recent years: it was 130thout of 190 countries in 2016; 100thin 2017 (Doing Business 2018: Reforming to Create Jobs); and 77thin 2018 (Doing Business 2019: Training for Reform). For a developing nation like India, attractiveness to business (as tracked by EDB) will serve as a boon to the economy. This paper makes the case that SDGs are a much broader concept than EDB, and improving the SDG indicators will have spillover effects on the EDB ranking as well. This is primarily because goals 8 (decent work and economic growth), 9 (industry, innovation and infrastructure) and 16 (peace, justice and strong institutions) have indicators that also capture certain elements of ease of doing business.
There are concerns regarding the EDB parameters as set by the World Bank. First, it is uncertain whether such indicators that essentially call for reducing the “transaction costs” from the governance perspective adequately capture the on-ground conditions of doing business, as has been pointed out by a recent publication by the Asia Competitiveness Institute (ACI) of the National University of Singapore (Giap et al 2015 and 2016). Second, these conditions do not adequately represent the overall business environment that will woo investors. For one, political environment too, has a bearing on the business environment (Dutt 2018).
Therefore, EDB of the World Bank definition, is still reductionist and not holistic. This position has also been taken by the ACI, which has come up with its own index on ease of doing business on the basis of three parameters: Attractiveness to Investors, Business Friendliness, and Competitiveness Policies (Giap et al 2016). These capture the ground realities of businesses and address entry, operational and exit factors that impact investment decisions. This paper, therefore, considers the ease of doing business rankings and scores calculated by the ACI to test for existing causality with the SDG index. The next causality that this paper attempts to test is whether the SDG index, developed in this paper, will increase the flow of FDI to the states. Both these causalities have been tested on the basis of simple econometric exercises.
III. Analytical Framework, Methodology and Data Sources
The Framework
The analytical framework of the entire study is based on two identities, and two equations. The first step entails developing the SDG Index across the 23 states. At the first stage, the quantified/ quantitative indicators reflecting each goal are taken, and their respective weights in the context of the concerned goal are determined by principal component analysis. For this purpose, it is first necessary to apply transformation functions to the raw data. Subsequently, weights are attached to the transformed values of each indicator. Ghosh, et al (2014) suggest using Principal Component Analysis (PCA) for weight distribution since it stands out as one of the best practices globally, to enhance statistical robustness in assigning weights. Following this method, weights are attached to different indicators without exposing them to ‘subjectivity’ and ‘sub-optimal representation’. Finally, statistically computed weights and transformed indicator values are aggregated using the additive function to obtain the index scores.
Therefore, (3) and (4) are log-linear regression equations, where this paper is primarily interested in the statistical significance in the slope coefficients,βandγ. If they turn out to be positive and statistically significant at a chosen level of significance (1 or 5 percent), it may be inferred that SDGs promote enabling business conditions, and SDGs also cause FDI inflow. Prior to performing regression analysis, Henze-Zirkler (1990) normality tests for both the dependent variables, Ease of Doing Business and Foreign Direct Investment has been conducted and both variables fulfil the necessary normality conditions. Results are summarised in Appendix 4 (Table A4.1).
Indicators
To carry out the proposed exercises, the authors considered 14 of the 17 SDGs. Three SDGs, namely, Responsible consumption and production (SDG 12), Life below water (SDG 14) and Partnership for the goals (SDG 17), were excluded: there was no data for SDG 12, and 14 and 17 are irrelevant in the context of sub-national India. For each of the 14 SDGs, 51 indicators[iv]for all the 23 states were identified, with reference to inputs from the National Indicator Framework developed by the Central Statistics Office, Ministry of Statistics and Programme Implementation.[v]The latest available data for each of the variables were chosen. The northeastern states (except Assam) were excluded from the study due to unavailability of data. The Union Territories were also not covered in the analysis as they fall under the jurisdiction of the Centre and therefore an outlier to this paper’s emphasis on competitive federalism. Table 1 summarises the chosen indicators and the sub-goals, and the sources of data.
Table: 1. Indicators of Sustainable Development Goals
Sample Registration System, Bulletin, various issues, Office of the Registrar General and Census Commissioner, India, Ministry of Home Affairs, Government of India.
Sample Registration System, Bulletin, various issues, Office of the Registrar General and Census Commissioner, India, Ministry of Home Affairs, Government of India.
4 (Quality Education)
4.a. (Complement Of) People Per Education Institute (2015 – 16)[xv]
Department of Higher Education, Ministry of Human Resource Development & District Information System for Education (DISE) National Institute for Education Planning and Administration (NUEPA).
Unified District Information System for Education. (Table 3.20. Annual Average Drop-out Rate by Educational Level: 2014-15)
4.a. Ratio of NAAC Accredited Universities (2018)[xxii]
Central Universities: UGC 29 June, 2017; State Universities: 6 Oct, 2017; Deemed Universities: 6 Oct, 2017; Private Universities: 6 Oct, 2017; NAAC Accredited Universities: State wise Number of colleges and universities accredited by NAAC, 16.8.2018.
School of Oceanographic Studies, Jadavpur University (2018).
6.4. (Complement Of) Water Withdrawal As A Percent Of Water Availability (2012)[xxix]
Q. No. 2131, Dated: 24/07/2014, Ministry of Water Resources, River Development and Ganga Rejuventation, Lok Sabha – Water Availablity & Lok Sabha Unstarred Question No. 4426, dated on 03.05.2012 – Water Withdrawal.
Statement Referred To In Reply To Part (A) To (C) Of Lok Sabha Question No. 3586 For 08.08.2017 Showing Number Of Communal Incidents, Number Of Persons Killed/Injured Therein During The Years 2014, 2015, 2016 & 2017 (Upto May).
Ministry of Home Affairs, Government of India (ON1621).
16.6. Success Rate Of Cases Disposed By Police And Courts (2016)[lix]
National Crime Report Bureau.
Removing Scale Bias, Normalisation and Complement of Negative Indicators
The data collected across 23 Indian states, owing to either the population size or geographical area in most cases, has inherent scale biases. The variables have been converted into per unit format (to remove the relevant scale bias). Further, all the data points were normalised by the following formula to range from 0 to 1 (unit free):
Meanwhile, for the negative indicators (for example, Poverty Rate), the complement of 1 for their respective normalised values has been taken, so as to convert them into a positive indicator. This has been done to form a uniform, unit and direction-free, composite SDG index.
Determination of weights by Principal Component Analysis (Two Stages)
In the first stage, calculation of weights for each indicator under a particular Sustainable Development Goal, for each of the 51 observations has been conducted by Principal Component Analysis (PCA) to rank the states under each goal (See Appendix Charts A1 – A14). This methodology has been chosen over a simple average technique to understand the dominant patterns in the dataset, in terms of weights that should be assigned to each parameter. With ‘i’ denoting SDGs, the 14 SDGs are defined by the closed set,i= [1, 14]. At the same time,k(denoting an indicator) is defined by the closed set k = [1, 51].
Now let us define the weight attached, by PCA, to an indicator ‘m’ in SDG ‘n’ aswmn wherewmn= [max{component1, comp2,……, compm}]2* explanatory power[lx]of [max{comp1, comp2,…,comp m}]. Each of the weights under a particular SDG has been scaled to sum up to 1 (100%), in order to avoid under representation. Finally, we get the state and SDG-wise indices as given in (1).
Next, we run the PCA on all 51 indicators to obtain the weights corresponding to each component indicator. While clubbing the weights associated with each SDG, it is noticed that the SDGs with a higher number of indicators had higher weights. This is logically inconsistent because the number of indicators per SDG reflects availability of data, and an SDG with a lower number of indicators is not necessarily less important. Therefore, for the second round of PCA we have computed the final index by associating 51 weights to 51 indicators individually. Let us definepmas the weight ofmth component indicator in the composite SDG index where∏m= [ max{ comp1,….., comp m}]2* explanatory power of [ max{ comp1,….., comp m}]. After finding the weights for each parameter m, we calculate the composite SDG index as defined in (2).
IV. Results and Discussion[lxi]
SDG Index Scores of Indian States
Table 2 shows the computed scores for the 23 Indian States in descending order, with 1 being the maximum score and 0, the minimum.
Table 2: SDG Index Scores and Ranks of States
Rank
States
SDG Index Score
1
Goa
0.704
2
Kerala
0.634
3
Tamil Nadu
0.614
4
Delhi
0.606
5
Himachal Pradesh
0.578
6
Telengana
0.529
7
Karnataka
0.516
8
Maharashtra
0.514
9
Uttarakhand
0.513
10
Punjab
0.504
11
Gujarat
0.488
12
Haryana
0.482
13
Andhra Pradesh
0.462
14
West Bengal
0.397
15
Jammu and Kashmir
0.395
16
Rajasthan
0.390
17
Chhattisgarh
0.371
18
Madhya Pradesh
0.353
19
Odisha
0.341
20
Assam
0.318
21
Jharkhand
0.273
22
Uttar Pradesh
0.269
23
Bihar
0.250
Source: Authors’ own.
In this context, we present the SDGs in terms of classifications delineated by the following formula. This analysis assumed the SDG index to be a sample from a symmetric distribution (normal), and classifies the states as the following:
Embryonic Stage:SIj< (μ – σ)
Waking from Slumber: (μ – σ) <SIj< (μ – 0.5 * σ)
Evolving Stage: (μ – 0.5 * σ) <SIj< μ
Progressive Systems: μ <SIj< (μ + 0.5 * σ)
Advanced Stage: (μ + 0.5 * σ) <SIj< (μ + σ)
Top Performers: (μ + σ) <SIj
where,
μis the mean of theSIscores across the states;
σis the standard deviation of theSIscores across the states.
Figure 1: Classification of Indian States on the basis of SDG index
Regression Results
The regressions given in (3) and (4) were run. The summarised estimates of (3) are given as (3a), while those of (4) are given as (4a).
The figures in the parentheses reflect on the p-values associated with the coefficients. (See Appendix 4 for the detailed output from STATA 12.)
The first observation, according to equation (3a), is that a state’s performance in achieving SDGs (as measured by the SDG index) positively contributes to ease of doing business in that state, as given by the positive sign of the slope coefficient (0.801). At the same time, the slope coefficient is statistically significant at 1% level.[4]Second, (4a) suggests that SDG performance has a statistically significant (at 1% level) and positive impact on per-capita FDI. Equation (4a) is more robust (has higher explanatory power) than (3a), as reflected by theR2(0.616) and the adjustedR2(0.597) values.
The relevance of this correlation to policy is that India’s provincial governments must place greater emphasis on achieving the SDGs to enhance their capacity to attract foreign direct investment. The SDG index, as used in this analysis, will not only act as a signal for businesses to put their money into specific states, but also for the states and the Centre to introspect their relative development trajectories in terms of an all-encompassing variable that reflects much more than mere economic growth.
A caveat is in order: While this exercise speaks of causation, it does not imply a one-to-one correspondence between SDG performance and EDB. Nor does the exercise suggest that the states making the best progress towards the SDGs will necessarily be those that are highest in EDB ranking (see Table A3.1 in Appendix 3 for the Ease of Doing Business 2016 Index Scores). Rather, what the authors are offering isindicative evidencethat the achievement of SDGs can create enabling conditions for business. To check for this hypothesis, the authors have created classifications of EDB rankings on the basis of the following exercise, and created the SDG-EDB matrix for the 23 Indian states covered in this analysis.
Stage 1:EDBi< mean (EDBi) – sd (EDBi)
Stage 2: mean (EDBi) – sd (EDBi) <EDBi< mean (EDBi) – {0.5 * sd(EDBi)}
Stage 3: mean (EDBi) – {0.5 * sd(EDBi)} <EDBi< mean (EDBi)
Stage 4: mean (EDBi) <EDBi< mean (EDBi) + {0.5 * sd(EDBi)}
Stage 5: mean (EDBi) + {0.5 * sd(EDBi)} <EDBi< mean (EDBi) – sd (EDBi)
Stage 6:EDBi> mean (EDBi) + sd (EDBi)
Where mean (EDBi) refers to the mean value of the EDB index, and sd (EDBi) refers to the standard deviation of the EDB index.
The matrix is given in Table 3.
Table 3: The EDB-SDG matrix
Source: Authors’ own.
The matrix shows that the states of Uttar Pradesh and Assam are the worst performing states while Delhi is the best performing state in terms of both EDB and SDG. Bihar and Jharkhand are a shade higher in EDB due to better conditions with business, but are in the same classification in the SDGs. Again, while Kerala’s SDG performance is good, the state is not as exemplary in business. It is noteworthy that out of the 23 states studied for this paper, in not one is there a case of negative correlation between the two variables. Rather, there is some form of clusterisation of the states around the 45-degree line showing a positive relation between the two variable classifications.
Although SDGs improve input and product market conditions, it can happen only in the long run. In the short term, reforms in laws and regulations, financing, incentives and promotion, and better infrastructure facilities attract investment and improve EDB. However, better SDGs improve living condition and bring demand stability in the economy through sustainable development—reflected among others in better labour market conditions, reduction of poverty, and improvement in health and education.
V Conclusion
This paper set out to not only develop a framework for an SDG index for India’s states, but also to present a measure that reflects the business environments in those states. A well-developed index is needed to replace the commonly followed ‘Ease of Doing Business’ index developed by the World Bank, for two reasons: the EDB index does not consider the ground-level efficacy of the reforms; and the SDG index developed in this analysis is more holistic and gives due importance to the different variables that matter more in the context of nurturing the enabling conditions for business.
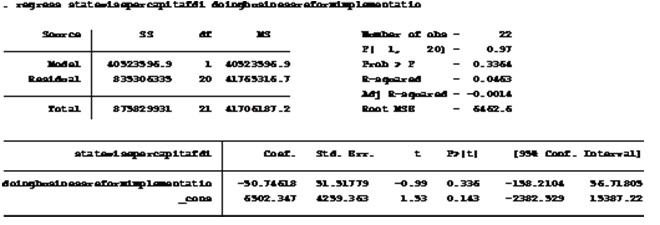
The exercise also shows that, controlling for the population factor,[lxii]FDI flows to the states that perform better on the SDGs. India’s state governments should therefore work harder on the attainment of the SDGs to become more business competitive. At the same time, although the government is trying to implement state-level reforms on the basis of the World Bank-DIPP Doing Business report recommendations, an econometric analysis with state-level data shows that the DIPP’s ‘ease of doing business’ is not a statistically significant variable affecting foreign direct investment in the 23 states studied in this paper (see Table A4.3 in Appendix 4).
The results of this analysis areindicativeand not more, due to constraints in data. Methodological improvements with non-linearity assumptions will have to be made in extensions of this work. Furthermore, a better hypothesis is to test changes in Ease of Doing Business rankings, or FDI inflow, as a function of better, or otherwise poor performance on the SDG index over a reasonable time frame. Given that this is a baseline study, a similar SDG index for a different time period is not available. In the next phase of research, such causality can be tested. As it is now, the index indicates directions and provides an objective instrument of decision-making. It creates a framework for creating similar measures of well-being that attempt to reconcile the trinity of equity, efficiency, and sustainability—which may yet be today’s biggest policy challenge of the developing world.
This exercise has three policy implications. First, it has developed a growth measure that is more holistic than those that dominate India’s policy thinking. The current model of growth that informs the country’s policymaking has already been proven to have immense negative social and environmental externalities that carry long-term costs that impede sustainable development. The SDG index attempts to correct that by accommodating social, natural, and human capital, and the preparations of the economies under consideration to absorb or adapt to possible shocks. Second, this research has implications for the ‘Make in India’ initiative, as well as the principle of ‘competitive federalism’ that the government aims to promote. From the ‘Make in India’ perspective, it needs to be remembered that the causation of FDI flows has been tracked to the SDG index developed in this analysis, rather than the World Bank DIPP Ease of Doing Business index. This gives the states an instrument to consider.
This paper does not suggest that the reforms outlined by the World Bank should not be undertaken. They may still help create the basis for better business environments. The results of this analysis indicate that BRAP implementation might not always reflect the ground reality, thereby vindicating the criticisms of Giap et al (2016). Concentrating on the SDG index may lead to better business environments. Third, this exercise has created a business case for the global sustainable development goals. Given the arguments presented in this paper on the importance of the SDG index, a state’s development policy should not be conceived of as divorced from the investment promotion strategy.
References
Acemoglu, D. and James Robinson.Why Nations Fail- The Origins Of Power, Prosperity, and Poverty. London: Profile Books, 2012.
Ayres, Robert, Beatriz Castaneda, Cutler J Cleveland, Robert Costanza, Herman Daly, Carl Folke, Bruce Hannon, et al. “Natural Capital, Human-made Capital, Economic Growth and Sustainability.”Boston University(1996): 15-16.
Ayub, Mahmood. “Poverty and Inequality.”Global Journal of Emerging Market Economies, SAGE Publications(2013): 329-346.
Banik, Nilanjan, and C. A. Yoonus. “Trade as an answer to Sustainable Economic Growth- The ECOWAS Story.”Global Business Review, SAGE Publications(2012): 311-326.
Besley, T., and T. Persson.Pillars of Prosperity. Princeton University Press, 2011.
Bhamra, Anshul, Harshini Shanker and Zeenat Niazi.“Achieving the Sustainable Development Goals in India – A Study of Financial Requirements and Gaps.”Technology and Action for Rural Development(2015): 189 – 192.
Breton, A. “Supplementary Statement” in Royal Commission on the Economic Union and Development Prospects for Canada (MacDonald Commission), Report 3, 1985.
Chichilnisky, Graciela. “An Axiomatic Approach to Sustainable Development.”Social Choice and Welfare(1996): 231-257.
Daly, H and J. Cobb. “For the common good: Redirecting the economy toward community, the environment, and a sustainable future.”Boston: Beacon Press(1989).
Ghosh, Nilanjan. “Ecological Economics: Sustainability, Markets, and Global Change.” InGlobal Change, Ecosystems, Sustainability: Theory, Methods, Practice, edited by Pranab Mukhopadhyay, Nandan Nawn and Kalyan Das, Sage Publishers, 2017.
Ghosh, Nilanjan, Neha Sinha and Siddhant Jhunjhunwala. “Indexing Covariation in Base-Metals Prices.”The Journal of Index Investing(2014): 87 – 93.
Giap, Tan Khee, and Karthik Rao.“Sub-national competitiveness analysis and simulation studies for 35 states and union territories of India.”International Journal Indian Culture and Business Management 10, no. 4(2015).
Giap, Tan Khee, Sasidaran Gopalan, Anuja Tandon, and Tan Kong Yam.2016 Annual Competitiveness and Growth Slowdown Analysis for Sub-National Economies of India. Asia Competitiveness Institute, National University of Singapore, 2016.
Giap, Tan Khee, Sasidaran Gopalan, Jigyasa Sharma and Tan Kong Yam.Inaugural 2016 Ease of Doing Business Index on Attractiveness to Investors, Business Friendliness and Competitive Policies (EDB Index ABC) for 21 Sub-National Economies of India. Asia Competitiveness Institute, National University of Singapore, 2016.
Government of India.SDG India Index Baseline Report 2018. New Delhi: NITI AAYOG, 2018.
Hajkowicz, S. “Multi-attributed environmental index construction”.Ecological Economics57, no. 1 (2006): 122-139.
Hammond, A., A. Adriaanse, E. Rodenburg, D. Bryant and R. Woodward.Environmental Indicators: A Systematic Approach to Measuring and Reporting on Environmental Policy Performance in the Context of Sustainable Development.Washington DC: World Resources Institute, 1995.
Haq, M. “Employment and Income Distribution in the 1970s: A New Perspective.”Development Digest9, no. 4 (1971): 3–8.
Henze, N. and B. Zirkler. “A class of invariant consistent tests for multivariate normality.”Communication in Statistics – Theory and Methods19, no. 10 (1990): 3595-3617.
Keeney, R. L. and H. Raiffa.Decisions with multiple objectives: Preferences and value tradeoffs.New York: Cambridge University Press, 1976.
Kemp, Rene, Saaed Parto and Robert B. Gibson. “Governance for sustainable development: moving from theory to practice.”International Journal of Sustainable Development(2005).
Kuhn, T.S.The Structure of Scientific Revolutions (2nd edition). Chicago: Chicago University Press, 1970.
LaPorta, R., F. Lopez-de-Silanes, A. Shleifer and R. Vishny. “The Quality of Government.”Journal of Law, Economics and Organisation 15, no. 1(1999): 222-279.
Lewis, W. A. ”A Review of Economic Development.”American Economic Review 55, no. 2(1965): 1–16.
Meadows, D.H., D.L. Meadows, J. Randers and W.W. Behrens.The Limits to Growth: A Report of the Club of Rome’s project on the Predicament of Mankind. New York: Universe Books, 1972.
Ministry of Environment, Forests and Climate Change, Government of India. “India’s Intended Nationally Determined Contribution is Balanced and Comprehensive.”Press Information Bureau, 2015.
Munasinghe, M. and W. Reid. “The Role of Ecosystems in Sustainable Development.” InBiodiversity and Quality of Life,edited by N. Sengupta and J. Bandyopadhyay. New Delhi: Macmillan, 2005.
Mundle, Sudipto, Pinaki Chakraborty, Samik Chowdhury, & Satadru Sikdar. “The Quality of Governance- How Have Indian States Performed?”Economic and Political Weekly 47, no. 49(2012).
Myrdal, G.Economic Theory and Underdeveloped Regions. London: University Paperbacks, Methuen, 1957.
Niemeijer, D. “Developing indicators for environmental policy: data-driven and theory-driven approaches examined by example.”Environmental Science and Policy(2002).
Porter, M. E., Mercedes Delgado, Christian Ketels and Scott Stern. “Moving to a New Global Competitiveness Index.”World Economic Forum, Geneva(2008): 43 – 59.
Ricardo, D.The Principles of Political Economy and Taxation. Cambridge: Cambridge University Press, 1821.
Robbins, Lionel.An Essay on the Nature and Significance of Economic Science. Macmillan, 1932.
Sachs, J., G. Schmidt-Traub, C. Kroll, D. Durand-Delacre and K. Teksoz. SDG INDEX & DASHBOARDS: A Global Report. New York: Bertelsmann Stiftung and Sustainable Development Solutions Network (SDSN), 2016.
Schultz, T.W.The Economic Value of Education. New York: Columbia University Press, 1963.
Schultz, T.W.Investment in Human Capital: Role of Education and Research. New York: Free Press, 1971.
Schumacher, E. F.Small is Beautiful: Economics as if People Mattered. New York: Harper and Row, 1973.
Schumpeter, J.A.The Theory of Economic Development. Cambridge, MA: Harvard University Press, 1911.
Seers, D. “The Meaning of Development.”International Development Review11, no. 4 (1969): 2– 6.
Singer, H. W. “Social Development: Key Growth Factor.”International Development Review7, no. 1 (1965): 3–8.
Smith, Adam.An Inquiry into the Nature and Causes of the Wealth of Nations,edited by Edwin Cannan. London: Methuen, 1904.
Stiglitz, Joseph. “Towards a New Paradigm for Development .” 9th Raul Prebisch Lecture,UNCTAD, 1998.
Stojanovic, Ilija, Jovo Ateljevic and R. Stevan Stevic. “Good Governance as a Tool for Sustainable Development.”European Journal of Sustainable Development(2016): 558-573.
United Nations General Assembly.Transforming our world: the 2030 Agenda for Sustainable Development. United Nations, 2015.
Venkatachalam, K.S. “The ‘Ease of Doing Business’ in India.”The Diplomat,November 9, 2017.
Watts, Ronald L. “Origins of Cooperative and Competitive Federalism.” InTerritory, Democracy and Justice: Regionalism and Federalism in Western Democracies, edited by Scott L. Greer, 201-224. New York: Palgrave MacMillan, 2006.
World Bank.Doing Business 2018: Reforming to Create Jobs. Washington, DC, 2018.
World Bank.Doing Business 2019: Training for Reform. Washington, DC, 2019.
World Commission on Environment and Development.Our Common Future. Oxford: Oxford University Press, 1987.
Yusuf, Shahid and Joseph E. Stiglitz. “Development Issues: Settled and Open.” InFrontiers of Development Economics: The Future in Perspective, edited by Gerald Meier and Jospeh Stiglitz, 227-269. Oxford University Press, 2001.
APPENDIX 1: Sustainable Development Goals 2015 and related Government initiatives
The 17 goals enumerated in Agenda 2030 are depicted in the figure below.
Figure A1.1 United Nations Sustainable Development Goals
APPENDIX 2: State wise performances of various SDGs
Chart A1. SDG 1 Index Scores
Chart A2. SDG 2 Index Scores
Chart A3. SDG 3 Index Scores
Chart A4. SDG 4 Index Scores
Chart A5. SDG 5 Index Scores
Chart A6. SDG 6 Index Scores
Chart A7. SDG 7 Index Scores
Chart A8. SDG 8 Index Scores
Chart A9. SDG 9 Index Scores
Chart A10. SDG 10 Index Scores
Chart A11. SDG 11 Index Scores
Chart A12. SDG 13 Index Scores
Chart A13. SDG 15 Index Scores
Chart A14. SDG 16 Index Scores
APPENDIX 3: EDB Index Scores of Indian States
Table A3.1. Ease of Doing Business 2016 Index Scores
The scores are normalised to range from 0 to 1. Scores for Jammu & Kashmir and Rajasthan are not available.
RANK
STATES
EASE OF DOING BUSINESS 2016 INDEX
1
Maharashtra
1.000
2
Gujarat
0.798
3
Delhi
0.772
4
Goa
0.688
5
Andhra Pradesh
0.649
6
Tamil Nadu
0.602
7
Karnataka
0.576
8
Madhya Pradesh
0.567
9
Himachal Pradesh
0.556
10
Telengana
0.519
11
Punjab
0.495
12
West Bengal
0.462
13
Chhattisgarh
0.453
14
Odisha
0.453
15
Kerala
0.429
16
Haryana
0.359
17
Jharkhand
0.313
18
Uttarakhand
0.287
19
Bihar
0.278
20
Assam
0.224
21
Uttar Pradesh
0.000
(Source:Inaugural 2016 Ease of Doing Business Index on Attractiveness to Investors, Business Friendliness and Competitive Policies (EDB Index ABC) for 21 Sub-National Economies of India,Asia Competitiveness Institute, National University of Singapore, 2016)
Table A3.2. State-wise per capita FDI figures
Authors’ calculations using FDI, Gross Capital Formation and population figures for Indian states.
RANK
STATES
STATEWISE PER CAPITA FDI
1
Delhi
29405.34
2
Karnataka
9057.06
3
Maharashtra
7115.90
4
Tamil Nadu
3032.76
5
Gujarat
2226.45
6
Goa
1915.61
7
Telangana
1107.46
8
Andhra Pradesh
491.93
9
Kerala
400.72
10
Uttarakhand
176.10
11
Haryana
175.31
12
West Bengal
150.09
13
Rajasthan
109.69
14
Odisha
98.97
15
Punjab
74.01
16
Himachal Pradesh
62.92
17
Chhattisgarh
35.05
18
Assam
25.76
19
Uttar Pradesh
20.04
20
Jharkhand
17.50
21
Madhya Pradesh
12.60
22
Bihar
0.61
*Data for J&K is unavailable
Figures in Rupees.
(Source: RBI Handbook of Indian Statistics; Ministry of Commerce and Industry, Government of India; Annual Survey of Industries, Ministry of Statistics and Programme Implementation, Government of India and Census 2011)
APPENDIX 4: Regression Results from STATA 12
Table A4.1 Normality test of Ease of Doing Business Scores and FDI per capita
Table A4.2. Regression of Ease-of-Doing-Business Index on SDG Index
Table A4.3. Regression of FDI per capita on SDG Index
Table A4.4. Regression of FDI per capita on DIPP Ease-of-Doing-Business Scores
(The authors would like to thank the two anonymous reviewers for their valuable comments on this paper. They also thank Mr. Sayanangshu Modak, Research Assistant, ORF Kolkata, for designing the Map of India in Figure 1.)
Endnotes
[1]HDI was developed in 1990 by Amartya Sen, Mahbubul Haq, Gustav Ranis and Meghnad Desai, as a somewhat rough measure of development. The HDI measures life expectancy, literacy, education, and standard of living for countries worldwide. Though a “vulgar measure”, as described by Sen because of its limitations, HDI provides an indicative measure of the quality of life.
[2]This initiative was launched by the Prime Minister of India in September 2014 as a part of a broader goal to transform India into a global manufacturing and design hub, covering 25 economic sectors in the country.
[3]Business promotion campaigns at the state level that entailed business reform measures.
[4]The probability of observing this value ‘by chance’ is less than 0.01.
[i]This initiative by the World Bank since 2003, analyses business regulation and their implications for establishing and operating firms in 190 economies across the world.
[ii]In 2015, the Department of Industrial Policy and Promotion (DIPP), Ministry of Commerce and Industry, Government of India had circulated to all the Indian states and Union territories, a 340 point Business Reform Action Plan (BRAP) with an objective to increase transparency and efficiency of different Government regulatory functions and services for businesses to flourish in India.
[iii]FDI is expressed in million Rupees at Annual Survey of Industries (ASI), Ministry of Statistics and Programme Implementation, Government of India (2017 – 18). The FDI inflow via the New Delhi Office is taken to be that of NCR and the FDI for Uttar Pradesh and Haryana has been calculated from the regional offices at Kanpur and Chandigarh respectively for their close proximity. The regional office wise FDI data has been broken down to the state level by statewise division in accordance to the ratio of Gross Capital Formation (2015 – 16) (Reserve Bank of India Handbook) of the respective states under the jurisdiction of each RBI regional office. The data for Jammu & Kashmir has not been taken into consideration because of unavailability of data. These figures are converted into per capita values.
[iv]Principal Component Analysis is conducted on 51 component indicators. However, many of these component indicators are constructed using more than one indicator. For example, Infrastructure Index under SDG 9 is computed with seven parameters: per capita availability of power, length of roads, length of state highways, length of national highways, length of railway routes, power requirement and installed capacity of power, where each of the seven parameters are assigned weights using PCA. Approximately a total of 76 parameters have been used to compute the 51 component indicators.
[v]Indicators have been chosen from the ‘Sustainable Development Goals (SDGs)- National Indicator Framework’ document of the SDG unit of the Social Statistics Division (SSD) of MoSPI, CSO (2016).
[vi]Originally expressed as the state-wise percentage of population Below Poverty Line (BPL) (Based on Tendulkar Methodology). The values have been normalized to range from 0 to 1. The normalised values have been subtracted from 1 to convert into its complement. In 2011, Telengana was still a part of Andhra Pradesh and so the literacy rate of Telengana (missing in the original dataset) is taken as the same as that of Andhra Pradesh.
[vii]Originally expressed in persondays generated in lakhs. It has been converted to persondays and then divided by the individual population sizes (as per census 2011) to get the per capita value. The values have been normalized to range from 0 to 1. The missing data for Delhi have been substituted by 0 on assumption of negligible value.
[viii]Originally expressed in terms of percentage (converted to decimal) of underweight children below 5 years of age, the values have been normalized to range from 0 to 1. The normalised values have been subtracted from 1 to convert into its complement. In 2013, Telengana was still a part of Andhra Pradesh and so the value of Telengana (missing in the original dataset) is taken as the same as that of Andhra Pradesh.
[ix]Originally the total production was expressed in thousand tonnes. It has been converted to tonnes and then divided by the individual population sizes (as per census 2011) to get the per capita value. The values have been normalized to range from 0 to 1.
[x]The data is originally expressed in absolute values of number of ration shops. We have divided the ration card holders of each state by the number of ration shops in the corresponding states. This gives us the number of persons catered to by each ration shop. Subsequently we have normalised the data to range from 0 to 1. The normalised values have been subtracted from 1 to convert into its complement.
[xi]Originally expressed as the rate of suicide incidence (converted into decimal), the values have been normalized to range from 0 to 1. The normalised values have been subtracted from 1 to convert into its complement.
[xii]Originally expressed figures are in average of years. The values have been normalized to range from 0 to 1. In 2011, Telengana was still a part of Andhra Pradesh and so the value of Telengana (missing in the original dataset) is taken as the same as that of Andhra Pradesh. The value for Goa (missing in the original dataset) is substituted by the average of the values of the states of Karnataka and Maharashtra (the two states with which Goa shares its border).
[xiii]Originally expressed as the maternal mortality rate, the values have been normalized to range from 0 to 1. The normalised values have been subtracted from 1 to convert into its complement. In 2011, Telengana was still a part of Andhra Pradesh and so the value of Telengana (missing in the original dataset) is taken as the same as that of Andhra Pradesh. The missing value for Goa is substituted by the ‘South Sub Total’ value; and the missing values for Delhi, Himachal Pradesh and Jammu and Kashmir are substituted by the ‘EAG and Assam’ value.
[xiv]Originally expressed as number per 1000, the values have been normalized to range from 0 to 1. The normalised values have been subtracted from 1 to convert into its complement.
[xv]Original figures are in absolute number of educational institutions which is used to divide the total population (as per Census 2011) in order to get the number of people that each institution caters to. The values have been normalized to range from 0 to 1. The normalised values have been subtracted from 1 to convert into its complement.
[xvi]The literacy rates relate to sample population aged 7 years and above. Originally expressed as percentage (converted to decimal), the values have been normalized to range from 0 to 1. In 2011, Telengana was still a part of Andhra Pradesh and so the literacy rate of Telengana (missing in the original dataset) is taken as the same as that of Andhra Pradesh.
[xvii]Original figures were expressed as a ratio. We have used the total Gross Enrolment figures for each state and then normalised these values to range from 0 to 1.
[xviii]Original figures were expressed as a ratio. The original data set consisted of individual values for Boys and Girls. A simple average of the data has been taken. We have then normalised these values to range from 0 to 1.
[xix]Original figures were expressed as a ratio. We have used the total Gross Enrolment figures for each state and then normalised these values to range from 0 to 1.
[xx]Original figures were expressed in number of students per teacher. The average of the values for Primary, Upper Primary, Secondary and Higher Secondary were taken. The values have been normalized to range from 0 to 1. The normalised values have been subtracted from 1 to convert into its complement.
[xxi]Original figures were expressed in percentage. The average of the values for Upper Primary and Secondary were taken. The values have been normalized to range from 0 to 1. The normalised values have been subtracted from 1 to convert into its complement.
[xxii]The total number of NAAC accredited universities in each state has been divided by the total number of universities (sum total of Central Universities, State Universities, Deemed Universities and Private Universities for each state has been taken) to get a ratio. This ratio indicates the number of universities in each state that have successfully met the different NAAC criteria. We have then normalised these values to range from 0 to 1.
[xxiii]Originally expressed figures are in percentage of total workforce. The values have been normalized to range from 0 to 1. In 2011, Telengana was still a part of Andhra Pradesh and so the value of Telengana (missing in the original dataset) is taken as the same as that of Andhra Pradesh.
[xxiv]Originally expressed figures are crime rate calculated as crime per one lakh of population. The values have been normalized to range from 0 to 1. The normalised values have been subtracted from 1 to convert into its complement.
[xxv]Originally calculated as the ratio of women MLAs to the total seats in Legislative Assembly.
[xxvi]Originally expressed as composite water index score, the values have been normalized to range from 0 to 1. The missing value of Delhi is substituted by the average values of its neighbouring states, that is Haryana and Uttar Pradesh. The missing value of West Bengal is substituted by the average of its neighbouring states – Odisha, Jharkhand, Bihar, Sikkim, Assam. The missing value of Jammu and Kashmir is substituted by the average values of its neighbouring states, that is Himachal Pradesh and Punjab.
[xxvii]The Composite Water Management Index (CWMI) uses data collected at central and state level from 2016 – 2018. The findings show that the water scarce states (Gujarat performs best) perform much better in terms of the CWMI than the relatively water abundant states (Meghalaya performs worst).
[xxviii]In order to capture the total water availability in a state we have used the total area under water bodies as a proxy. These figures were originally in hectares which have been converted into sq. metres and then the per capita values have been calculated (as per Census 2011). This data set has then been normalised to range from 0 to 1.
[xxix]Individual data for Ground Water Availability and Ground Water Withdrawal have been obtained from the mentioned sources. Water withdrawal as a percentage of water availability for each state has been calculated from the given data sets. These figure have then been normalised to range from 0 to 1. Andhra Pradesh has been used a proxy for Telengana. The normalised values have been subtracted from 1 to convert into its complement.
[xxx]Originally expressed as a percentage (converted to decimal), the values have been normalized to range from 0 to 1. The data for Delhi is substituted by the value of Puducherry (the only Union Territory data available).
[xxxi]This data contains the total installed capacity of grid interactive renewable energy power in MW. The sources of renewable energy include small hydro power, solar power, bio power and wind power. It has been converted to KW and then divided by the individual population sizes (as per census 2011) to get the per capita values. The values have been normalized to range from 0 to 1.
[xxxii]Original figures were expressed in absolute numbers. We have calculated the number of connections issues per BPL household. Missing values of Telengana has been replaced by Andhra Pradesh. Finally the data has been normalised to range from 0 to 1.
[xxxiii]Expressed in number of beneficiaries. Since Assam figure includes Meghalaya, Nagaland, Tripura and Sikkim, we have equally divided the Assam figure in five to get the value for Assam. The value for Andhra Pradesh is equally divided with Telengana on account of Telengana still being a part of Andhra Pradesh in early 2014. These values are then taken as a ratio of the total populations (as per Census 2011) in each state and then normalized to range from 0 to 1.
[xxxiv]Originally expressed as state-wise unemployment rate (per 1000) for persons above 18 years of age (18-29 age group and above 30 age group) according to Usual Principal and Subsidiary Status Approach (PS+SS). The values have been normalized to range from 0 to 1. The normalised values have been subtracted from 1 to convert into its complement.
[xxxv]These values were originally expressed as a percentage. These values have subsequently been normalised to range from 0 to 1.
[xxxvi]The original figures are in Rupees per day. They have been normalised to range from 0 to 1. Rates for unskilled workers in Assam and West Bengal exclude Tea garden workers.
[xxxvii]The ratio of the number of active companies to the number of registered companies have been computed and then the values have been normalized to range from 0 to 1.
[xxxviii]This index has been developed by taking into account seven parameters as identified by the RBI in their Handbook of Indian Statistics, 2016-2017. The seven parameters are: per capita availability of power, length of roads, length of state highways, length of national highways, length of railway routes, power requirement and installed capacity of power. We have divided the data for length of road, state highways, national highways and railway route (all in kms.) by the geographical areas (2011) of the respective states. The data for requirement of power, installed power capacity (in Million Units Net and Mega Watt respectively) have been divided by the population of the corresponding states (as per Census 2011). In certain cases the data were missing. For length of state highways, the missing value for Delhi have been taken as 0 as the length of highways is considered negligible. Finally, the values have been normalized to range from 0 to 1. This exercise has been done to facilitate the development of a Composite Infrastructure Index. The final index has been arrived at by applying weights to each of the seven parameters computed by Principal Component Analysis.
[xxxix]Gross State Value Added by Economic Activity. The figures are in lakhs of Rupees. For West Bengal, the missing value has been obtained from the bureau of Applied Economics and Statistics, Department of Statistics and Programme Implementation, Government of West Bengal. These values have then been divided by the total population of each state (as per Census 2011) and then normalised to range between 0 to 1.
[xl]Gross State Value Added by Economic Activity. The figures are in lakhs of Rupees. For West Bengal, the missing value has been obtained from the bureau of Applied Economics and Statistics, Department of Statistics and Programme Implementation, Government of West Bengal. These values have been divided by the population of each state (as per Census 2011) and then normalised to range between 0 and 1.
[xli]Expressed in lakhs of Rupees, base year 2011-12, factor cost at constant prices. The values are normalized to range between 0 to 1. For West Bengal (missing in the original dataset), the 2014-15 value is fetched from NITI Aayog – Per Capita NSDP at Constant Prices (2004-05).
[xlii]Original dataset have used Mixed Reference Period (MRP) method of calculating the Gini Coefficient. There were separate data for Urban and Rural areas in each state. For convenience we have taken a simple average of the two. The figures are unit free and range between 0 and 1. The values have been subtracted from 1 to convert into its complement. In 2009, Telengana was still a part of Andhra Pradesh and so the value of Telengana (missing in the original dataset) is taken as the same as that of Andhra Pradesh.
[xliii]Original figures were expressed as rate of cognizable crimes. We have normalised these values to range from 0 to 1. The normalised values have been subtracted from 1 to convert into its complement.
[xliv]Original values were expressed as the CRISIL inclusix score ranging between 0 and 100. A score of 100 implies the ideal situation of financial inclusion. These values have been normalised to range from 0 to 1.
[xlv]Originally expressed figures are in percentage of total urban population. The values have been normalized to range from 0 to 1. The rate for Andhra Pradesh has been used for Telengana. The normalised values have been subtracted from 1 to convert into its complement.
[xlvi]Original figures were expressed in percentage. These values have been normalised to range from 0 to 1.
[xlvii]Original figures were expressed in percentage. Missing values for Delhi has been replaced by the average of Uttar Pradesh and Haryana and Goa has been replaced the average of Karnataka and Maharashtra. These values have then been normalised to range from 0 to 1.
[xlviii]Original figures are expressed as percentage of waste processed. We have normalised this data to range from 0 to 1.
[xlix]The original values for Sulphur Dioxide, Nitrogen Dioxide and PM10 are expressed in microgram per cubic metre. The average value for these three components are taken and normalized to range between 0 to 1. The normalised values have been subtracted from 1 to convert into its complement. Missing values for Haryana have been substituted by that of Delhi due to their close proximity.
[l]Original figures were expressed in Megawatts. We have converted them to watt (1 MW= 1000000W). The resulting data has been divided by the population (as per Census 2011) to obtain per capita values. Finally, we have normalised the dataset to range from 0 to 1.
[li]Originally expressed in thousand tonnes (sum of Above Ground Biomass, Below Ground Biomass, Soil Organic Carbon, Deadwood and Litter), converted to tonnes and then taken as a ratio of the state wise geographical area (2011). The absolute carbon stock value of erstwhile Andhra Pradesh has been divided between Telengana and present Andhra Pradesh.
[lii]Originally expressed as percentage (converted to decimal) of the total geographic area, the values have been normalized to range from 0 to 1.
[liii]Originally expressed as percentage. The waterbody data has been extracted using the Landsat TM 30m images and SRTM 1arc second (approx. 30 m.). Therefore the minimum mappable area should be 3 x 3 (90m x 90m) pixels, approximately 100 meters x 100 meters, which is ~ one hectare. Anything smaller than that could not be considered as water body within this process. The Survey of India boundary was considered as the limit of the shoreline. Therefore coastal water bodies are also included in the process of area computations. The values have been normalized to range from 0 to 1.
[liv]Geographic Information Systems (GIS) Data has been used here.
[lv]Originally expressed as Development Adjusted Governance Index normalized to range from 0 to 1. In 2011, Telengana was still a part of Andhra Pradesh and so the value of Telengana (missing in the original dataset) is taken as the same as that of Andhra Pradesh. The missing value of Delhi is substituted by the average values of its neighbouring states, that is Haryana and Uttar Pradesh. The missing value of Goa is substituted by the average values of its neighbouring states, that is Maharashtra and Karnataka. The missing value of Jammu and Kashmir is substituted by the average values of its neighbouring states, that is Himachal Pradesh and Punjab.
[lvi]The Governance index is based on the three pillars of a Government, that is, the legislature, judiciary and the executive across five dimensions: infrastructure services; social services; fiscal performance; justice, law & order and quality of the legislature. The index shows that when the effect of development is corrected for, the poorer states perform much better than what their governance performance would be expected at their level of development.
[lvii]Originally expressed as number of incidents. It has been taken as a ratio of the total population of the states (from Census 2011). To reduce decimal places we have multiplied the values by 1000000. The values have been normalized to range from 0 to 1. The normalised values have been subtracted from 1 to convert into its complement.
[lviii]Originally expressed as state-wise rate of cognizable crimes (Sec 302 IPC) amounting to murder. The values have been normalized to range from 0 to 1. The normalised values have been subtracted from 1 to convert into its complement.
[lix]Original figures were expressed as percentage of cases pending in each state, by the Police and Courts. In order to calculate the success rate of the same we have subtracted them from 100. Following this exercise we have taken a simple average of the success rate of cases disposed by both police and courts in each state. The average figures have then been normalised to range from 0 to 1.
[lx]It refers to the proportion of the component with the highest value identified.
[lxi]All computations have been performed on Stata 12.0.
[lxii]Dividing the FDI values by the population sizes (per capita values) to omit scale biases.
The views expressed above belong to the author(s). ORF research and analyses now available on Telegram! Click here to access our curated content — blogs, longforms and interviews.
Dr. Nilanjan Ghosh is a Director at the Observer Research Foundation (ORF), India. In that capacity, he heads two centres at the Foundation, namely, the ...
Roshan Saha was a Junior Fellow at Observer Research Foundation Kolkata under the Economy and Growth programme. His primary interest is in international and development ...
Soumya Bhowmick is an Associate Fellow at the Centre for New Economic Diplomacy at the Observer Research Foundation. His research focuses on sustainable development and ...

 PDF Download


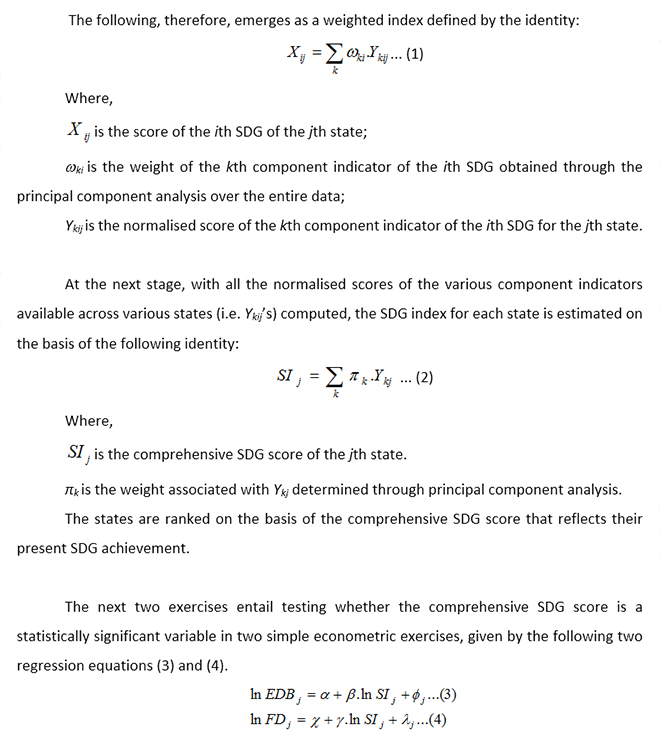
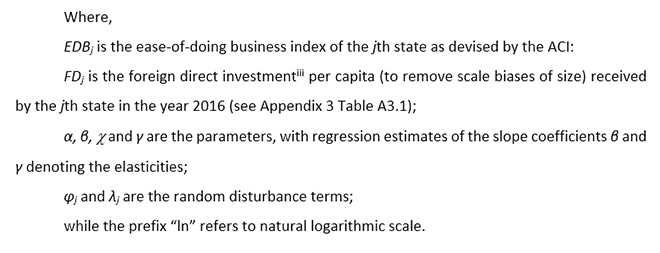
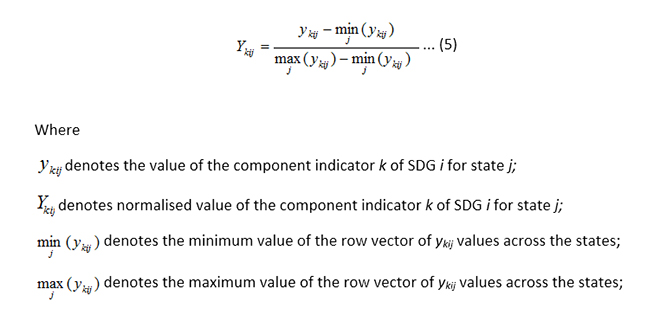
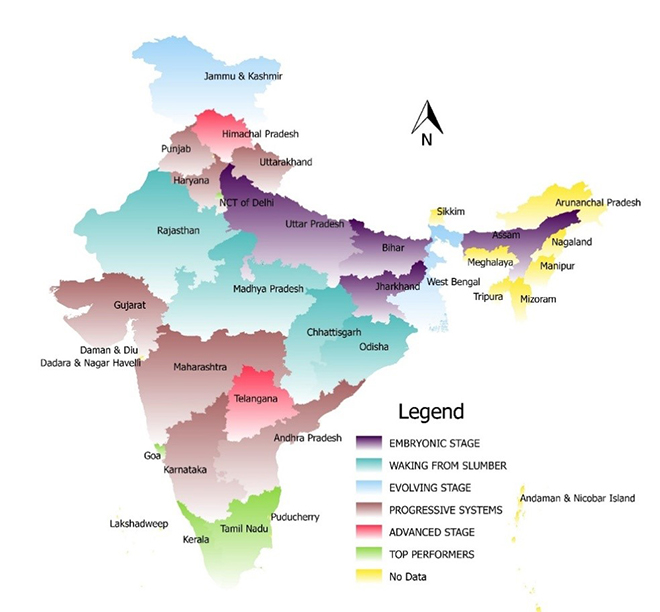
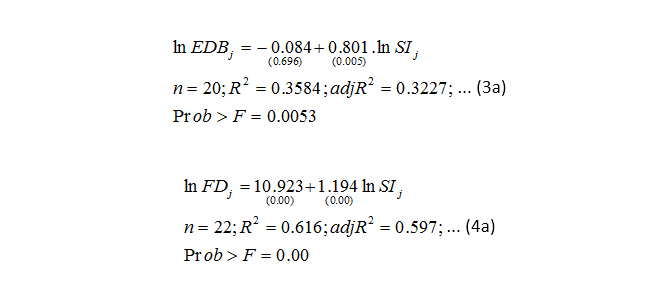
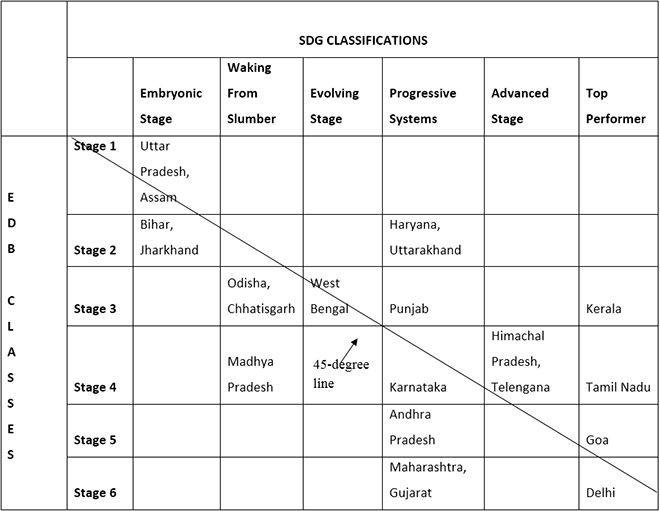
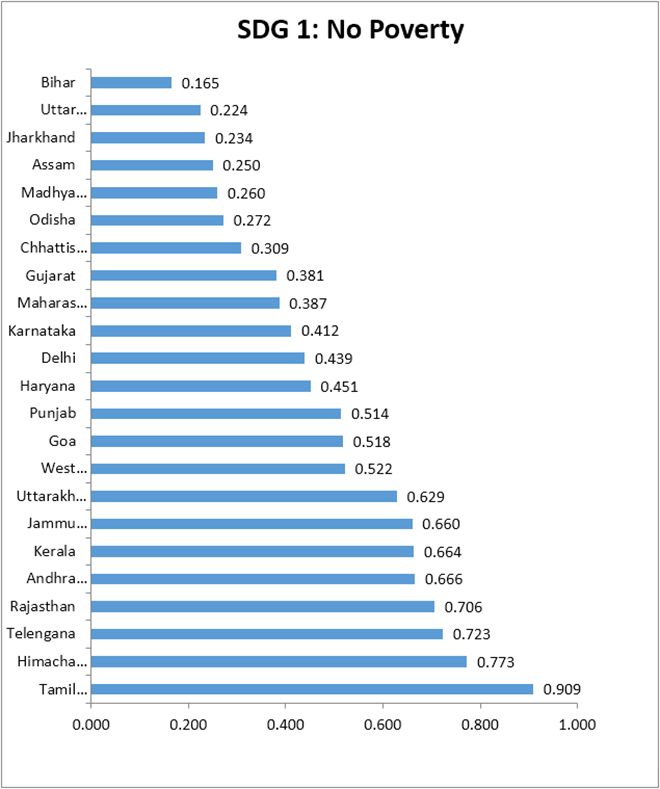 Chart A2. SDG 2 Index Scores
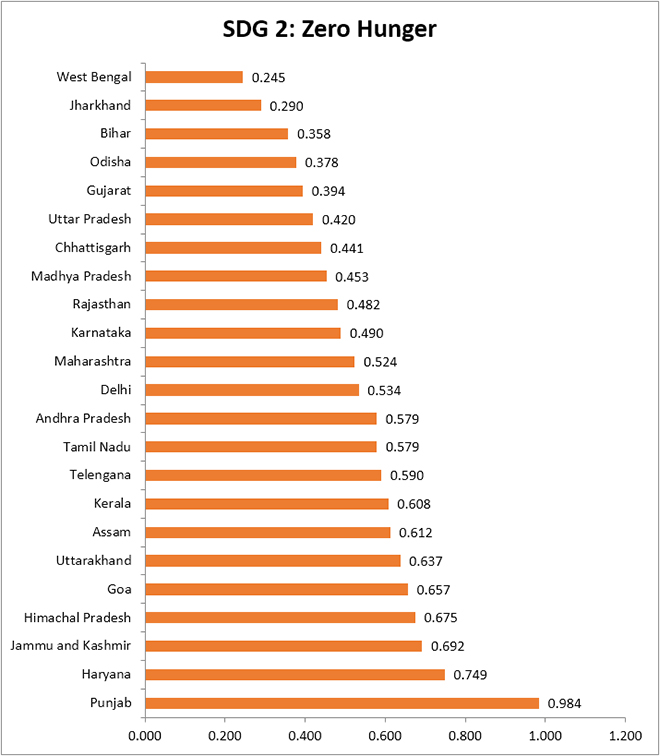 Chart A3. SDG 3 Index Scores
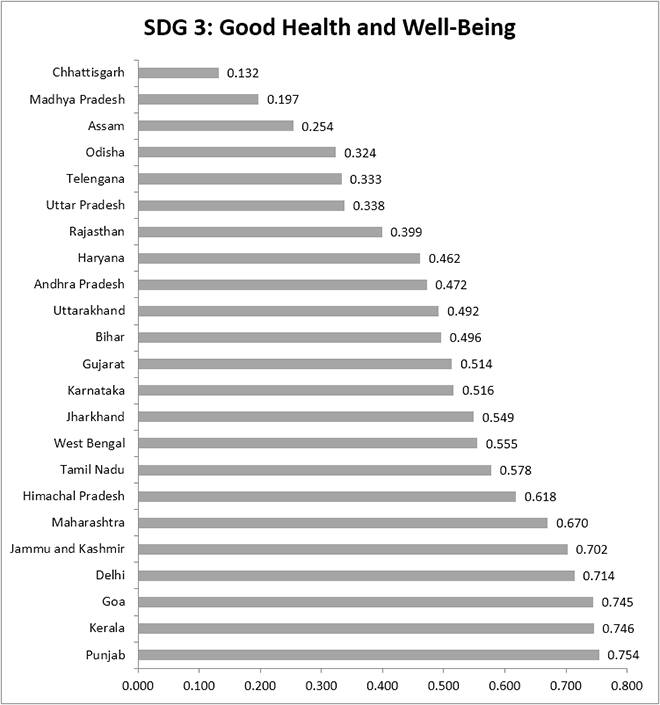
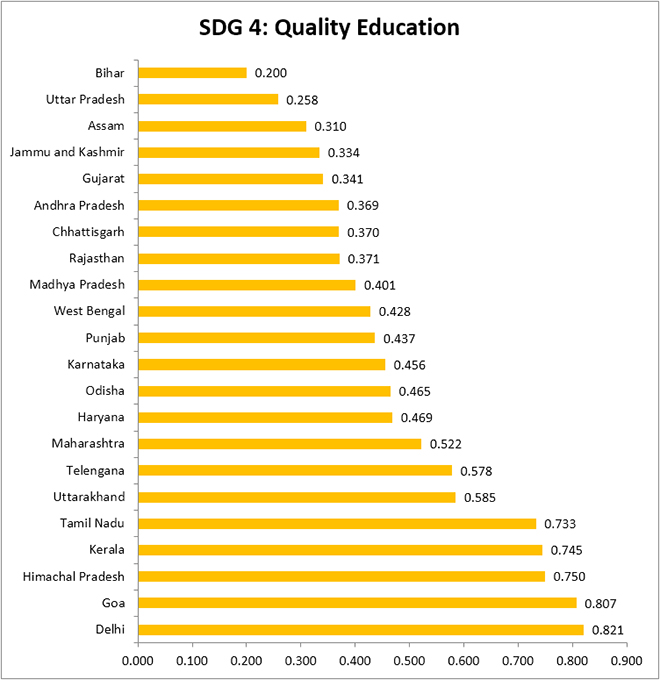
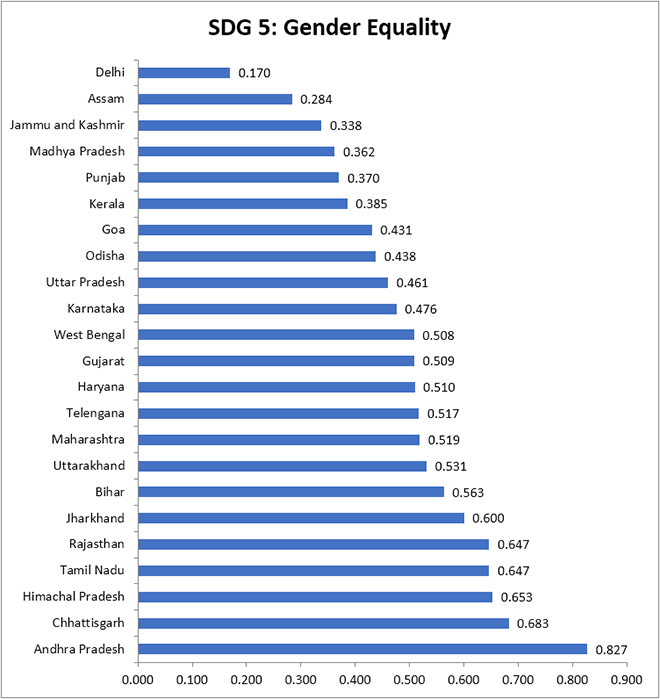
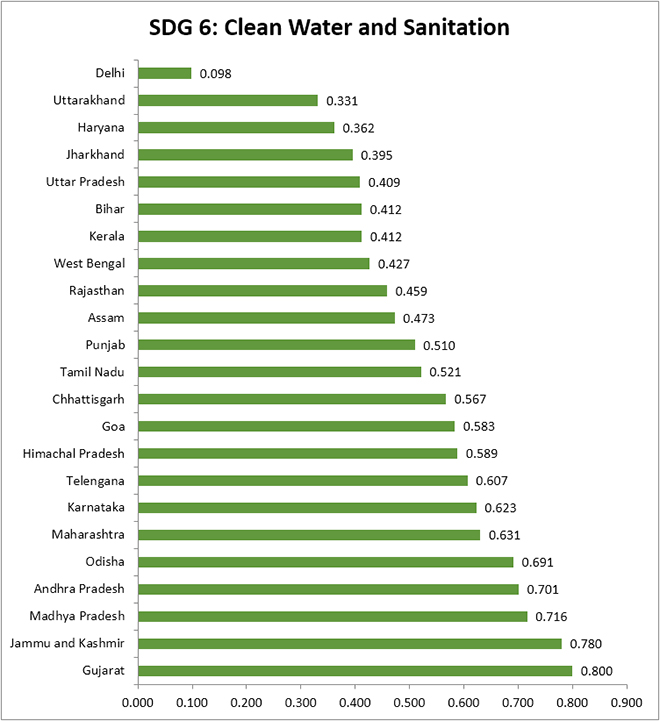
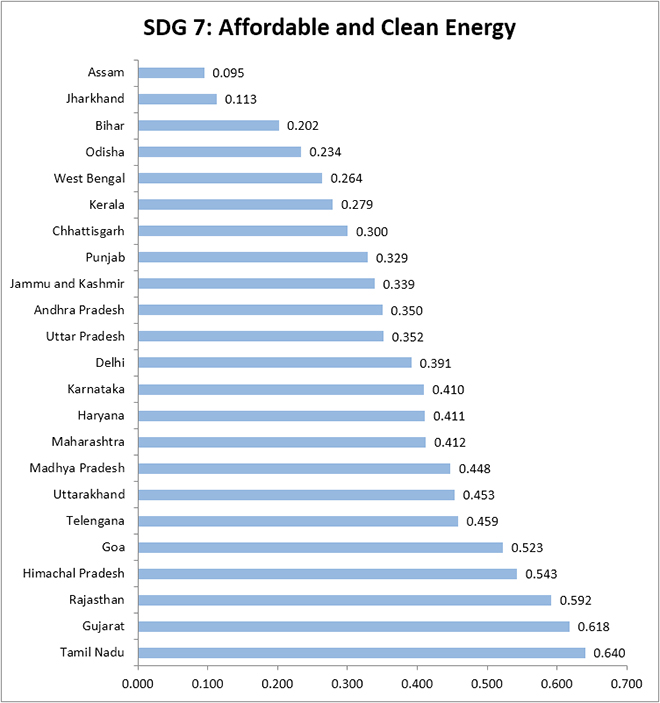
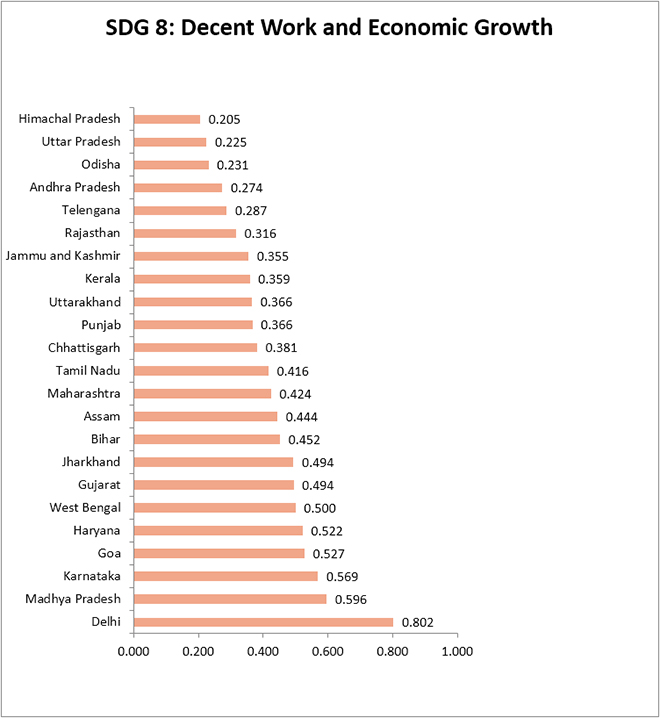
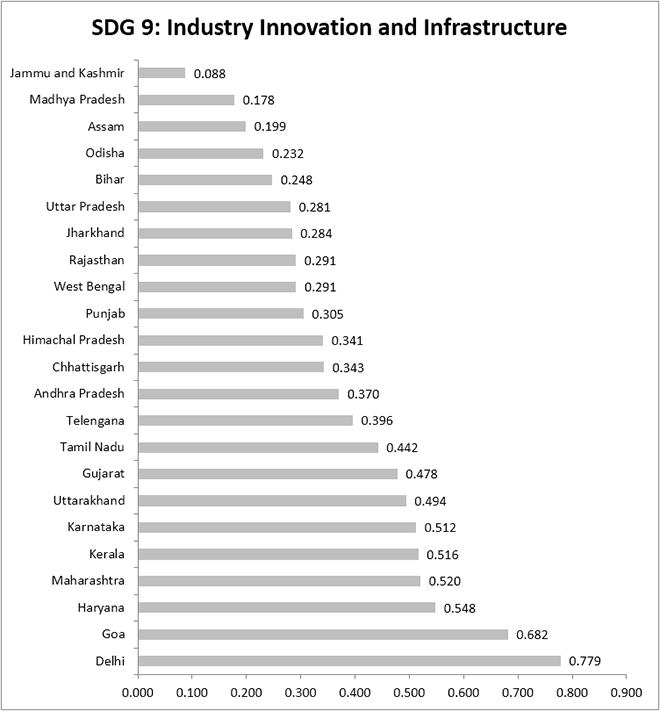
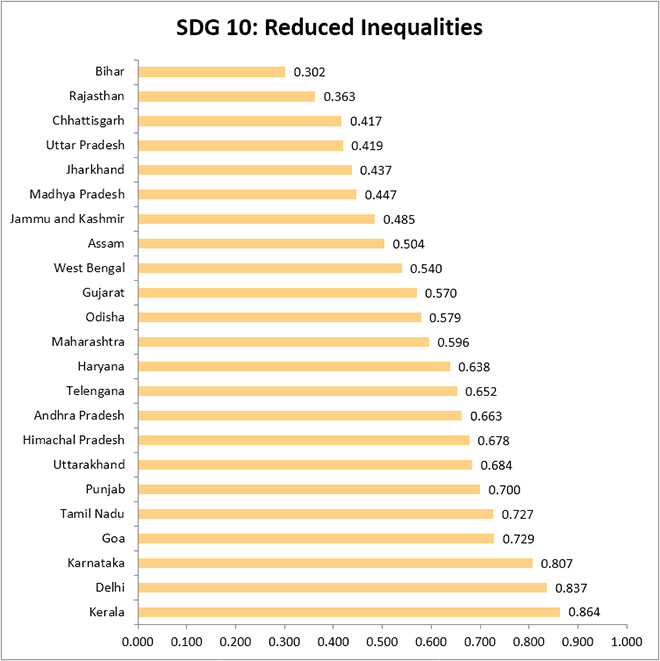
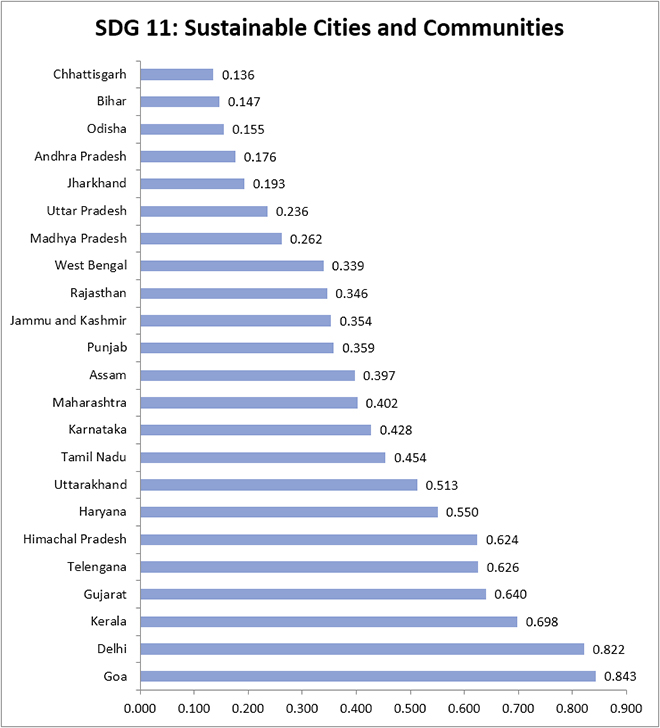
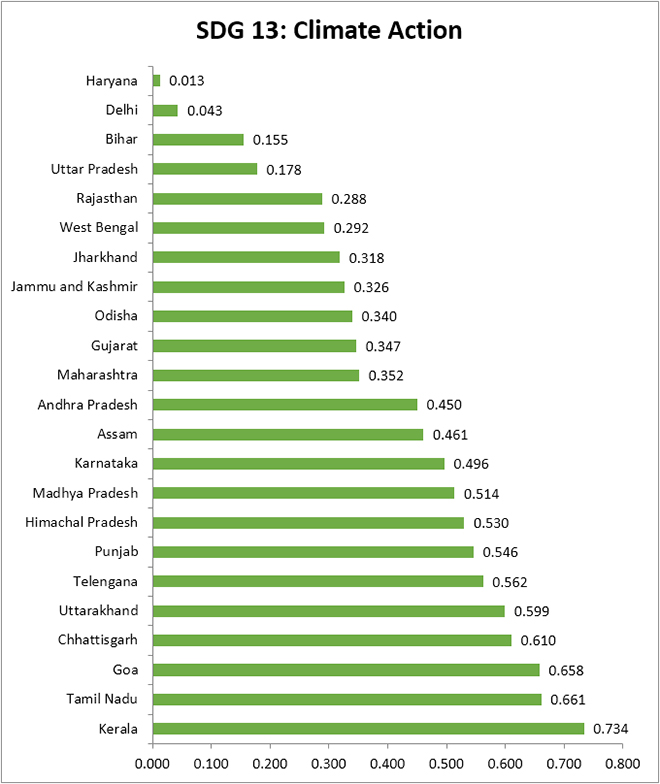
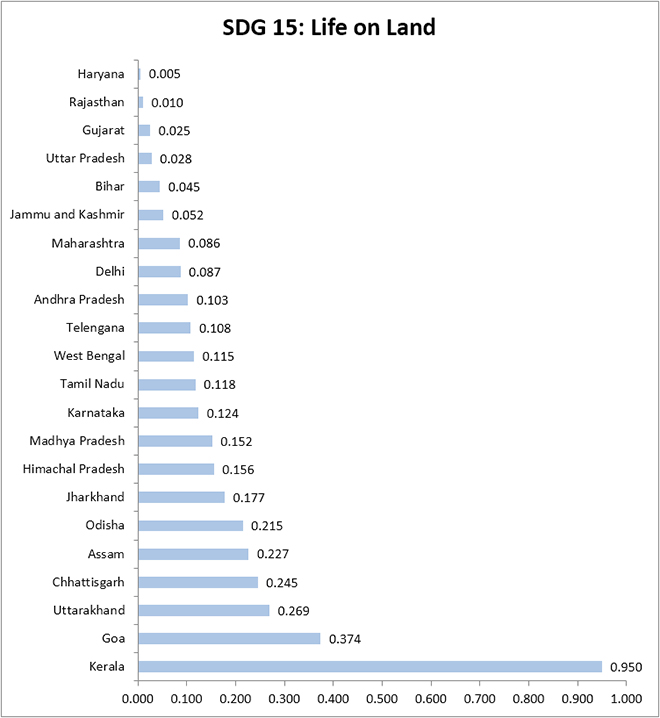
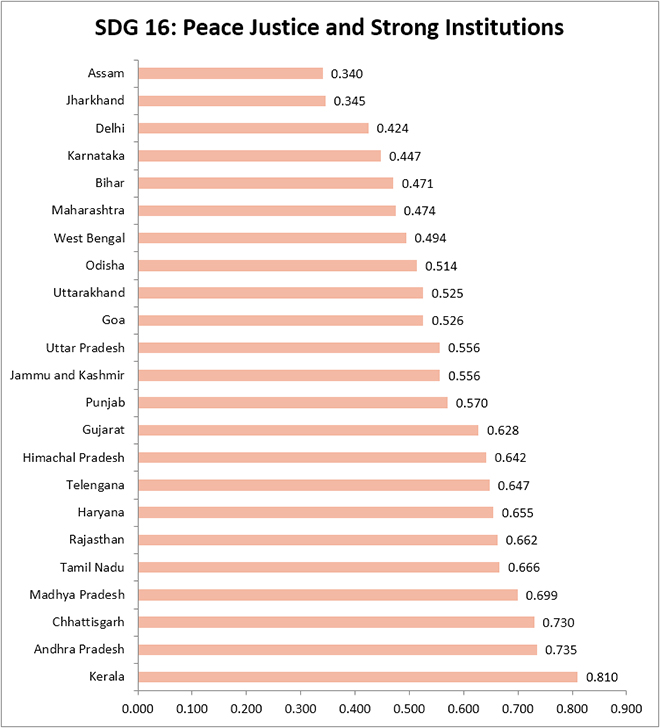
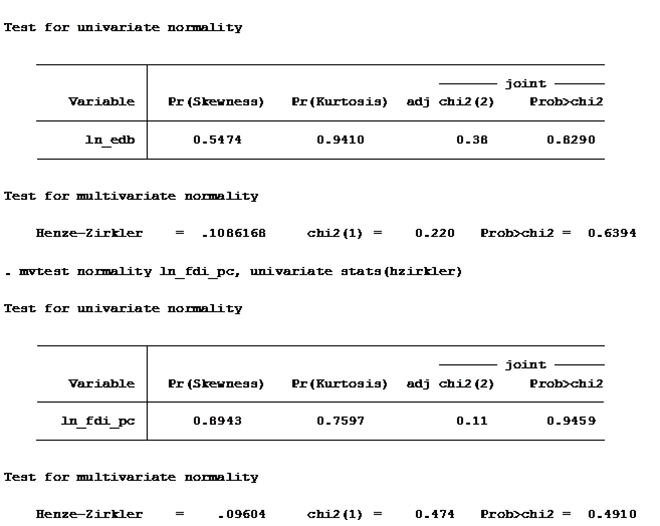
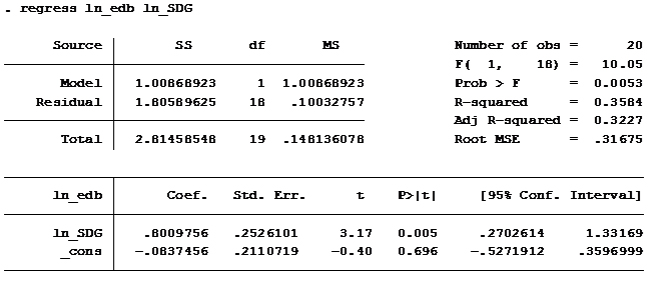
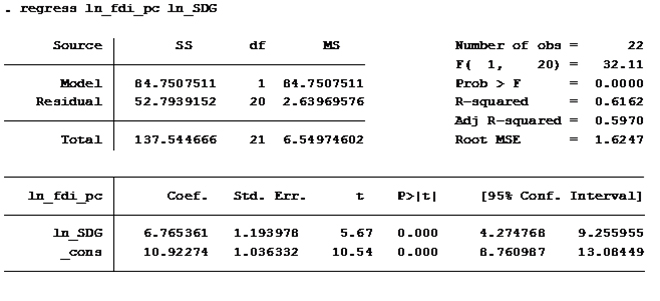 Table A4.4. Regression of FDI per capita on DIPP Ease-of-Doing-Business Scores