-
CENTRES
Progammes & Centres
Location
 PDF Download
Attribution: Preeti Kapuria and Roshan Saha, “Resource Use Efficiency and Productivity: An Analysis of India’s Food Grain Sector”, ORF Occasional Paper No. 229, January 2020, Observer Research Foundation.
I. Introduction
Food security in India has historically been identified with food grain security.[1] At present, the country’s rates of food grain availability are worrisome: at 487 grams per person per day, the rate has only slightly increased over the past 50 years. (It was 468.7 grams per person per day in 1961.)[2]
The Food and Agriculture Organisation (FAO) defines ‘food security’ thus: “all people, at all times, have physical, social and economic access to sufficient, safe and nutritious food that meets their dietary needs and food preferences for an active and healthy life”.[3] This definition encompasses four broad dimensions of food security: availability, accessibility, utilisation and stability. [4],[a] These goals are echoed in both the Millennium Development Goals (MDGs) (2000) and the more recent Sustainable Development Goals (SDGs) (2015). They emphasise on an individual’s right to dignity, freedom, equality, and a basic standard of living that includes freedom from hunger. India has set its own objectives for achieving food security, given the continuing significant rates of malnutrition reported in the various National Family Health Surveys (NFHS), and the country’s commitments to international agreements.[b]
To begin with, India has enshrined the “right to food” as a pillar to the right to life as provided in Article 21 of the Constitution. The National Food Security Act (NFSA) of 2013 entitles citizens (as identified under GoI guidelines mentioned in sub-section (I) of section 10 of the Act) to subsidised food grains.[c],[5] While food grains alone cannot ensure the nutritional component of food security, it remains an integral part of the NFSA. Wheat and paddy, the two major staples across the country, are the cheapest sources of energy and protein for the poorest populations.[6]
Deriving from the essence of food security as stated in the NFSA, food security cannot be confined to mere availability of food grains but to the overall availability of nutrition-rich fruits and vegetables, fish, meat and dairy products.[7] Indeed, in recent years, dietary patterns have changed towards more high-value horticulture, livestock and dairy products. Analysts suggest that this change in food preferences can be attributed to the increase in per capita income, urbanisation, convergence of food habits, and easier availability of these products.[8]
In a report by NITI Aayog (2018) on supply and demand projections for the agriculture and allied sector, the demand for food grains in India is expected to increase by seven percent from 255 million tonnes in 2016-17 to 272 million tonnes by 2020-21.[d],[9] Similar demand figures for non-food grains[e] indicate an expected increase of 19 percent from 521.4 million tonnes in 2016-17 to 622.6 million tonnes in 2020-21.[10] Moreover, as observed by Kumar, Joshi and Mittal (2016), there is a diversification of demand in both rural and urban areas; a decline in the consumption of cereals and pulses, and at the same time an increase in the share of horticulture, livestock and dairy products.[11] The consumption expenditure figures provided by NSSO (68th Round) also suggest that with increase in incomes, food preferences are shifting to higher income-elastic food items in both rural and urban areas, though the relative change is more in urban areas. Following this significant shift in the consumption away from staple grains towards high-value products, and an increasing burden of malnutrition,[12] food security in India must be defined in terms of these non-food grains as well.
It is in this context that it becomes important to examine the productivity of the country’s food grains production systems. Some of the food grains are an important component in ensuring availability of these high-value products—such as milk and meat—as animal feed. Moreover, land and water, the main inputs of agriculture production, are stagnating and scarce resources, increasing production of the non-food grain sector can be achieved only through higher productivity per unit of arable land, irrigation water and other inputs in foodgrains.[f], [13], [14]
This paper offers an analysis of productivity and water use efficiency of the food grain sector. This has implications for resource use efficiency, creation of jobs, welfare and generation of income for the farming community. The paper focuses on the post-reform period from 1996-97 to 2015-16.[g],[h]
Swaminathan and Bhavani (2013) suggest that factor productivity will have to be doubled, if the cost of production is to be reduced and the prices of farm products are to be made competitive and farming remunerative.[15] This is also a key component in the government’s policy of Doubling Farmers’ Income by 2020.[16] Chand et al., (2012) explain that factor productivity growth has led to a reduction in the real cost of production by 1.0–2.3 percent annually in the case of cereals. This is crucial for the welfare of both farmers and consumers as it has helped in keeping the prices of cereals low for consumers and providing benefits to producers through a decline in the real cost of production. The Committee on Doubling Farmers’ Income has identified enhancing agricultural productivity and improvement in total factor productivity of agriculture as some of its key strategies. Improving farm production and productivity as a single development strategy can make the greatest contribution to the elimination of hunger and poverty; after all, farmers constitute the largest proportion of consumers.[17]
II. DEMAND AND SUPPLY OF FOOD: CURRENT STATE AND FUTURE PROJECTIONS
Population trends show that India will emerge as the most populous country in the world in the coming decades.[18] Moreover, increasing urbanisation, coupled with rising incomes, will lead to a shift in household consumption patterns in both rural and urban areas.[19]
Data shows that expenditure on cereals has declined across both rural and urban areas between 2004-05 and 2011-12 (See Table 1). At the same time, expenditure on high-value products has increased in both urban and rural areas. It is noteworthy that the increase in expenditure on these commodities has been higher in urban areas, showing the effect of income on the diversification of food demand.
Table 1. Household Consumption Expenditure
(Rupees per capita per month)
| Item-wise expenditure | ||||
| Rural | Urban | |||
| Item group | 2004-05 | 2011-12 | 2004-05 | 2011-12 |
| cereals | 31.5 | 26.5 | 31.4 | 29.2 |
| grams | 0.2 | 0.4 | 0.3 | 0.4 |
| cereal substitutes | 0.2 | 0.2 | 0.0 | 0.4 |
| pulses & products | 5.4 | 6.8 | 6.5 | 8.4 |
| milk & products | 14.9 | 20.1 | 24.6 | 31.2 |
| edible oil | 8.1 | 8.4 | 10.9 | 10.8 |
| egg, fish & meat | 5.8 | 7.9 | 8.4 | 11.2 |
| vegetables | 10.7 | 10.6 | 14.0 | 13.6 |
| fruits & nuts | 3.3 | 4.2 | 6.8 | 9.2 |
| sugar | 4.2 | 4.0 | 4.7 | 4.8 |
| salt & spices | 4.4 | 5.3 | 5.3 | 6.8 |
| beverages etc. | 7.9 | 12.8 | 19.3 | 28.4 |
| food total | 96.3 | 107.2 | 132.3 | 154.2 |
| non-food total | 78.8 | 113.3 | 179.0 | 246.3 |
Source: Authors’ own[i]
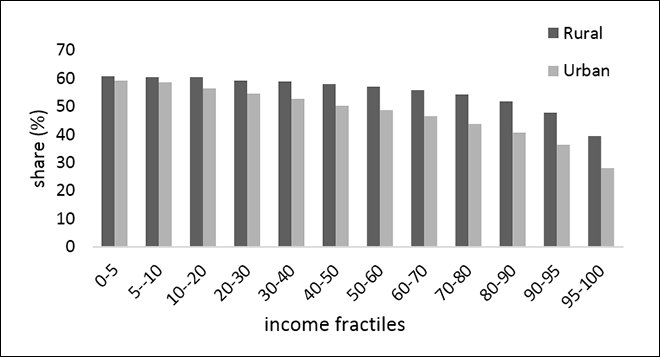
This shift in consumption patterns is proof of Engel’s law, which states that a rise in income brings about a decline in the consumption of staple food items. Engel (1857) had stated that “the poorer a family, the greater the proportion of its total expenditure that must be devoted to the provision of food.”[20] Monthly Per Capita Expenditure (MPCE) is observed to be higher in urban areas as compared to rural areas.[j],[21] Following these estimates, the level of income (expenditure is used as proxy for income) in rural areas is lower than that in urban areas. Expenditure on food accounted for 55 percent of MPCE in 2004-05 in rural areas, and for urban areas, around 43 percent. In 2011-12, the share of food in MPCE of rural areas declined to 49 percent, which was still higher than 39 percent for urban areas. (See Figure 1)
Figure 1. Share of food in MPCE (MMRP) across income fractiles (%)[22]
Although NSSO (68th Round) figures suggest a decline in per capita consumption in cereals across both rural and urban areas, demand projections presented in the report prepared by NITI Aayog (2018) show an increase in the total demand for cereals and pulses. This increase is attributed to population growth, increase in demand for seed, animal feed and industrial use. [23],[24] Mittal (2008) considers demand and supply projections to be important indicators of the country’s food security concerns.[25] Further, the behavioristic approach adopted by NITI Aayog (2018) suggests that the aggregate demand for food grains is projected to increase in the baseline scenario from 242 million tonnes in 2011-12 to 271 million tonnes by the end of 2020-21 and 326 million tonnes by the end of 2032-33.[k],[l],[26] Aggregate demand of wheat would come closer to that of rice because of increased demand of wheat as feed for animal use. The report projects that the aggregate demand for these two cereals is expected to exceed 100 million tonnes each by the end of 2032-33. Meanwhile, aggregate demand for coarse cereals is also expected to increase from 38 million tonnes in 2011-12 to around 62 million tonnes in 2032-33. Similarly, aggregate demand for pulses is expected to increase from 20 million tonnes to 37 million tonnes. Lastly, the oilseeds demand (excluding palm oil) would increase at a much faster rate as compared to food grains demand and could increase from 34 million tonnes to 113 million tonnes by 2032-33.[m]
The demand for horticultural products including fruits and vegetables is expected to increase from 128 million tonnes in the base year of 2011-12 to around 190 million tonnes by 2020-21, and further to 327 million tonnes by 2032-33. The aggregate demand for milk and milk products can reach 300-355 million tonnes in 2032-33 while meat and meat products can rise up to 37-45 million tonnes. Whereas the aggregate demand for fruits and vegetables could also be as high as 580 million tonnes.[27] Burgeoning demand for both food and high-value products warrants a look into the supply of these commodities.
There is an increase in the production figures of food grains from 180 million tonnes to 252 million tonnes between 1995-96 to 2014-15.[28] Projections of supply beyond 2015 by the NITI Aayog indicate that production of food grains is likely to increase in the coming years, from above 275 million tonnes in 2016-17 to 289 million tonnes by the end of 2020-21 and 343 million tonnes by the end of 2032-33.[29] The biggest increase is likely to come from wheat and rice, and there will be a slight increase in coarse grains and pulses. Similarly, oilseeds production is expected to increase from 34.2 million tonnes in 2016 to 48.5 million tonnes by 2032. The most significant change will occur in horticulture, where fruits and vegetables production is expected to increase from 98.5 and 177.4 million tonnes in 2016 to more than 200 and 350 million tonnes by 2032, respectively.
Overall, the supply and demand for the Indian economy appears encouraging for the entire food grain sector. The situation becomes more nuanced, however, when figures for cereals, coarse cereals and pulses are separately considered. In the case of cereals such as rice and wheat, domestic production is expected to be adequate to meet the total demand in the country. The scenario is not as optimistic with pulses, demand for which will increase over the next few years as they are relatively more income elastic when compared to the other food grains.[n] The supply of pulses is projected to fall short. Coarse cereals production is likely to be sufficient to meet its demand in near future, but minor deficits could be expected in 2028-29, 2029-30 and 2030-32.
Indeed, the importance of food grains in the average Indian diet cannot be overemphasised.[30] At the same time, people are also moving towards consuming horticulture, livestock and dairy products, and the production of these commodities will have to keep pace with the rising demand. It will do India well to pay greater attention to increasing the productivity of food grains in order to meet the rising consumption demand of the non-food grain sector.
III. PRODUCTIVITY: CONCEPTS AND MEASUREMENT
Productivity and efficiency are closely related but different concepts. ‘Efficiency’ refers to how close a production unit is to the best possible frontier of production; ‘productivity’ is a measure of the output per unit of input in the system.[31] Productivity can also be understood as one of the indicators of a sector’s competitiveness—higher productivity implies better competitiveness. Indeed, higher productivity enhances the performance of a system, either in terms of higher profitability, lower production costs, or marketing capacities. These factors are pivotal in ensuring competitiveness of the sector. Examining agricultural trade in the Mediterranean basin, Lachaal (2001) considered various parameters of competitiveness and identified productivity as one of the major domestic factors.[32]
There are two most commonly used measures of productivity: partial (single) factor productivity and total (multi-factor) factor productivity (TFP).[33] The former refers to the measure of produced output per unit of each input, such as output per man hours and output per kg. Since production processes usually entail the use of more than one input, partial factor productivity measures might lead to specious results. Moreover, when factor proportions change, it could lead to misinterpretation of the contribution of each factor to the total output.[34] TFP indices capture the effects of improved infrastructure such as irrigation, roads and electricity, as well as technology in the form of research and development. Higher TFP would imply a shift in the production possibilities frontier of the agricultural sector away from the origin, leading to higher output from the application of technology and better utilisation of resources.[35] TFP tries to address this issue by decomposing changes in production due to variations in quantity of inputs used and in the residual factors (research, education, extension, resource quality, and infrastructure). A holistic measure of productivity is TFP growth or multi-factor productivity (MFP) – a measure that considers several inputs used in the production process.[36]
Where TFP growth can be explained as:[37]
TFP Growth = Output growth – Input growth
= Technical/Technological change/Progress
= Embodied (or endogenous) technical change + Disembodied (exogenous) technical change
= Changes in technical efficiency + technological progress
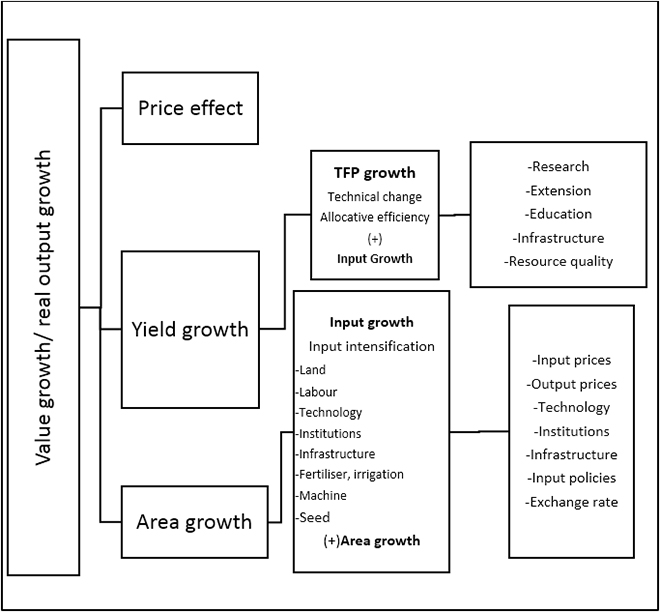
Productivity growth is essential for efficient growth of an industry or sector. Scarcity of resources is a major factor limiting economic growth, and therefore, output expansion through increased use of scare resources alone might not be sustainable.[38] In the context of the agriculture sector, productivity would pertain to factors such as availability of water, seeds, fertilisers, labour, irrigation, credit and machinery, and their contribution to the total output being produced. Works of Schultz (1953), Solow (1957), and Griliches (1963) set the precedent for analysing agricultural productivity at various levels of segregation.[39], [40], [41] Figure 2 lays out the decomposition of output growth in the agriculture sector. Here, growth in agricultural output can be explained in terms of yield, area and price components. In India until the 1960s, growth in land was the main source of output growth; with technological changes, other (non-land) inputs became more important. As a result, output growth can be explained in terms of input use growth and productivity (TFP) growth. The TFP growth can be further decomposed into several factors, viz. research, extension, education, infrastructure, and health of natural resources. The input growth is also influenced by several factors like input-output prices, technological innovations, institutions, infrastructure, and policy initiatives.[42], [43]
Figure 2. Decomposition of Output growth[44]
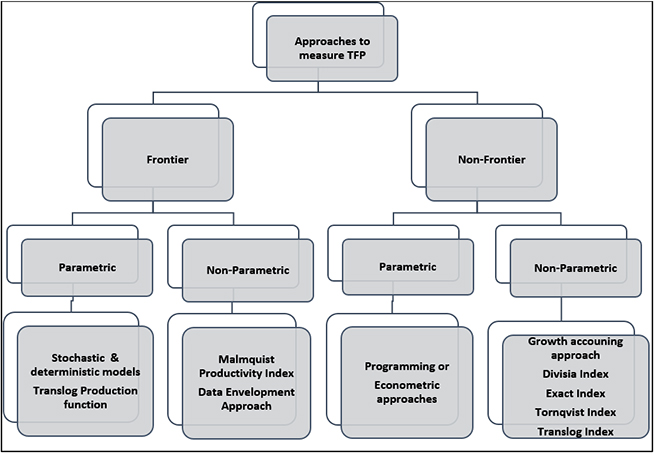
There are two approaches to measuring TFP growth: the frontier and non-frontier. (See Figure 3). Each of these approaches can be further divided into parametric and non-parametric techniques. A frontier approach attempts to measure how far a production unit is from either full cost minimisation or profit maximisation. The distance is a measure of the technical efficiency of the unit, whereas a non-frontier approach ignores technical efficiency and assumes technological progress as a measure of TFP growth.[45], [46] Technical efficiency can be explained as the ability of a production unit to achieve maximum output from a given set of inputs.[47] Furthermore, a parametric approach assumes a functional form and the accuracy of the derived estimates is sensitive to the specified functional form. On the other hand, non-parametric methods do not assume any functional form and therefore no direct statistical tests can be performed to validate the estimates.
Figure 3. Approaches to measure TFP
This paper estimates TFP growth through an econometric approach using a Cobb-Douglas production function to decompose the input contributions from productivity change. The choice of the production function is dictated by the availability of inputs. This approach assumes that the TFP growth is due to technical change/ technological progress alone. In this approach efficiency changes are not considered.[50]
4. DATA AND METHODOLOGY
To analyse productivity growth in the food grain sector in India, this paper categorised the data set into three separate panels: two for cereals and one for pulses. Among cereals, the data sets were divided into two separate panels: one for paddy and wheat, and the other for coarse cereals: jowar, bajra, ragi, maize and barley. A third panel on pulses considers gram and masoor. Paddy and wheat occupy a significant share of total food grain production, total value of output and also area under cultivation of food grains in India. This necessitates treatment of paddy and wheat as a separate panel in the analysis. Among pulses, masoor and gram comprise more than 50 percent of total production and area under cultivation of pulses.
Table 2. Area and Production
| cereals* | pulses* | wheat and paddy** | masoor and gram*** | |
| Area (‘000 hectares) | 100451.63 (86) | 16763.74 (14) | 71775.90 (71 ) | 8933.47 (53) |
| Production (million tonnes) |
205.80 (93) |
12.68 (6) |
169.74 (82) |
7.40 (58) |
Source: Authors’ own
* figures in parentheses represent share in total food grains
** figures in parentheses represent share in total cereals
*** figures in parentheses represent share in total pulses
Data on agricultural statistics were available from the published sources of the government’s Ministry of Agriculture and Farmers’ Welfare. Inputs used are the following: seeds (kg per hectare); fertilisers (kg per hectare); human labour (man hours per hectare); animal labour (pair hours per hectare); and machine labour (rupees per hectare). Data on all these inputs have been compiled from the published sources of the Ministry of Agriculture, Government of India (GoI).[51] Data on inputs and cost of cultivation for individual crops is collected from a sample of selected states in India. National figures were arrived at by taking state averages. Since information on water use in the production of cereals and pulses was not readily available, water was dropped as one of the inputs into production function. Apart from the inputs, selected productivity is also governed by agro-climatic conditions. However, information on agro-climatic conditions could not be incorporated into the analysis due to absence of compatible data.
Data on machine labour were in nominal terms, expressed in 2011-12 prices. The Wholesale Price Index (WPI) for food grains was selected as the appropriate deflator. Data on WPI was obtained from the published sources of the Office of the Economic Adviser of the Department for Promotion of Industry and Internal Trade (DPIIT). Data on the dependent variable, output per hectare, for each crop was compiled from the published sources of the Ministry of Agriculture and Farmers’ Welfare.
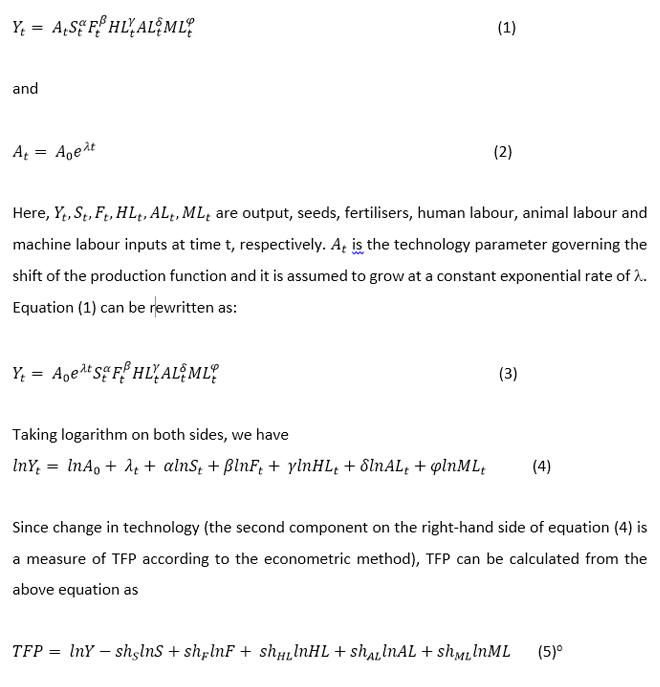
For each panel, TFP growth is estimated using the following model:
A Cobb-Douglas production function is assumed with five inputs: seeds (S); fertilisers (F); human labour (HL); animal labour (Al); and machine labour (ML) and an exogenous technology component (A).
V. RESULTS AND DISCUSSION
Between 1996-97 and 2015-16, the highest increase in yield was recorded in bajra production at an average rate of 4.78 percent per annum (See Table 3). This is followed by maize (2.68 percent), ragi (2.51 percent), barley (1.57 percent) and paddy (1.52 percent). Jowar is the only crop with negative average yield rate of -0.8 percent.
Table 3: Growth in food grains production
(average percentage growth per annum)
| Crop | Yield | Seeds | Fertilisers | Human labour | Animal labour | Machine labour |
| Paddy | 1.52 | 1.87 | 1.68 | -1.06 | -5.46 | 5.32 |
| Wheat | 0.83 | -0.06 | 0.73 | -1.28 | -3.67 | 2.23 |
| Jowar | -0.80 | 1.57 | 2.74 | -1.56 | -5.97 | 7.40 |
| Bajra | 4.78 | -0.27 | 5.19 | 0.19 | -6.52 | 7.71 |
| Ragi | 2.51 | 6.73 | 8.37 | -0.29 | -2.84 | 17.99 |
| Maize | 2.68 | -0.36 | 5.18 | -0.39 | -2.68 | 9.78 |
| Barley | 1.57 | -0.15 | 1.57 | -1.07 | -2.62 | 2.90 |
| Masoor | 0.99 | 0.67 | 6.89 | 0.53 | 2.98 | 2.76 |
| Gram | 0.55 | 1.10 | 6.19 | 0.07 | -4.95 | 4.29 |
Source: Authors’ own
In terms of average shares of various inputs, wheat accounted for the highest share in fertilisers use (18.16 percent) and second highest share in the use of seeds (23.16 percent) (See Table 4). Wheat is followed by paddy as the second highest user of fertilisers (17.26 percent) among food grains, while average share of seed use is highest in barley production (close to 24 percent). This could largely be on account of the fertiliser subsidy provided by the government.
Table 4: Average shares of various crops to total food grains production vis-a-vis yield, seeds, fertilisers, human labour, animal labour and machine labour
| Crop | Yield | Seeds | Fertilisers | Human labour | Animal labour | Machine labour |
| Paddy | 13.67 | 8.61 | 17.26 | 13.79 | 12.36 | 11.57 |
| Wheat | 17.99 | 23.17 | 18.16 | 7.11 | 5.81 | 15.4 |
| Jowar | 5.47 | 3.16 | 6.17 | 6.9 | 8.76 | 6.18 |
| Bajra | 5.99 | 0.99 | 7.14 | 7.47 | 4.5 | 9.75 |
| Ragi | 9.36 | 2.58 | 9.37 | 14.53 | 17.31 | 4.59 |
| Maize | 13.68 | 4.26 | 13.07 | 10.21 | 9.52 | 7.21 |
| Barley | 13.88 | 24.02 | 11.42 | 8.21 | 4.21 | 14.41 |
| Masoor | 4.38 | 8.49 | 3.21 | 5.43 | 5.07 | 7.95 |
| Gram | 5.46 | 13.39 | 3.96 | 4.95 | 4.74 | 8.37 |
Source: Authors’ own
Table 5 presents results of the production function estimation, with outputs from both the fixed-effects and random effects models. It is seen from the table that the estimates obtained by the fixed-effects and the random-effects are close for wheat and paddy except for human labour and time variables, which are significant in the random-effects model. Going by the p-value for Hausman test, the estimates obtained by the random-effects model are preferred. The results indicate that the change in production of these staple crops can be explained by both factor inputs as well as technological change represented by the significant time trend variable which captures the exogenous component of technological progress. A significant negative coefficient of human labour hints towards disguised employment in wheat and paddy production. In other words, excessive use of human labour in production. The importance of seeds as one of the inputs of production is found to be insignificant.
Production function estimates for coarse cereals suggest the fixed-effects model as a preferred choice though all the inputs are contributing insignificantly to the production. On the other hand, time trend variable, representing technological change, is significantly influencing coarse cereals production. Human labour is statistically significant at only 10 percent level. The results from the random-effects model are distinctly different.
The random-effects result of selected pulses (masoor and gram) hint towards statistically significant effects of seeds and fertilisers use in the production of these pulses. The effects of human labour and time trend are insignificant.
Table 5: Estimates of production function
| Explanatory Variables | Fixed Effects | Random Effects | ||
| Cereals- Wheat and Paddy | ||||
| Coefficients | t-statistics | Coefficients | z-statistics | |
| Seeds | 0.044 | 0.61 | 0.042 | 0.73 |
| Fertilisers | 0.389* | 2.64 | 0.387* | 2.83 |
| Human labour | -0.332 | -1.51 | -0.324* | -3.58 |
| Time | 0.004 | 1.11 | 0.004** | 1.93 |
| Constant | 7.774* | 5.27 | 7.737* | 6.59 |
| No. of observations | 40 | |||
| Overall R-sq | 0.9335 | 0.9337 | ||
| Hausman statistics | 0.00 | |||
| Wald Chi 2 | 492.53 | |||
| Coarse Cereals | ||||
| Coefficients | t-statistics | Coefficients | z-statistics | |
| Seeds | 0.062 | 0.64 | 0.192* | 8.89 |
| Fertilisers | 0.065 | 1.23 | 0.424* | 6.29 |
| Animal labour | -0.018 | -0.58 | -0.085* | -2.33 |
| Human labour | 0.308 | 1.91 | 0.596* | 5.87 |
| Time | 0.017* | 4.82 | 0.005 | 1.24 |
| Constant | 4.731* | 4.71 | 1.406* | 2.96 |
| No. of observations | 100 | |||
| Overall R-sq | 0.615 | 0.815 | ||
| Hausman statistics | 58.56* | |||
| Wald Chi 2 | 416 | |||
| Pulses (Gram and Masoor) | ||||
| Coefficients | t-statistics | Coefficients | z-statistics | |
| Seeds | 0.139 | 0.73 | 0.334* | 4.08 |
| Fertilisers | 0.191*** | 1.88 | 0.213* | 2.13 |
| Human labour | -0.169 | -1.06 | -0.204 | -1.29 |
| Time | -0.004 | -0.76 | -0.007 | -1.19 |
| Constant | 6.462* | 5.67 | 5.822* | 5.87 |
| No. of observations | 40 | |||
| Overall R-sq | 0.675 | 0.717 | ||
| Hausman statistics | 1.27 | |||
| Wald Chi 2 | 88.92 | |||
*Significant at 1% level **significant at 5%
Source: Authors’ own
The details of TFP growth computed in this study are provided in Table 6. The productivity growth of wheat and paddy is poor of the order of 0.35 percent. Coarse cereals exhibit a productivity growth of close to 2 percent while pulses show a negative growth in productivity (-0.05).
Table 6: Total factor productivity growth in food grains production
(average annual growth in percentage)
| Food grains | |
| Wheat and Paddy | 0.35 |
| Coarse cereals | 1.99 |
| Pulses (Gram and Masoor) | -0.049 |
Source: Authors’ own
Partial factor productivity growth rates are reported in Table 7. Productivity growth of seeds is the highest in coarse cereals production (3.1 percent). Coarse cereals also seem to have experienced highest productivity growth rates in fertilisers (4.41 percent), animal labour (16.4 percent) and machine labour (8.1 percent). It is only in human labour that wheat and paddy have high factor productivity gains (nearly 4 percent).
Overall results indicate that wheat and paddy production is no longer productive. TFP and PFP results are poor for these crops. The production of coarse cereals is relatively better, though not encouraging. Production of pulses requires immediate policy attention.
Table 7: Partial factor productivity growth in food grains production
(average annual growth in percentage)
| Inputs/ food grain | Wheat and Paddy | Coarse cereals | Pulses (Gram and Masoor) |
| Seeds | 1.005 | 3.059 | -0.138 |
| Fertilisers | 0.825 | 4.412 | 1.367 |
| Animal Labour | 7.493 | 16.408 | 10.864 |
| Human Labour | 3.959 | 2.773 | 1.614 |
| Machine Labour | -0.545 | 8.098 | 2.171 |
Source: Authors’ own
Based on the importance of TFP estimates, many studies have been carried out in the past on the productivity assessment of food grains production in India, taking different time periods. The results vary depending on the choice of data source, the starting and terminal years, as well as the methodology used.
Kumar and Mittal (2006) have also reported a negative TFP growth in the production of pulses at -0.39 percent. Such a trend is also observed by Chand et al., (2012) when they report TFP growth of -0.69 and -0.47 percent in the production of red gram and black gram, respectively. Bhushan (2005), for its part, report TFP growth in pulses of 1.61 percent for the period 1981-82 to 1989-90 and 0.55 percent for the period 1990-91 to 2000-01.[52]
The TFP growth estimates for coarse cereals provided by these studies are a mix. Kumar and Mittal (2006) report 0.12 percent TFP growth for the period 1986-2000, while Chand et al. (2012) report TFP growth of more than one percent for most cereals other than sorghum (0.63 percent).
In this analysis, the TFP growth estimates for wheat and paddy are in contrast to these three studies. The above studies present TFP growth to be in the range of 0.68 to 3.10 percent for wheat and from 0.64 to 3.47 percent for paddy.
VI. INSIGHTS FOR “MORE CROP PER DROP”
The changing composition of food basket away from staple food grains to high-value products will increase demand for water even further. Production of major food crops in India requires two to four times more water compared to other major agricultural countries like China, Brazil, and the US.[53] Around 45 percent of the current area under cultivation consumes about 84 percent of total available water while the industrial and domestic sectors consume about 12 and four percent, respectively.[54] Three major water-intensive crops—rice, wheat and sugarcane—account for more than 80 percent of the irrigation water.[55] With irrigation predicted to remain the dominant user of water, more crop per drop is an imperative. Improving water use efficiency is a critical response to expand area under irrigation while also leaving enough water in rivers and lakes to sustain the ecosystem and meet the growing demand of domestic and industrial sectors.
Aqueduct, an online tool to calculate water stress index created by the World Resources Institute (WRI), maps India among some of the most water-stressed regions in the world.[56], [57], [p] Supply-side measures to circumvent water stress in India include developing additional surface and groundwater resources and providing subsidised energy to exploit these resources.[58] Improving water productivity, however, will be a more sustainable approach for increasing production under these increasingly stressful water conditions across the country. As many countries across the world, and large, water use-intensive regions within them, like Punjab and Haryana in India, are breaching the thresholds of economic and physical water scarcities, it is imperative to measure the productivity of water use in agriculture.[59], [60], [61]
Water productivity can be measured in terms of economic and physical output potential of total water used. It is important to understand water productivity in terms of these components because water productivity is scale-dependent: from plant to plot, to farm to agricultural system to command area and river basin. Economic and Physical Water Productivity ratios are defined as follows:
Here, ‘i‘ refers to the crop variety and ‘t‘ represents the time period. The ratios have been calculated for each crop in each time period.
Total water requirement has been calculated from the crop water requirement as defined by FAO. These figures were calculated by multiplying the water requirement (in metres) of each crop by the area under cultivation (in square metres) of the corresponding crop. The product yields the total volume of water (in cubic metres) required by each crop. EWP and PWP has been calculated for paddy, wheat, ragi, maize, jowar, bajra, barley, arhar, gram, masoor, moong and urad. Table 8 depicts the average of water productivity ratios for the crops mentioned.
Table 8. Average water productivity ratios
| Water Productivity Ratios | Economic water productivity (Rs/cubic metre) | Physical water productivity (kg/cubic metre) |
| Paddy | 1.21 | 0.12 |
| Wheat | 3.75 | 0.50 |
| Ragi | 0.36 | 0.20 |
| Maize | 1.92 | 0.14 |
| Jowar | 1.31 | 0.40 |
| Bajra | 6.98 | 0.27 |
| Barley | 2.84 | 0.40 |
| Arhar | 2.00 | 0.11 |
| Gram | 9.24 | 0.54 |
| Masoor | 1.01 | 0.05 |
| Moong | 2.51 | 0.12 |
| Urad | 8.29 | 0.44 |
Source: Authors’ own calculations
Physical water productivity of rice is 0.12 kg per cubic metre of water used and rice has one of the highest water requirements. In terms of PWP, gram is the most productive crop while arhar is the least productive. PWP of rice is only marginally better than that of arhar. Since paddy accounts for about 28 percent of the gross irrigated area in the country, low PWP figures indicate inefficient utilisation of water in the sector.[62] Wheat, jowar, barley, gram and urad are relatively better performers in terms of water use efficiency in India.
Comparing economic water productivity of these crops it is observed that gram, urad, bajra and wheat are the top four performers while ragi, masoor, paddy and jowar are the poorest performers in this regard. Both PWP and EWP estimates suggest that economic and physical returns from gram are the highest in the country. This is followed by urad, and bajra and wheat. While both paddy and wheat are water intensive crops, their relative performance in terms of both PWP and EWP suggest that the former has been highly inefficient compared to the latter. It is observed that pulses such as gram and urad are more productive in the use of water. But in terms of acreage, pulses as a whole account for only 14 percent of area under food grains. Trends of water productivity of rice and pulses like gram and urad, and their acreage suggest that water has been relatively unproductive in the former than in the latter. This will have important implications for overall utilisation of water resources for agriculture purposes in the country.
As highlighted by Sharma et al (2018) economic returns can be enhanced by 147 percent by shifting from one hectare of staple crops such as paddy and wheat to commercially high-value crops such as pulses. As staple crops like wheat and paddy consume higher quantities of water, this transition suggests that water-centric interventions will improve agricultural productivity and aid in the government’s aim to double farmers’ incomes by 2022.[63]
VII. CONCLUSION
Food security encompasses manifold dimensions. It involves the interaction of multiple components of an economy and is directly or indirectly impacted by a host of factors, among them: occupation and income levels of the population, gender, higher population growth, urbanisation, low productivity of land, rising cost of food grains, increasing cost of cultivation, geographical location, and climate change. Such complexity renders it difficult to arrive at an exact assessment of the state of food security at a given time. As a result, the quantity of food available in a specific time period in a particular place is taken to represent the level of food security where food production is the basis of food availability. In India, official definitions take ‘food security’ to be synonymous with ‘food grain security’.
The adoption of green revolution technologies in agriculture in the 1960s transformed the situation in India from a ‘ship to mouth’ existence reliant on imports, to self-reliance in food grain production. Food production during the green revolution was largely supply-driven, unlike in the current neo-liberal policy regime which is mainly demand-driven on account of rising per capita incomes, urbanisation, and changes in dietary patterns towards high-value agricultural commodities. This paper has discussed such income-related changes in food consumption in both rural and urban households. In such a scenario, food security should be envisioned as the availability not only of food grains but of high-value products as well. Promoting a diversified production system that improves the availability of nutrient-rich pulses, horticulture and livestock products has to be of high priority for agricultural policy that is aimed at food security. Meeting this increasing demand will require additional agricultural resources for expanding agricultural production beyond food grains.
However, agricultural expansion in India is challenged by two major supply-side constraints viz., land and water. The possibility of bringing additional land under cultivation is quite limited since 60 percent of agricultural area is occupied by food grains. At the same time, water being another critical resource for agriculture production, it is mostly absorbed in the wheat and paddy production, leaving most of the other crops water-deprived. In such a scenario, future demand for food can only be met by improving productivity and water use efficiency of food grains, which has direct implications for the non-food grain sector.
Production function estimates from this analysis suggest that wheat and paddy have benefitted from technological progress though there is an existence of disguised unemployment in the production of paddy and wheat. The model estimates of coarse cereals exhibit technological advancement, just like the major staples. However, it is only the production of pulses that has not benefitted from technological change even though seeds and fertilisers have significantly contributed to their production.
Productivity performance, measured by the growth in PFP and TFP, has shown considerable variation among food grains. Coarse cereals which have enjoyed the highest benefit of technological change during the period 1996-97 to 2014-15 also show the highest TFP growth of nearly two percent. Whereas major cereals, namely wheat and paddy, have lagged far behind with annual TFP growth of only 0.35 percent. On the other hand, pulses, which are relatively high-value
commodities, experienced a negative productivity growth in the order of – 0.05 percent.
Inferring from the TFP growth estimates, coarse cereals hint towards sustainable production system while a non-positive trend in TFP growth of pulses indicate lack of sustainability. The PFP growth estimates for coarse cereals substantiate this paper’s view on the sustainability of their production system: PFP growth of most of the standard inputs is highest in the production of coarse cereals among food grains. An improvement in TFP is an important factor determining output growth that has direct implications for cost reduction and subsequent increase in income.
Furthermore, in the production estimates, this analysis could not consider water explicitly as one of the inputs to the production process though this resource is a critical input and a binding constraint to Indian agriculture. Productive use of water is necessary to realise the full benefits of fertilisers, seeds, tillage, labour, energy and machinery. Achieving high water productivity can help reduce the cost of cultivation of crops and the energy requirement for water withdrawal. Improved water productivity can also help reduce the need for additional land and water resources in both irrigated and rain-fed production systems. Against this backdrop, ensuring optimum water productivity becomes essential to ensure sustainable growth in agriculture.
Estimates of economic and physical water productivity from this analysis suggest that paddy, the most water-intensive food grain crop, is among the worst performers in terms of both PWP (0.12) and EWP (Rs 1.21 per m3) in the food grain sector. Wheat, another staple crop, however, is performing relatively better than paddy, and is in fact among the best performers in terms of PWP. Bajra is the best performer among cereals in terms of economic water productivity (Rs 6.98 per m3). Gram, on the other hand, is the best performer on both parameters. Urad is also doing well in terms of EWP and PWP. The current focus of water productivity has been confined to the objective of producing more food, incomes, livelihood though physical water productivity can also be taken to reflect on ecological benefits at less social and environmental costs per unit of water consumed. In addition, economic water productivity can be used to relate water use in agriculture to nutrition. This is evident from our EWP figures on bajra (Rs. 6.98 per m3), gram (Rs. 9.24 per m3) and urad (Rs. 8.29 per m3)- some of the more nutritious and high-valued food grains- vis-a-vis major staples like paddy and wheat.
The objective of agricultural development cannot be confined to maximising productivity per unit of land but also optimising productivity per unit of water for achieving ‘more crop per drop’. Promoting higher water use and land use efficiency is a critical response to meeting growing future consumption demand for high-valued horticulture, livestock and dairy products. Harnessing improvement in productivity and resource use efficiency along with diversification towards high-value crops offers a great potential to doubling Indian farmers’ incomes in real terms.
Authors’ Note: We thank the two anonymous reviewers for their valuable comments on an early draft of this paper, and Dr. Nilanjan Ghosh for his insights.
Endnotes
[a]Food availability addresses the “supply side” of food security and is determined by the level of food production, stock levels and net trade. According to FAO, an adequate supply of food at the national or international level does not in itself guarantee household level food security. Household must have economic and physical access to food. As such adequate supply may not be enough to ensure food security. Utilisation is commonly understood as the way the body makes the most of various nutrients
in the food. This is equally important for food security. Dietary patterns, feeding practices, food preparation and intra-household distribution of food are essential to proper utilisation of food. In addition to the three essential elements, it is necessary that the stability of those dimensions is maintained. Therefore, availability, access and utilisation of food must be stable over a period of time and not subject to fluctuations.
[b] Malnutrition among children can be estimated by observing the percentage of children below 5 years of age who are stunted and wasted. NFHS-4 (2016-17) suggests that 38.4 percent are still stunted and 21 percent of children below five years of age are wasted. These figures show that the percentage of stunted children has declined, while the children who are wasted have increased from the levels registered in the previous NFHS survey (2005-06).
[c] The NFSA is “an act to provide for food and nutritional security in human life cycle approach, by ensuring access to adequate quantity and quality food at affordable prices to people to live a life with dignity and for matters connected therewith or incidental thereto.”
[d]This approach is based on the growth of population and changing behaviour of consumption on account of changing per capita income in a growing economy. The latter is captured by the expenditure elasticities. According to estimates by NITI Aayog (2018), expenditure elasticity of pulses, edible oil, fruits and vegetables, milk and meat products are higher than those of cereals in both rural and urban areas.
[e]Non-food grains include high value horticulture, livestock and dairy products such as edible oil, oilseeds (except palm oil), milk and products, eggs, fish and meat, vegetables, fruits and nuts. They are also high income elastic products.
[f] Following Singh et al., 2018, 70 percent of India’s food grains production comes from irrigated agriculture while NITI Aayog (2018) reports rice, wheat and sugarcane accounting for 80 percent of irrigation water.
[g]Here we are looking into the implications of productivity of food grains on the availability dimension of food security.
[h]Policy focus during the first three years after the reforms of 1991 were engaged in crisis management to stabilise the economy and thus we begin our analysis with the period 1995-96.
[i]Using NSSO (68th Round) data on household consumption expenditure.
[j] Estimates from the National Sample Survey Organisation, MPCE for 1993-94 was approximately Rs.160 and Rs.265 in rural and urban areas, respectively. Although the same increased to Rs.221 and Rs.481 in 2011-12, the MPCE in rural areas is still lower than that in urban areas.
[k] This approach is based on the growth of population and changing behavior of consumption on account of changing per capita income in a growing economy. The latter is captured by the expenditure elasticities.
[l]The base line scenario assumes GDP growth rate of 6 percent per annum for the forecast period, i.e., 2012-13 to 2032-33. Estimates for future demand and supply have also assumed ambitious growth scenarios of 8 percent and 10 percent. Given the recent downgrade in GDP growth forecasts by the Reserve Bank of India to 5.6 percent, the baseline scenario reflects a relatively more realistic picture.
[m]The Compound Annual Growth Rate (CAGR) of demand for oilseed and food grains between 2011-12 and 2032-33 is 6 percent and 2 percent, respectively.
[n]According to estimates from NITI Aayog (2018), expenditure elasticities of pulses in rural and urban areas are 0.55 and 0.36 respectively. In comparison to this these, the same figures for cereals are -0.13 and -0.04.
[o] refers to the share of i-th factor, and .
[p]A region is considered to be water stressed if water availability is below 1700 m3 per person per year, according to the Falkenmark indicator. In India the water availability, as per 2011 census figures, stood at 1545 m3.
[1]Ramesh Chand,” Demand for Food grains,” Economic and Political Weekly 42, No. 52 (December, 2007): 10-13.
[2]Department of Economic Affairs, Economic survey 2017-18(Statistical Appendix), Ministry of Finance, Government of India (January 2018): Table 1.19.
[3]Food and Agriculture Organisation of the United Nations, “Rome Declaration on World Food Security and World Food Summit Plan of Action”, United Nations (November 1996).
[4]EC-FAO Food Security Programme, An Introduction to the Basic Concepts of Food Security, FAO (2008). Available at: www.foodsec.org
[5]Government of India, National Food Security Act2013, Gazette of India: Extraordinary, Part II, Sec 1 (September, 2013).
[6] Ramesh Chand,” India’s Agricultural Policy: A Critique,” in India’s Agricultural Challenges: Reflections on Policy, Technology and Other Issues, ed. Ramesh Chand (Centad: September 2005): 33.
[7]S. P. Singh,” Challenges of food security in India,” Journal of Economic and Social Development XII, No.1 (June 2016): 1-12.
[8]Prabhu Pingali and Yasmeen Khwaja, “Globalisation of Indian diets and the Transformation of Food Supply Systems,” ESA Working Paper No.04-05, FAO (February 2004): 1-31.
[9]Working Group Report, Demand and Supply Projections towards 2033- Crops, Livestock, Fisheries and Agricultural Inputs, NITI Aayog (February, 2018): 84.
[10] Ibid: 86.
[11]Praduman Kumar, P.K. Joshi and Surabhi Mittal, ” Demand vs Supply of Food in India: Futuristic Projection”, Proceedings from the Indian National Science Academy 82, No.5 (December 2016): 1585.
[12]Sudha Narayanan, ” Food Security in India: The Imperatives and Its Challenges,” Asia & the Pacific Policy Studies 2, no. 1 (2015): 197-209.
[13]O.P. Singh, Yash Gautam, P.K. Singh and H.P. Singh,” Enhancing Inputs Use Efficiency through Resource Conservation Technologies: Empirical Evidences from Different Agro-Climatic Zones of Uttar Pradesh,” Indian Journal of Agricultural Economics 73, No. 3 (July-September 2018): 249-268.
[14]M.S Swaninathan and R.V. Bhavani, “Food Production & Availability- essential prerequisites for sustainable food security,” The Indian journal of medical research 138, no.3 (September 2013): 383-91
[15] Supra note 18.
[16] Ramesh Chand, “Doubling Farmers’ Income: Rationale, Strategy, Prospects and Action Plan”, NITI Policy Paper 1, NITI Aayog, Government of India (2017): 1-32.
[17] Supra note 18.
[18] Registrar General and Census Commissioner of India, Census of India: towards a bright future, Ministry of Home Affairs, Government of India (2011).
[19] Praduman Kumar, P.K. Joshi and Surabhi Mittal, ” Demand vs Supply of Food in India: Futuristic Projection”, Proceedings from the Indian National Science Academy 82, No.5 (December 2016): 1585.
[20] Ernst Engel, “Die Productions- und Consumtionsverhältnisse des Königreichs Sachsen”. Zeitschrift des statistischen Bureaus des KöniglichSächsischen Ministerium des Inneren (1857).
[21] National Sample Survey Organisation, Key Indicators of Household Consumer Expenditure in India, Ministry of Statistics and Programme Implementation, Government of India (June 2013): 13.
[22] Ibid.
[23] Praduman Kumar, P.K. Joshi and Surabhi Mittal, ” Demand vs Supply of Food in India: Futuristic Projection”, Proceedings from the Indian National Science Academy 82, No.5 (December 2016): 1585.
[24] Surabhi Mittal,” Demand-Supply Trends and Projections of Food in India”, ICRIER Working Paper No. 209 (March 2008): 1-29.
[25] Ibid.
[26] Working Group Report, Demand and Supply Projections towards 2033- Crops, Livestock, Fisheries and Agricultural Inputs, NITI Aayog (February, 2018): 83.
[27] Ibid. 85
[28] “Agricultural Production- Food grains”, Ministry of Agriculture and Farmers’ Welfare, Government of India.
[29]Working Group Report, Demand and Supply Projections towards 2033- Crops, Livestock, Fisheries and Agricultural Inputs, NITI Aayog (February, 2018): 88.
[30]Ramesh Chand,” Demand for Food grains,” Economic and Political Weekly 42, No. 52 (December, 2007).
[31] Aymen Frija, Boubaker Dhehibi, Aden Aw-Hassan, Samia Akroush & Ali Ibrahim, “Approaches to Total Factor Productivity Measurements in the Agriculture Economy,” CGIAR Research Program on Dryland Systems (2015).
[32] L Lachaal, Competitiveness: Concepts, definitions and applications, In: Laajimi A. (ed.), Arfa L. (ed.). Le futur des échanges agro-alimentaires dans le bassin méditerranéen : Les enjeux de la mondialisation et les défis de la compétitivité . Zaragoza : CIHEAM,( 2001): 29-36
[33] Pushpa Trivedi, Anand Prakash and David Sinate,” Productivity in Major Manufacturing Industries in India: 1973-74 to 1997-98,” Development Research Group (DRG), Reserve Bank of India (2000).
[34] V. Kathuria, R.S.N Raj and K. Sen,” Productivity measurement in India manufacturing: A comparison of alternative methods,” Journal of Quantitative Economics 11 (2013).
[35]Anit N. Mukherjee and Yoshimi Kuroda,” Productivity growth in Indian agriculture: is there evidence of convergence across states?” Agricultural Economics 29 (2003): 43-53.
[36]Preeti Kapuria, Nilanjan Ghosh and Suman Das,” Productivity growth in Indian manufacturing: policy implications from an econometric analysis,” ORF Occasional Paper No. 140 (January 2018).
[37]Aymen Frija, Boubaker Dhehibi, Aden Aw-Hassan, Samia Akroush & Ali Ibrahim, “Approaches to Total Factor Productivity Measurements in the Agriculture Economy,” CGIAR Research Program on Dryland Systems (2015).
[38] Supra note 38.
[39] T. W. Schultz, Economic Organisation of Agriculture, (New York: McGraw Hill Co., 1953).
[40] R. M. Solow,” Technical change and aggregate production function,” Review of Economics and Statistics 39, No. 3 (1957): 312-320.
[41] Z. Griliches,” Research expenditures, education and the aggregate agricultural production function,” American Economic Review 54 (1964): 961-974.
[42] Praduman Kumar and Surabhi Mittal,” Agricultural Productivity Trends in India: Sustainability Issues”, Agricultural Economics Research Review 19 (2006): 71-88.
[43] Supra note 18.
[44] Supra Note 39.
[45] Scott E. Atkinson and Christopher Cornwell,” Estimating Radial Measures of Productivity Growth: Frontier vs Non-Frontier Approaches,” Journal of Productivity Analysis 10, No. 1 (1998): 35-46.
[46] Supra note 39.
[47]Michael James Farrell,” The Measurement of Productive Efficiency,” Journal of the Royal Statistical Society, Series A 120 (1957): 253-282.
[48] Supra note 39.
[49] Supra note 44.
[50] Supra note 38.
[51] “Comprehensive Scheme for the Cost of Cultivation of Principal Crops in India”, Directorate of Economics and Statistics, Department of Agriculture, Cooperation and Farmers’ Welfare, Ministry of Agriculture and Farmers’ Welfare, Government of India.
[52]Surya Bhushan,” Total Factor Productivity Growth of Wheat in India: A Malmquist Approach,” Indian Journal of Agricultural Economics 60, No. 1 (January- March 2005): 1-17.
[53] Task Force on Agricultural Development, “Raising Agricultural Productivity and Making Farming Remunerative for Farmers,” NITI Aayog (2015).
[54] Ibid.
[55] Bharat R. Sharma, Ashok Gulati, Gayathri Mohan, Stuti Manchanda, Indro Ray and UpaliAmarsinghe, Report on Major Productivity Mapping of Major Indian Crops,NABARD and ICRIER (2018): 10.
[56] World Resources Institute, “Aqueduct Water Risk Atlas“, accessed November 4, 2019.
[57] MalinFalkenmark, Jan Lundqvist and Carl Wildstrand,” Macro-scale water scarcity requires micro-scale approaches,” Natural Resources Forum 13, No. 4 (1989): 258-267.
[58] Ashok Gulati and Sudha Narayanan, The Subsidy Syndrome in Indian Agriculture, (Oxford University Press: New Delhi, 2003).
[59] International Water Management Institute, Report on World’s Water Supply and Demand 1995-2025, IWMI, Colombo, Sri Lanka (2001).
[60] Mark W. Rosegrant, Ximing Cai and Sarah A. Cline, World Water and Food to 2025: Dealing with Scarcity, (Washington D.C.: International Food and Policy Research Institute, 2002).
[61] Karam Singh,” Groundwater Depletion in Punjab: Measurement and Countering Strategies,” Indian Journal of Agricultural Economics 66, No. 4 (October-December 2011): 573-589.
[62]Supra Note 57: 31.
[63] Supra note 57: 6.
The views expressed above belong to the author(s). ORF research and analyses now available on Telegram! Click here to access our curated content — blogs, longforms and interviews.

Preeti Kapuria was a Fellow at ORF Kolkata with research interests in the area of environment development and agriculture. The approach is to understand the ...
Read More +
Roshan Saha was a Junior Fellow at Observer Research Foundation Kolkata under the Economy and Growth programme. His primary interest is in international and development ...
Read More +