Introduction
Multilateral forums like the Group of Twenty (G20) play a crucial role in bolstering global collective action against climate change. The G20 gathers the world’s most developed economies and emerging ones, which together account for more than 80 percent of global GDP, 75 percent of international trade, and 60 percent of global population.[1] The G20 economies are responsible for about 75 to 80 percent of global greenhouse gas emissions.[2] All but one of the top 10 carbon-emitting countries are G20 members.[3]
At the same time, the G20 economies account for the largest share of global wealth and therefore possess the financial wherewithal to spearhead the green transition required to limit the rise in global temperature to 1.5 degrees Celsius. Moreover, the G20 countries are home to many of the world’s most significant carbon sinks, such as the Brazilian Amazon Rainforest, the Steart Marshes in the United Kingdom (UK), and the Sundarbans in India.[4] At the G20 Joint Environment and Climate Ministerial Meeting held in August 2022, the member countries acknowledged the severity of the climate crisis and declared that three crucial issues will be prioritised towards fulfilling the goals set by the Paris Agreement: a sustainable global economic recovery; land-based and ocean-based climate action; and resource mobilisation for environmental protection.[5]
Data from the Climate Action Tracker (CAT) shows that of the G20 countries, only the UK has put in place climate action targets and policies that could help the global community achieve the goal of limiting global warming to 1.5 degrees Celsius.[6] Prior to the negotiations at COP27 in Egypt in 2022, participating countries were expected to submit revised or updated targets with renewed pledges; but they hardly delivered. While 19 out of the 20 countries have updated their pledges, only 11 submitted targets that are stronger than their previous ones. These targets must be strengthened and suitable policies carefully planned and implemented to meet them.[7]
This report offers a unique Climate Performance Index (CPI) to evaluate the performance of the G20 countries in climate change mitigation. Guided by the principle of ‘Common But Differentiated Responsibilities (CBDR)’, this assessment demarcates individual countries’ responsibilities towards collective climate action commensurate with historical emissions, demographic factors like population, deficits in economic and human development, and their financial and technical wherewithal to undertake a green transition.
Existing literature on climate change include evaluations of climate action. Of these, the two most popular indices are the Climate Change Performance Index (CCPI)[8] developed by German Watch, and the Climate Action Tracker (CAT)[9] of the Climate Analytics and NewClimate Institute. The CAT undertakes quantification exercises to capture the impacts of a country’s climate policies and action. It covers the financing pledges, targets, and nationally determined contributions (NDCs) on national emissions from 1990 onwards to arrive at 2030 projections. Where possible, the tracker explores the future trajectory of national emissions in relation to emission levels compatible with a below-2 degrees Celsius pathway, the NDCs, pledges, and current policies. The CCPI, meanwhile, is based on four fundamental variables: per capita GHG emissions; share of renewable energy per total primary energy supply; per capita total primary energy supply; and climate policy.
The present analysis creates an index that abstains from making assessments of the future trajectory of the countries’ climate mitigation performance. Rather, the index measures the cumulative climate performance of the G20 countries till date; the aim is to guide these countries in creating the strategies and best practices for effective mitigation. The underlying hypothesis is that the variables included in the construction of the index reflect the cumulative (i.e., an aggregation of the past and present) impact of various dimensions of climate performance. These include historical evaluations, distributive aspects, as well as capacity-building and directed climate action. The past is being accounted for by the present index to identify responsibilities for cumulative action.
The CPI incorporates information that is not captured by the CCPI and the CAT, such as energy efficiency of production; Theil’s index of carbon inequality, an indicator reflecting contribution to historic emissions; the carbon cost of growth; and the climate-regulating and climate-altering land cover. These indicators, contained in a composite figure, are required to analyse the aggregate impact of climate action.
A caveat is in order: The authors of this report acknowledge the technical difficulties in articulating an exact definition and measure of climate performance. What it does is it defines ‘climate performance’ as the composite index that is arrived at by aggregating certain input and output variables related to climate change mitigation.
The rest of the paper is organised as follows. Section 2 is an exposition of the G20 Climate Performance Index (CPI), outlining the index structure and methodology for its construction, identifying the component indicators, and setting limitations of the exercise. Section 3 discusses the findings, followed by the fourth section that outlines seven key recommendations that can define the G20’s discourse on climate governance under India’s 2023 presidency. Section 5 provides a survey of climate policy coverage across important sectors, and how this policy coverage is related to various dimensions of mitigation. The paper closes with a framework for the G20’s priorities under the Indian Presidency.
The Climate Performance Index: An Assessment of the G20 Countries
a. Index Structure: Methodology, Component Indicators, and Sources
The Climate Performance Index (CPI) is calculated as a weighted average of 11 component indicators or variables that capture the impact of a country’s performance in climate mitigation in cumulative terms, while taking into consideration its current standing among the G20 members. The structural form of the CPI can be represented as the following identity:
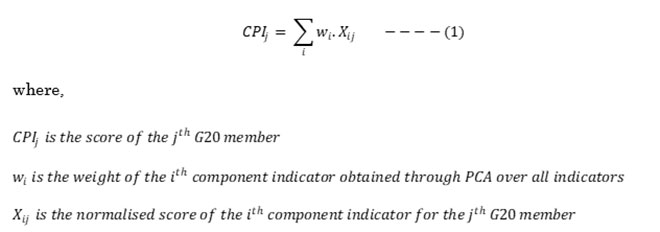
The indicators involved in computing the index can be classified in two ways: the first categorises the variables based on whether they represent an input in relation to their climate action or an outcome or output of their overall climate performance; and the second categorises variables based on whether they represent annual climate performance for the year 2019 or the cumulative climate performance up to 2019. Irrespective of how these variables are classified, they reflect the cumulative impact of the countries’ respective development pathways and climate policies implemented till 2019. The analysis then interprets the impact of climate policies until 2019 as an approximate cumulative impact rather than an exact measure of this impact. The data corresponding to the year 2019 has been used to capture the ‘business as usual’ scenario prior to the COVID-19 pandemic and avoid any related bias. Table 1 lists the component indicators and their data sources.
Table 1: Indicators of the Climate Performance Index
| Indicator (units) |
Timeline |
Data Source |
| Per Capita CO2 emissions from fossil fuels (metric tons per capita) |
2019 |
World Development Indicator[10] |
| Per Capita non-CO2 GHG emissions (metric tons per capita) |
2019 |
Climate Watch Tracker[11] |
| Share of Global Cumulative Carbon Emissions relative to Share of Global Cumulative Population |
1800-2019 |
Our World in Data[12] |
| Carbon Cost of Growth |
2019 |
Global Carbon Atlas,[13] World Development Indicator[14] |
| Theil Index of Carbon Inequality |
2019 |
World Inequality Database[15] |
| Rate of Per Capita Energy Use Relative to 2,000 Watts |
2019 |
Our World in Data[16] |
| Energy efficiency of production (GDP per unit of primary energy consumption) (in billions/Twh) |
2019 |
Our World in Data,[17] World Development Indicator[18] |
| Renewable energy consumption (as a share of total final energy consumption) (in %) |
2019 |
World Development Indicator[19] |
| Percentage Change in Climate Altering Land Cover (in %) |
1992-2019 |
IMF Land Cover Accounts[20] |
| Percentage Change in Climate Regulating Land Cover (in %) |
1992-2019 |
IMF Land Cover Accounts[21] |
| Climate Policy Coverage |
2022 |
Climate Policy Database[22] |
Source: Authors’ own
To construct the CPI, these 11 quantitative indicators were considered. They consist of: (1) output variables reflecting climate outcomes particularly associated with climate change mitigation; and (2) input variables reflecting capacity building and policy initiatives for climate change mitigation.
Data corresponding to each indicator was collected for all G20 members, including the European Union. All indicators were accordingly adjusted to remove any inherent scale bias and represented in relative terms. To allow for comparisons across an aggregation of indicators, all the data points were normalised on a scale of 0 to 1 (unit free) using the following formula:

For negative indicators where a higher value of the variable implies a higher contribution to climate change, the complement of their normalised values has been taken to convert them into a positive indicator. This has been done to construct a uniform, unit and direction-free, composite performance index.
The weights associated with each of the component indicators were determined using principal component analysis (PCA). A PCA-assigned weight structure enhances the statistical robustness of an indexation exercise, ensuring there is no ‘subjectivity’ and ‘sub-optimal representation’ of any component indicator in the final index scores.[23] To develop the weight structure using results from the PCA matrices, let us define as the weight of component indicator in the composite index where,

First, the principal component with which the component indicator has the highest correlation is identified. The weight assigned to the component indicator is the product of the correlation mentioned above and the explanatory power of the corresponding principal component, which refers to the proportion of the identified component (in the complete information set). Once the weight corresponding to each component indicator is calculated, the weight distribution is scaled to sum up to 1 (100 percent) to avoid underrepresentation. At the final stage, the scores for the G20 countries are calculated using the structural identity for the CPI.
b. Rationale for Choice of Indicators
While all component indicators of this index influence aggregate levels of GHG emissions—and therefore, climate change—each of them reflects the various aspects of the countries’ performance in climate mitigation. For example, indicators like 'Per Capita CO2 emissions from fossil fuels’ and ‘Renewable energy consumption as a share of total final energy consumption’, while seemingly representing the same phenomenon, capture unique advances. To rule out multi-collinearity among the component indicators and overlaps of information, the pair-wise correlation matrix was considered. The correlation matrix of the 11 component indicators shows that each indicator captures significantly unique information as a part of the final index. This rules out multi-collinearity between variables and the possibility of double-counting (see Appendix 2).
The rationale for inclusion of each specific indicator and their implications for climate performance is discussed in the following points.
- Per capita CO2 emissions from fossil fuel combustion: The impact of a nation’s climate policies is ultimately reflected in curtailing the greenhouse effect and, thereby, global warming. Climate change mitigation goals are therefore defined in terms of reduction in GHG emission levels. Of these, CO2 emissions dominate the composition of GHG emissions (74.1 percent in 2019).[24] Fossil fuel combustion and industrial processes are the primary sources (96.4 percent) of CO2 emissions.[25] A successful green transition based on decarbonisation and a shift to the low-carbon economy is contingent on migrating away from fossil-fuel use to renewables and cleaner sources of energy. Moreover, a country’s population levels determine how rapidly the economy has to grow to meet the development needs of the people. Therefore, motivated by concerns of climate justice and equity, a fair comparison of the national emissions must account for countries’ population levels. The construction of the CPI thus includes the per capita CO2 emissions from fossil fuel combustion as an important indicator of climate mitigation performance.
- Per capita non-CO2 GHG emissions: Other non-CO2 GHG emissions such as methane, F-gases and nitrous oxides from various sources make significant contributions to global warming. While the share of non-CO2 GHG emissions in the total is relatively low, the global warming capacity of these gases is significantly higher.[26] Moreover, while GHG emissions from fossil fuels remain dominant in industrialised nations, GHG emissions from other sectors, including land use change are significantly more relevant for countries with a large primary sector. Therefore, in consideration of the variations in individual countries’ development pathways and to abide by the principles of climate justice and equity, the present analysis takes into account the per capita non-carbon GHG emissions, as a separate indicator.
- Share of Global Cumulative Carbon Emissions relative to Share of Global Cumulative Population: It is equally important to account for the legacy of emissions contributions by these countries that have led to the depletion of the carbon budget of the world. This is because the world has witnessed massive shifts in the composition of top carbon emitters over the years. While carbon emissions by the early industrialisers added massively to the rising atmospheric carbon concentration beginning in the 1800s, in the last 70 years, the emerging market economies have replaced some of them with their significantly high annual emissions.[27] The share of global cumulative carbon emissions for each of these countries therefore accounts for their long-term contribution to global warming. However, to make meaningful comparisons, it is important that such cumulative emissions are viewed in relation to the cumulative consumption needs of the evolving populations across these countries. Countries with larger shares in legacy emissions relative to their population needs over the years, should have an adequately larger stake in facilitating mitigation.
- Carbon cost of growth: The carbon cost of growth is defined as the ratio of percentage change in annual CO2 emissions to the percentage change in GDP in the same year, i.e., economic growth. The carbon cost of growth represents the responsiveness of a country’s CO2 emissions to its economic growth. In other words, the carbon cost of growth is a measure of the GDP elasticity of carbon emissions. The more elastic the national GDP to a change in the nation’s carbon emissions, the higher is the carbon cost of growth. Since the carbon cost of growth attempts to measure the cost of economic growth in terms of CO2 emissions, this measure is defined only in the case of positive economic growth. The carbon cost of growth provides information on the existence of decoupling between economic growth and carbon emissions, and whether this decoupling is absolute or relative. The carbon cost of growth is negative when economic growth is followed by a decline in carbon emissions. A negative carbon cost of growth represents absolute decoupling and is suggestive of green growth. On the other hand, a positive carbon cost of growth exceeding unity means that the rate of increase in carbon emissions is greater than the rate of economic growth and represents a case of ‘no decoupling’. The intermediate case is that of ‘relative decoupling’ and occurs when the positive carbon cost of growth is less than unity. The carbon cost of growth shows how farther a nation is from shifting its trajectory of economic growth in the direction of a green transition. The variable is included in the computation of the CPI to account for the progress made by G20 economies towards greening their economic growth.
- Theil Index of Carbon Inequality: In meaningfully tracking variations in global carbon emissions distribution and attributing them to national climate performance, another important aspect is often unexplored—i.e., within-country inequalities in carbon footprints. Global estimates for consumption-based within-country carbon footprints distribution suggest significant variations in per capita carbon footprints across population income groups. In 2019, the top 10 percent income earners of the world emitted one-third of the annual carbon emissions; while the bottom 50 percent emitted about 8 percentage points less.[28] At a national level, a large absolute gap between the actual per capita emissions and per capita carbon budget of each population group indicates overexploitation of the carbon budget leading to incremental global warming, on one hand, and on the other, limited energy access for the most vulnerable sections of the population. Based on this, the CPI uses a Theil Index measure of within-country carbon inequality[a] to account for inequalities in carbon footprints within the G20 countries, which also reflect, to some extent, on the equity of their respective climate action plans and strategies.
- Rate of per capita energy use relative to 2,000 Watts: This paper assumes that while economic growth can be envisioned as being decoupled from CO2 emissions through a switch to 100-percent renewable energy, it cannot be permanently decoupled from material and energy use. This is because economic activity requires certain minimum quantities of fundamental resources like land, water, and raw materials, and energy—which are non-substitutable. The physical realities of economic production define upper bounds to the energy and material efficiencies that allow decoupling.[29] As such, overconsumption of energy—even renewables—can result in exploitation and depletion of natural resources. There is a need to put a check on overconsumption of energy. While there is no universally accepted threshold that defines ‘overconsumption’, the global average rate of per capita energy use was 2,899 Watts in 2019.[30] The average rate of per capita energy use for nations belonging to the category of high human development was 2,164 Watts in 2019.[31] For the majority of those economies, the rate of per capita energy use was 2,000 Watts or less. This indicates that 2,000 Watts allows a country to maintain high levels of human development. Yet, countries differ in terms of the parameters which define their rate of energy use and thus there appears to be no exact threshold for the rate of energy use. This paper uses 2,000 Watts as a crude or indicative threshold for ‘overconsumption’ of energy. The ratio of a nation’s rate of per capita energy use to the aforementioned threshold for overconsumption of energy has been included as a variable in constructing the CPI.
- Energy efficiency of production (GDP per unit of Primary Energy Consumption): Energy efficiency of production is here defined as the reciprocal of the energy intensity of a country's GDP. Energy consumption in production processes contribute to GHG emissions—directly from fossil fuel combustion and indirectly through electricity generation. As the G20 economies and the rest of the world strive to ramp up their clean energy capacity, reductions in energy intensity of production through investments in energy efficiency can lead to possible pathways for early decommissioning of remaining non-renewable energy sources. Along with reducing overall consumption costs allowing for a smoother transition to a low-carbon economy, and ensuring sustainable consumption of clean energy moving forward—all of these complement the overall energy transition process.
- Renewable energy consumption (as a share of total final energy consumption): Total energy consumption required for production processes and human survival can be driven down only to a limited extent. Beyond a critical threshold level, transition to clean or renewable energy presents itself as the only solution to arrive at a low or net-zero carbon world. Developing renewable energy capacity, therefore, lies at the heart of climate mitigation strategies across the world. Renewable energy consumption can reduce dependence on fossil fuels for electricity generation, contribute to decarbonisation of growth processes, and serve as a more accessible, affordable and sustainable substitute source of energy to meet the growing needs of populations. Currently, only about 29 percent of the electricity demand worldwide is met by renewable sources, albeit with variations in the progress made by different countries.[32] Thus, the share of renewable energy in total final energy consumption of the G20 countries can serve as an effective indicator of their relative progress towards decarbonisation of energy needs and overall climate action.[b]
- Change in climate-regulating land cover: The interaction between land and climate is complex. Land cover has a role to play in climate regulation which refers to two dimensions: biophysical effects and biogeochemical effects. This analysis is concerned with the biogeochemical dimension of climate regulation which refers to the implications of land cover change for the global GHG concentration and the greenhouse effect.[33],[34] Land cover which has a positive impact on climate regulation includes woody crops, multiple or layered crops, grasslands, tree-covered areas, mangroves; shrub-covered areas, aquatic or regularly flooded shrubs and/or herbaceous vegetation, permanent snow and glaciers, inland water bodies, coastal water bodies and intertidal areas.[35] The change in climate-regulating land cover in 2019 as compared to 1992 of G20 countries has been included in the computation of the CPI. The intent is to take into account the impact of climate policy in preserving climate-regulating land cover.
- Change in climate-altering land cover: Certain land cover results from land use change such as deforestation, urbanisation and agricultural activity—which all contribute to climate change. Such land cover has a negative influence on biogeochemical processes involved in the global GHG concentration and, thereby, global warming. This includes artificial surfaces (like urban and associated areas) and herbaceous crops. The change in climate-altering land cover in 2019 from 1992 of G20 countries has been included in the construction of the CPI. The intent is to impose a penalty on the climate policy which has allowed climate-altering land cover to proliferate.
- Climate Policy Coverage: Policy initiative is a critical first step to climate action. Therefore, the proposed index uses a crude proxy for climate policy coverage across the G20 countries to account for their initiatives, at an institutional level, to combat climate change—particularly focused on climate mitigation strategies. While climate adaptation is also an important aspect of climate action performance, it is largely defined by the contextual realities and needs of each country and therefore does not allow for a linear comparison among different entities. For the present study, the indicator on ‘climate policy coverage’ only takes into consideration policy initiatives, without accounting for degree of adoption or implementation. There is an implicit assumption that the adoption or implementation has a direct bearing upon and is reflected adequately in the other input and output variables incorporated within the index. Based on the policy matrix developed by the Climate Policy Database,[36] we assign a score of 1 to each of the G20 members that have adopted at least one policy relating to a policy option, targeting a specific mitigation area, across the six specific sectors. In case a country has not adopted any related policy pertaining to a policy option, a score of 0 is assigned. After scoring the countries for each policy option and mitigation area across the sectors, the final scores reflecting overall coverage are arrived at as an average of the scores obtained across all sectors. A higher score for this indicator reflects a higher level of institutional initiative to combating climate change and therefore adds positively to the CPI.
c. Limitations
The present study, while attempting a comprehensive evaluation of the relative climate performance of the G20 countries through the proposed Climate Performance Index, acknowledges the following limitations:
- The CPI, like any other index, is a complete but non-exhaustive set of information. While the difficulties in establishing an exact definition of climate performance is recognised, the CPI interprets climate performance to be reflected adequately in the set of component indicators used for its construction.
- The index constructed here, while assessing overall climate performance of the G20 countries, does not factor in any aspect of climate adaptation in these countries. The contextual variations in adaptation needs and mechanisms present themselves as a significant challenge to a comparison between the G20 countries on this aspect.
- While the index builds upon the CBDR framework to evaluate climate performance, it does not include the financial wherewithal of individual countries as an indicator of their climate performance. Rather, it envisages climate finance as an instrument or action guided by the comprehensive Climate Performance Index—to ensure that the gaps in climate performance are adequately met through identification of due responsibilities, in addition to the countries’ capacities.
- Lastly, the index uses only a relatively crude proxy for institutional response or climate action of the G20 countries, at a national level—capturing the sectoral coverage of climate policies. It assumes that the gaps in policy adoption or implementation are reflected in the overall outcomes of climate performance.
Results and Analysis
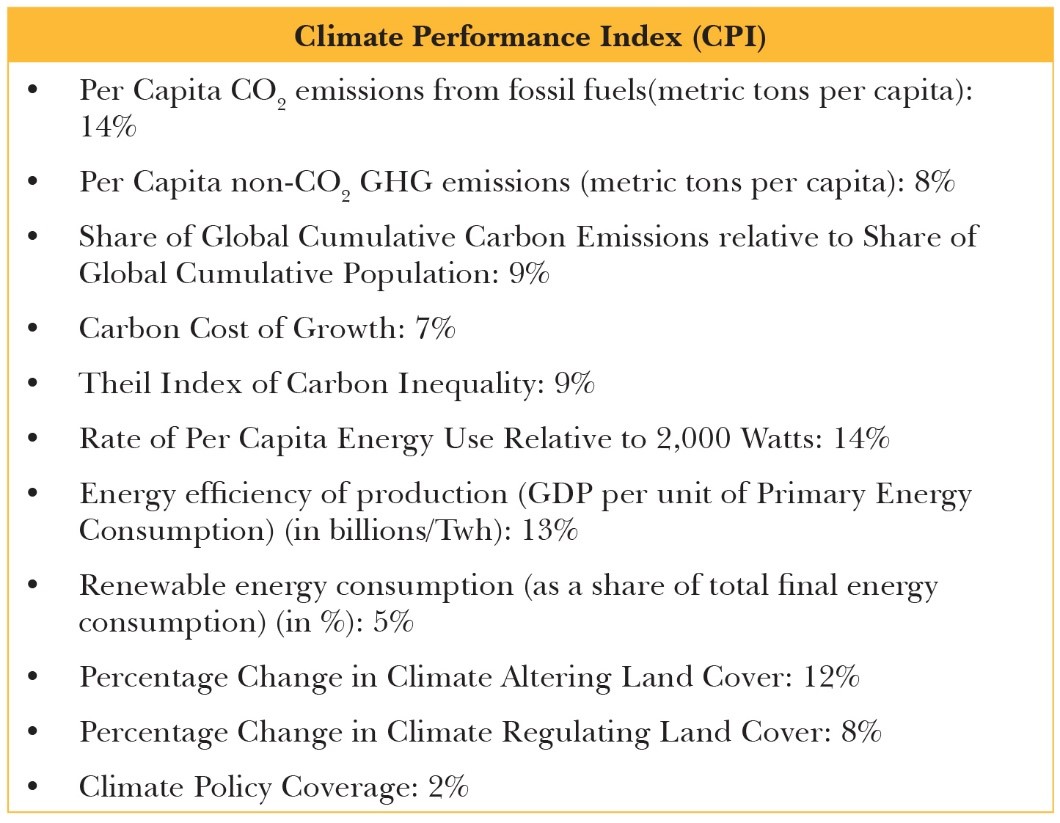
The final weight distribution obtained for the 11 component indicators of the CPI from the Principal Component Analysis are shown in Table 2.
Table 2: Weight Structure for the Climate Performance Index
Source: Authors’ own
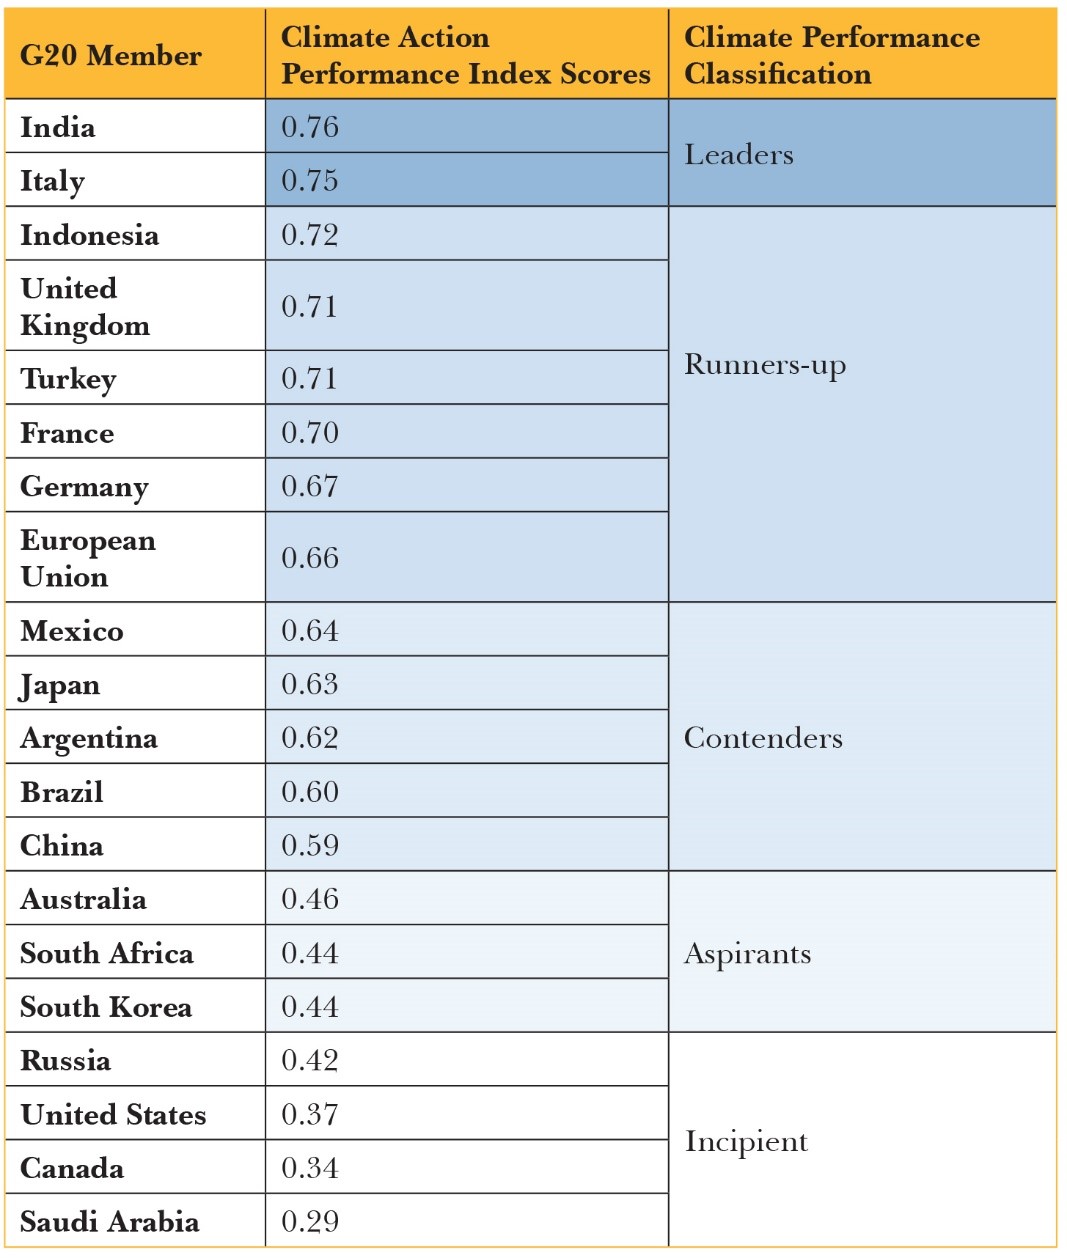
A mu-sigma analysis based on the members’ deviations from the average performance of the group has been performed to classify their climate performance, identify any trend towards clusterisation, and the potential gaps in climate mitigation performance across these classes. Table 3 shows the final scores obtained for the Climate Performance Index (CPI) in a descending order, with 1 being the maximum score. It also classifies the G20 members into five distinct stages of climate performance (from high to low). This enables us to identify any trend towards clusterisation or pockets of performance, and also to trace back the common factors, if any, that have led to a better-graded performance.
The classification is based on the following criteria, based on a mu-sigma analysis (assuming that the index scores are normally distributed):
Leaders: Index scores > μ + σ
Runners-up: μ + 0.5*σ < Index scores < μ + σ
Contenders: μ – 0.5*σ < Index scores < μ + 0.5*σ
Aspirants: μ - σ < Index scores < μ – 0.5*σ
Incipient: Index scores < μ - σ
where,
μ is the mean of the scores across the states/UTs;
σ is the standard deviation of the scores across the states/UTs.
Table 3: Climate Performance Index Scores for the G20 Countries
Source: Authors’ own
The following points outline the key findings based on an analysis of the CPI.
i. India, an emerging economy, ranks first among all G20 members in terms of overall climate performance, owing to its significantly low per capita contributions to carbon and GHG emissions; very limited share in legacy emissions relative to its population needs; least rate of per capita energy use; and significant efforts towards, not only preserving, but also expanding its climate-regulating land cover by 6 percent compared its 1992 levels. The country has also done well in undertaking climate policy initiatives and limiting the unbridled expansion of climate-altering land cover. However, there is considerable scope for improvement in developing energy efficiency in production and addressing inequalities in carbon footprints across different sections of the population, making way for further growth as a leader.
ii. Italy, one of the advanced member countries of the G20, also emerges as a top performer—with the least inequality in carbon footprints among its population; relatively low contributions to per capita global emissions (in terms of current levels and historical emissions); and high energy efficiency of production and a low carbon cost of growth, exhibiting an absolute decoupling between growth and carbon emissions. However, as developing energy efficiency in production reaches its limits, the country needs to focus on ramping up its renewable energy consumption, which currently stands at roughly 17 percent of its total final energy consumption. There is also scope for greater policy initiatives at an institutional level, particularly focused towards preservation and restoration of climate-regulating land cover that complement its climate mitigation strategies.
iii. On average, the emerging economies within the G20 perform slightly better than the advanced economies. However, the difference between the two clusters is not statistically significant.
iv. Among the advanced economies, the overall climate performance of the European countries including Italy, France, United Kingdom, Germany and the members of the EU is considerably better than the North American countries.
v. Besides emerging economies like India, Indonesia and Turkey performing exceedingly well, the Latin American countries in the group—i.e., Mexico, Argentina and Brazil—have also performed well compared to the remaining larger emerging economies. Argentina’s performance is notable in terms of institutional response to climate mitigation with good sectoral coverage; Brazil finds its strength in its massive renewable energy capacity—comprising as much as 47 percent of its total energy consumption; and Mexico does well in terms of sustainable per capita energy consumption but needs to focus on the within-country inequalities in individual carbon footprints.
vi. Among the G20 countries in East Asia, Japan and China score moderately in terms of their overall contributions to climate action. However, addressing the impact of economic activity on climate-regulating land cover and the challenge of within-country carbon inequality remains a priority for Japan and China, respectively.
vii. The two countries in North America—Canada and the United States—score significantly low across most indicators of climate performance, indicating that there are significant gaps that need to be filled in their mitigation efforts.
viii. Saudi Arabia shows the least progress in climate mitigation among all the G20 members—primarily owing to its high dependence on fossil fuels-based economic growth. As the threats of climate change become more apparent and the world continues to ramp up efforts at climate action, Saudi Arabia will need to figure out alternative avenues for growth fuelled by its non-hydrocarbon-based natural assets that do not present themselves as contradictions to its climate goals.
A robustness check of the rankings arrived at by the CPI index was undertaken by comparing them with the rankings of the CCPI index already mentioned earlier in the paper. The index has been chosen for the robustness check since it has been published annually since 2005 and is presented at the United Nations Climate Change Conference annually as well. This robustness check involves computing the rank correlation between the rankings of the present index and the CCPI index. The rank correlation coefficient is as high as 0.83 (statistically significant at 1 percent level of significance) which is reflective of the fact that despite being constructed using different methodologies, these indices capture the same fundamental phenomenon of climate performance among the G20 countries.
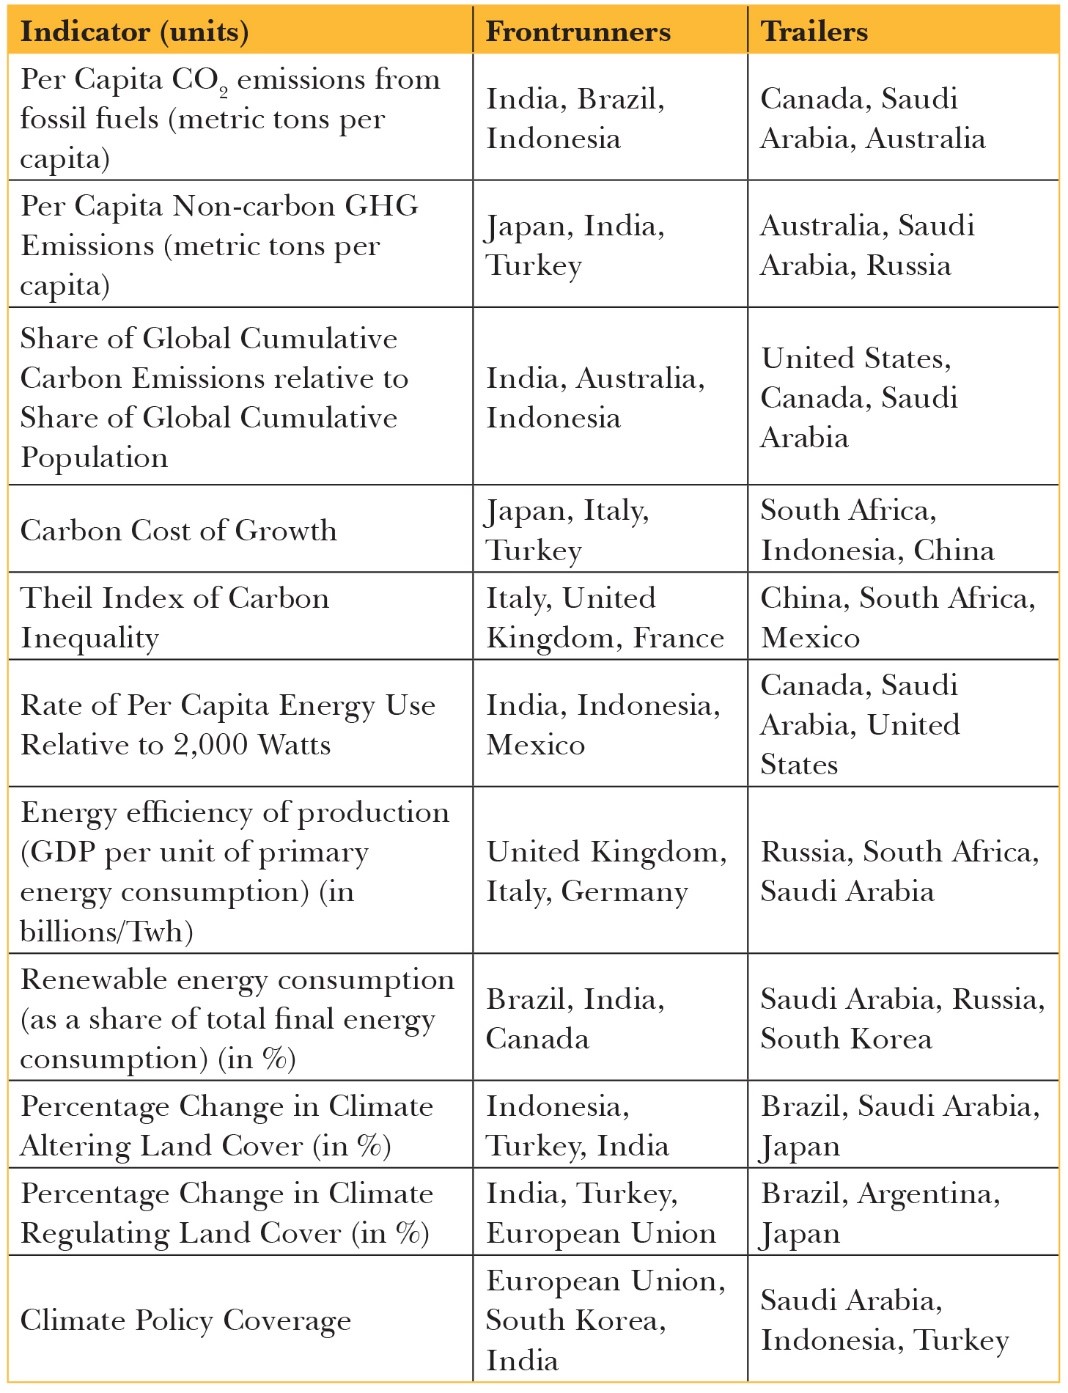
While performing relatively better than other G20 members in climate action, the leading countries do not achieve a perfect score of 1 on the Climate Performance Index. This shows that all G20 members have certain strengths that should be leveraged and weaknesses that need to be addressed while envisioning a broader strategy of national climate action—catering to specific climate goals and targets. The differences in the strengths and weaknesses of G20 nations in terms of their climate performance can be recognised only through a deeper look at their relative performance across the 11 component indicators.
Table 4 highlights these strengths and weaknesses by identifying the frontrunners and the trailers among the G20 countries, across all the component indicators. This, in conjunction with the sectoral priorities and sectoral gaps of national climate policies, can inform a gap analysis between the ‘frontrunners’ and ‘trailers’ (see Appendix 1). The successes of one country can serve as case studies to be emulated by other G20 members. This presents scope for future work in this domain.
Table 4: Performance of the G20 Countries, By Indicator
Source: Authors’ own
Recommendations
Following the preceding discussions on climate commitments of the G20 members and a comprehensive assessment of their climate performance as illustrated by the CPI, this paper offers the following recommendations.
1) Mainstreaming carbon budgeting into global climate action: Developing or emerging economies in the G20, such as India, Indonesia, Brazil, Mexico, Argentina, Turkey, account for lower shares of global cumulative historic emissions relative to their shares of global cumulative population up to 2019. This corroborates the hypothesis that the developed world has exhausted a very large fraction of the carbon budget and exploited the carbon space for achieving their development goals. The scores on the per capita carbon emissions from fossil fuels in 2019 inform that the expenditure of the carbon budget is still highly skewed in favour of the developed world despite having already achieved high development levels. It is well-known that access to energy is critical for development. Clearly, the developing world is being deprived of the carbon space that they need to achieve their development levels. It is only fair from the point of view of climate equity and justice that a significantly larger share of the remaining carbon budget be allocated to the developing world. In terms of climate action and policy, this translates to adjusting the national NDCs so as to allow a fair allocation of the carbon budget. This will require that while the global trajectory of emissions will limit global warming to below-2 degrees Celsius, the national trajectories reflect a fair allocation of the carbon budget, possibly by aiming for equal per capita CO2 emissions that are adjusted for the countries’ share in legacy emissions. Politically, it is difficult to get countries to agree on a fair allocation of the carbon budget. India’s G20 presidency can work to steer an acknowledgement among nations that there is a need for a fair allocation of carbon budget if the 2030 Agenda has to be realised and no one is to be left behind.
2) Sustainable consumption for climate change mitigation: The action demanded by climate change is not limited to a transition to a ‘green’ or low-carbon economy. If even a transition to 100-percent renewables is achieved, the possibility of excess consumption of energy remains. Assuming 2,000 Watts as the threshold rate of per capita energy use, most developed countries in the G20 grouping significantly exceed this threshold (see Table 5). Some countries such as the United States and Saudi Arabia, for example, consume five times the threshold. Canada, which has the largest per capita rate of energy use, consumes more than six times the threshold.
Table 5: Excess Consumption Relative to 2,000 Watts Among Select G20 Countries
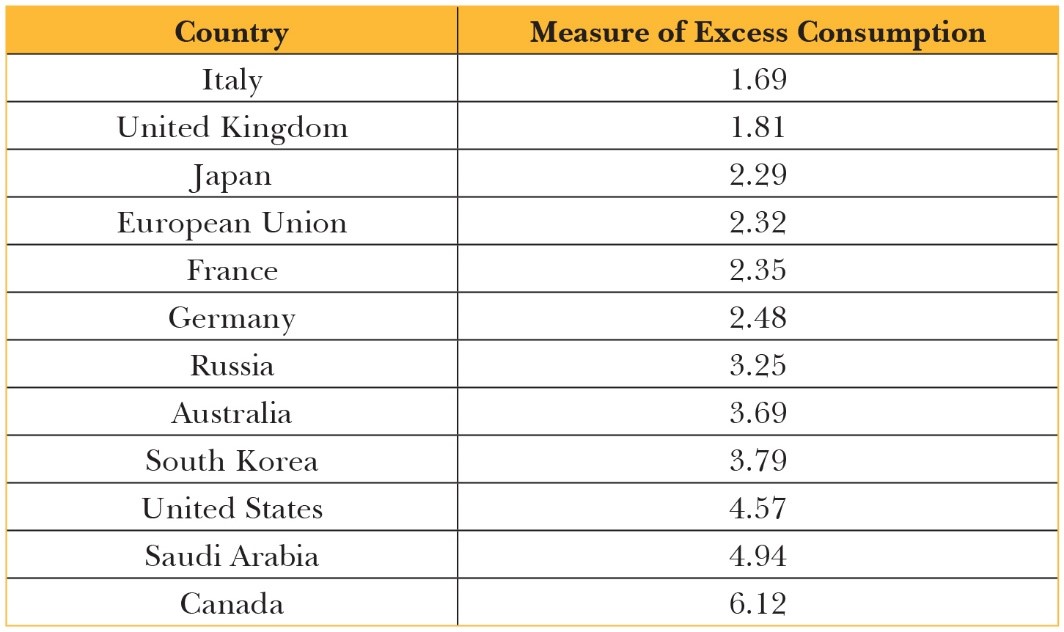
Source: Authors' own calculations, using data from Our World in Data[37]
Sustainable energy consumption is subsumed within the broader priority of SDG 12 i.e., sustainable and responsible consumption and production. India is already a frontrunner in pushing for SDG 12 in the particular context of climate change. In October 2022, India and the United Nations jointly launched the plan of action associated with the India-led global mass movement called Mission LiFE (Lifestyle for Environment). The plan involves nudging consumer-driven demand towards climate-friendly behavioural changes, enabling industries and markets to adjust supply to this changing demand and envisioning the necessary change in government-driven policy towards the achievement of SDG 12.[38] Among the G20 members, France, UK and Argentina have extended support to Mission LiFE.[39] India needs to consider using its G20 presidency as an opportunity to garner support of other members for Mission LiFE. India’s presidency can be used to begin developing the institutional, financial, regulatory and technical ecosystem necessary for effective implementation of this initiative.
3) Adoption of climate action that is sensitive to carbon inequality: Income and wealth inequalities are mirrored in the access to carbon by the rich and the poor. The disparities in consumption following from economic inequalities translates into carbon inequality. This phenomenon is prevalent not only in the developing economies of the G20 but also in the developed countries. The G20 countries need to pay heed to this phenomenon especially in the context of the impact of the policies that seek to impose a penalty on carbon emissions. It is important to take into account how these policies will affect the poor. Climate policies should not be defined in isolation from poverty alleviation programmes. Myopic climate policies can shift and increase the development burden of climate change on the poor. India needs to prioritise the conception of such policies as climate change mitigation and adaptation, and poverty alleviation are both important concerns for the nation. There is a need to develop climate policies that take into account concerns of poverty as part of global climate governance from the perspective of climate equity. India can leverage its G20 presidency to throw light on the need for climate change mitigation to be viewed in conjunction with global poverty concerns.
4) Protecting the climate-regulating land cover of the world: Between 1992 and 2019, the loss of climate-regulating land cover experienced by India has been the least among G20 nations. The preservation of climate-regulating land cover can be leveraged for climate action. India can develop a G20 action plan that is anchored in preserving climate -regulating land cover. India’s own experience in managing its climate-regulating land cover can be the lighthouse for recommendations for what to do as well as for what not to do in this context. It appears prima facie that India’s land use policy to preserve areas responsible for vital environmental functions and provide important ecosystem services, have been successful in India. The role of India’s land use policy in preserving its climate-regulating land cover needs to be assessed. Facts and lessons emerging from this assessment can feed as input for climate policy anchored in preserving climate regulating land cover. The G20 has in the past made climate change commitments relating to ecosystems and biodiversity loss. India’s presidency can formulate commitments that are informed by its own experience and can improve the management of climate-regulating land cover in other G20 countries.
5) Enabling a transition to green growth: Given their respective need for growth and the global necessity of carbon emissions reduction, it is fair that the developed countries experience absolute decoupling while the developing countries experience relative decoupling. Among the G20 nations, four countries deviated from this expectation. Saudi Arabia and Canada exhibited relative decoupling instead of absolute decoupling. Indonesia and South Africa registered a carbon cost of growth which exceeded unity, implying that the increase in carbon emissions exceeds the economic growth rate. These countries need to act urgently on strengthening their green growth strategies so as to reduce their carbon cost of growth. Adopting a green growth pathway demands financial wherewithal and the appetite for reduced rate of growth that may accompany green growth. Saudi Arabia and Canada have both these abilities. But this is not necessarily true of Indonesia and South Africa as well as other developing countries which experienced relative decoupling in 2019, but might soon need to decouple growth and carbon emissions in the absolute sense given the urgency of the climate crisis. These countries need assistance in the form of climate finance, technology transfer, knowledge sharing and exchange of best practices in developing a green growth strategy. This assistance needs to be provided in a manner that is conscious of the specific circumstances, realities and needs of the countries. For example, developing nations which need to be concerned about debt sustainability cannot be expected to increase their debt in the form of climate finance disbursements. India can champion the cause of the developing countries in the context of green growth through its G20 presidency. The G20 has previously adopted commitments relating to green growth, but these have never been articulated in terms of reducing the carbon cost of growth. India’s presidency could be the first to do so.
6) Prioritising expansion of renewable energy capacities: The performance of most G20 nations in terms of share of renewable consumption in total final energy consumption is not satisfactory. In fact, Brazil and India are the top two performers in terms of this indicator. Final energy consumption represents energy demand of end users such as agriculture, industry and households and excludes the needs of the energy sector itself. Both the developed and developing economies of the G20 need to increase the proportion of renewable energy capacities. Increasing renewable capacities and implementation of related policies can be an important focus area of India’s G20 presidency.
7) Coordination between national and sub-national governments in climate action: Successful climate action will require taking into account local realities into climate mitigation strategies. As such, coordination of national climate targets with climate action plans of subnational governance bodies is extremely important. India’s G20 presidency can develop a template of and articulate fundamental principles for this coordination. India’s presidency can seek to determine how sub-national governments can be engaged with at the multilateral forums like the G20 to address issues like climate change more effectively.
G20 Sectoral Priorities and Collective Action
Countries across the world have come up with specific commitments and policies towards meeting climate goals. However, the implementation of climate outcomes-targeted domestic policies is often met with resistance at various levels. Aligning strategies that simultaneously strive to achieve economic, social and climate goals can resolve these conflicts.[i]
Figure 1 shows a representative list of policy options across six key sectors—i.e., agriculture and forestry, land transport, buildings, industry, electricity and heat, and general climate action catering to five mitigation areas – change activity [1], energy efficiency, renewables, other low-carbon technologies and fuel switch, and non-energy related emissions – for emissions reductions, and their relative coverage across the G20 countries. Overall, the following set of policy instruments, while not exhaustive, provides for a comprehensive climate policy framework – to ensure sectoral transformation in achieving effective climate change mitigation.[ii]
Figure 1: Climate Policy Coverage in the G20 Countries, by Sector
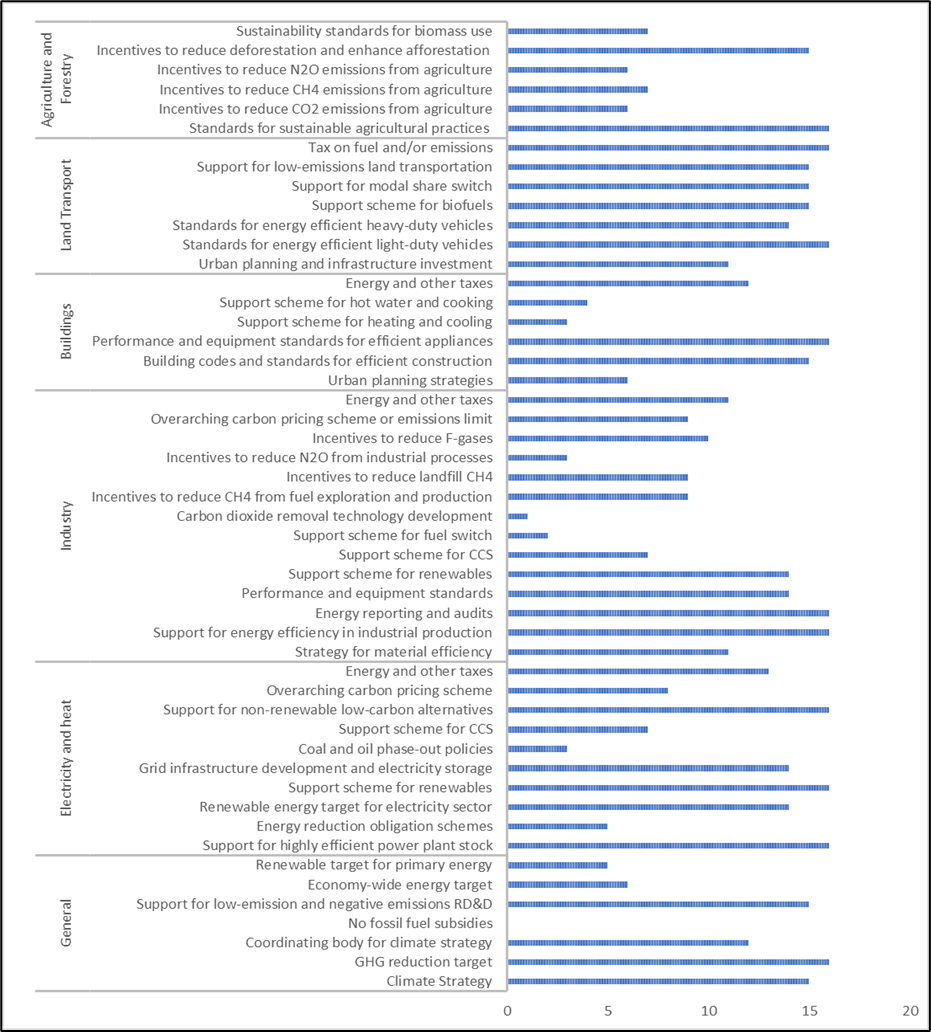
Source: Authors’ own, using data from Climate Policy Database[iii]
Among the G20 members, 21 out of the 50 policy options have less than 50-percent coverage. Coverage is particularly low for policies related to phasing out of coal and petroleum use, supporting fuel switch, and incentivising reductions in industrial activities that directly contribute to GHG emissions. None of the G20 countries have adopted policies to remove fossil fuel subsidies or even phase them out. Among all specific sectors, urban planning and construction activities-related policies show lowest levels of coverage—roughly 47 percent of the G20 countries have adopted or implemented related instruments, while 73 percent have domestic policies in place that cater to emissions reduction from the land transport sector. There is also substantial scope for improvement in policy coverage in the agriculture and forestry and industry sector among the G20 members. Further to this discussion, examining sectoral coverage of climate mitigation policies across individual G20 countries can illustrate country-specific sectoral priorities and highlight gaps that need to be addressed (see Appendix 1).
While policy formulation does not automatically translate into implementation and adoption that could result in emissions reduction, it certainly highlights the potential for climate change mitigation that remains uncovered by the system.[iv] Besides, while implementation remains difficult to measure, it does necessarily reflect in the countries’ climate-related outcomes. The following two cases provide some domestic climate policy highlights from the countries that have emerged as ‘leaders’ among the G20. These may be replicated by other member countries, with necessary changes in design and implementation.
The following paragraphs outline the policy highlights from the two frontrunners in the G20—i.e., India and Italy.
India
1) The EV Policy
Electric transportation in India is set to expand significantly in the near future. The country aspires to achieve 30-percent electrification of its entire vehicle fleet by 2030.[v] This is evident from the incentives and the direction of policymaking being pursued by the government in relation to manufacturing of electric vehicles, the uptake of hydrogen as a fuel, and adopting emerging technologies.[vi] Some of the important policies launched to support the growth of the EV market include:
- Faster Adoption of Manufacturing of Electric Vehicles Scheme – II (FAME – II): The FAME India initiative was launched to promote the use of electric/hybrid vehicles in India and reduce the use of ICE vehicles. The first phase of FAME provided demand incentives worth INR 3,590 million supporting 0.28 million hybrid and electric vehicles. The second phase of the scheme is targeted at electrification of public and shared transportation and creation of charging infrastructure.[vii]
- Production Linked Incentive Scheme (PLI), Battery Swapping Policy and Special Electric Mobility Zone: The Production Linked Incentive for Advanced Chemistry Cell Battery Storage seeks to encourage investments in India’s Giga scale ACC manufacturing facilities. The total pay-out of this scheme is INR 18,100 crore. The government’s battery-swapping policy will help lower battery costs, accelerate the sale of electric vehicles, and promote standardisation.[viii]
2) The National Green Hydrogen Mission
The National Green Hydrogen Mission envisions India as a global centre for the manufacture, use, and export of green hydrogen. The ultimate target of this mission is to boost India’s self-reliance in energy and accelerate decarbonisation of the industrial, transportation and energy sectors of the economy. The mission is focused towards generating several beneficial outcomes: employment generation; reduction of fossil fuel imports; and reduction of overall greenhouse gas emissions.
The Strategic Interventions for Green Hydrogen Transition Programme (SIGHT) will support two financial incentive schemes—one involving the production of electrolysers; and the other relating to the manufacture of green hydrogen. The mission will identify new end-use sectors and alternative production modes to support pilot projects. Regions that have the potential of emerging as green hydrogen hubs will be identified and developed. The mission seeks to create a favourable policy environment to incubate the green hydrogen ecosystem. A robust standards and regulatory regime is also targeted by the mission.[ix]
3) The Smart Cities Mission
The Smart Cities Mission endeavours to create cities that rely on smart solutions to provide basic infrastructure, a decent standard of living, and clean and sustainable environment. The mission is a centrally sponsored scheme in which 100 cities have been identified using a two-stage competition and 5,151 projects worth INR 2,050,180 million have been selected in the ‘smart city’ proposals. Till date, 1,987 projects have been completed, and 4,375 projects are being implemented. It mandates cities to source at least 10 percent of their energy requirements from solar and ensure that at least 80 percent of their buildings are energy-efficient. A Climate Smart Cities Framework has been formulated which defines climatic parameters such as energy, mobility, and air quality, to evaluate and monitor cities on their efforts to mitigate and adapt to climate change. This is a step towards ensuring sustainable lifestyles in the urban spaces.[x]
Italy
1) The National Recovery and Resilience Plan
The National Recovery and Resilience Plan is envisioned around three critical pillars of development: Digitisation and innovation; Ecological transition; and Social inclusion.
One of the objectives of this plan is to drive the strategy of ecological and environmental transition. Of the six missions underlying this plan, three of them relate to green growth and transition: Green Revolution and Ecological Transition, Infrastructure for Sustainable Mobility, and Education and Research.
§ The first mission on Green Revolution and Ecological Transition seeks to enhance the sustainability and resilience of the economy while guaranteeing an inclusive and just transition.
§ The mission on Infrastructure for Sustainable Mobility has the target of building a modern and sustainable transport infrastructure spanning across the country.
§ The mission on Education and Research is driven by the aim of developing a robust educational system, promoting digital and technical-scientific skills, strengthening research and encouraging transfer of technology.[xi]
2) The National Hydrogen Strategy
Italy’s national hydrogen strategy is poised to accelerate the decarbonisation of the economy by meeting a sizeable part of the energy demand and abating carbon emissions. The nation plans to use green hydrogen in transport, heavy industry and natural gas pipelines. The strategy stipulates the goal of expanding electrolysing capacity by 5 gigawatts over the 2021-2030 period. The mission is expected to generate significant gains in terms of jobs and accelerate economic growth. The strategy also plans for the development of hydrogen valleys and hubs of concentrated production and consumption.[xii]
3) Just Transition strategy
Italy is making significant efforts for a just transition especially in those regions that face serious socio-economic challenges in relation to climate transition, examples of which are Taranto and Sulcis Iglesiente. This ‘just transition’ strategy is underlined by economic diversification and employment generation in green sectors.
- Climate transition in Taranto is contingent on transforming steel production in the region through application of green business models, greater access and use of renewable energy and green hydrogen, and reskilling.
- Just transition in Taranto also envisions the enhancement of care services for gender inclusivity in labour markets. The transition aspires for the installation of wind turbines and geothermal applications for buildings, and the production of green hydrogen.
- The transition in Taranto also seeks to support the creation of green infrastructure to accelerate the restoration of degraded land and abatement of carbon emissions.
- The transition in Sulcis Iglesiente will boost economic diversification in green sectors, agriculture, tourism and marine sector. It will promote innovations by microenterprises that will fuel green transition.
- The transition will support SMEs and startups with research, innovation and technology transfer especially in the context of circular economy and assist them is optimising energy consumption by relying on clean technologies for the manufacture of solar, wind and marine energy. The transition is focused on building renewable energy communities to decrease energy poverty.[xiii]
An additional input to arriving at these outcomes, of course, remains the support from the international community. In the case of the G20 countries, the G20 forum’s collective action towards combating climate change presents one such important avenue. The G20 Research Group at the University of Toronto and the Centre for International Institutions Research of the Russian Presidential Academy of National Economy and Public Administration (RANEPA) have been undertaking the exercise of measuring the progress of compliance with the priority commitments made at each summit since 2008. The reports produced by these institutions monitor the actions of G20 members aimed at implementing a select subset of the commitments.
Table 6 represents an assessment of the climate change governance by G20 since 2008. It provides information on important indicators which throw light upon the evolution of climate change governance by G20. The commitments represent the intent of climate action expressed by G20 members while the compliance indicator is a proxy of the actual climate action undertaken by the G20 members. The commitments adopted by the G20 members in the domain of climate change revolve around the following issues: energy access, security and markets; energy efficiency and renewables; rationalising and phasing out of fossil fuel subsidies; adoption of advanced and clean technologies; resilient infrastructure; comprehensive adaptation strategies based on traditional and indigenous knowledge, ecosystem and communities based approaches and nature based solutions; tackling environmental challenges like biodiversity loss; addressing climate related risks; adoption of the Circular Carbon Economy; accounting and reporting of HFC emissions; sustainable and inclusive green growth; commitment to the Paris Agreement, NDCs and climate finance assistance.
Table 6: Climate Commitments at G20 Summits and Compliance Level
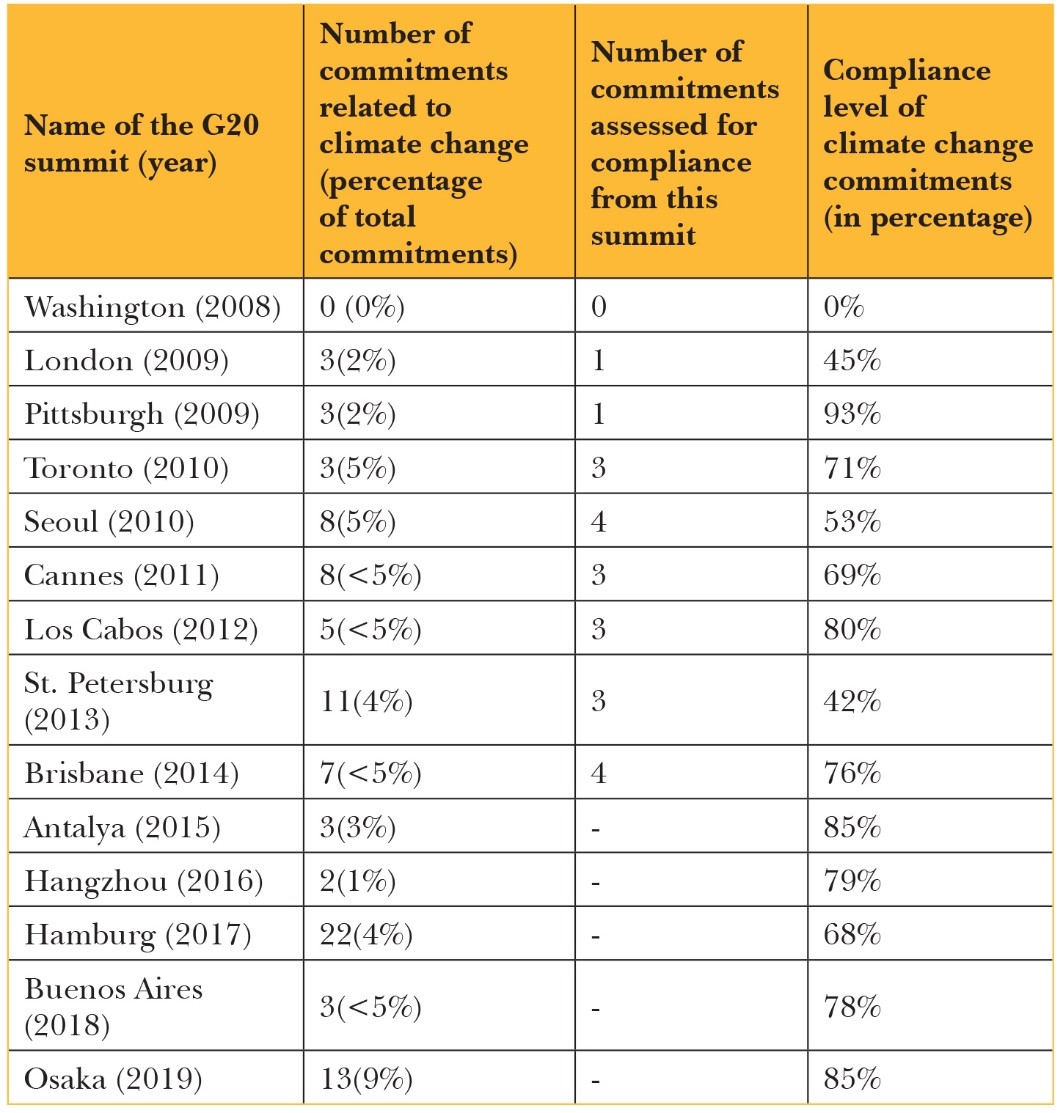
Note: ‘-’ information not available
Source: Creating Compliance with G20 and G7 Climate Change Commitments through Global, Regional and Local Actors,[xiv] G20 Climate Change Commitments and Compliance [xv]
While the highest level of compliance of 93 percent was registered for the commitments made at Pittsburgh (2009), the lowest level of 42 percent was registered for the commitments made at St. Petersburg (2013). Except twice, the level of compliance has always exceeded the halfway mark. This appears to indicate that the G20 member nations have actually demonstrated a satisfactory level of compliance with the commitments they have made. However, the commitments for which assessment is undertaken represent only slightly more than one-third of all commitments made.
[1] ‘Change activity’ refers to changes in the levels of energy service demand and resource use efficiency for climate mitigation.
[i]Mildenberger, Bergquist, and Stokes, “Combining Climate, Economic, and Social Policy Builds Public Support for Climate Action in the US”
[iii] “Preparation of the Policy Matrix”
[iv] Leonardo Nascimento, Takeshi Kuramochi, Gabriela Iacobuta, Michel den Elzen, Hanna Fekete, Marie Weishaupt, Heleen Laura van Soest, Mark Roelfsema, Gustavo De Vivero-Serrano, Swithin Lui, Frederic Hans, Maria Jose de Villafranca Casas & Niklas Höhne, “Twenty Years of Climate Policy: G20 Coverage and Gaps”, Climate Policy, Vol. 22, issue no. 2, Pp 158–74, February 7, 2022, https://doi.org/10.1080/14693062.2021.1993776
[vi] "India’s EV Economy: The Future of Automotive Transportation”
[vii] Ministry of Environment, Forest and Climate Change, Third Biennial Update Report to the United Nations Framework Convention on Climate Change. Ministry of Environment, Forest and Climate Change, Government of India
[x] Ministry of Environment, Forest and Climate Change, Third Biennial Update Report to the United Nations Framework Convention on Climate Change
[xvi] Climate Policy Database, “Countries”
Conclusion
India’s G20 presidency is coming at a time that is extremely critical for global climate action. The county has the opportunity to steer global climate governance in a direction that will adequately address issues that are material for effective climate action but were previously ignored. India can emerge as a champion of climate cooperation between the global north and the global south. Global climate governance in its current form does not adequately incorporate concerns of climate justice and equity. India has the opportunity to change this in its presidency.
This report has attempted to assess climate action performance of G20 countries from the perspective of the CBDR principle. Its findings can assist G20 countries in revisiting their climate policies and improving their contribution to climate change mitigation. The report highlights the existence of significant divergences in the overall climate action performance of the G20 countries. Compared to the advanced economies, most of the emerging economy members within the G20 have performed significantly well in resource use efficiency and targeted emissions reduction for climate mitigation.
At the same time, it is evident that none of the G20 members emerge as absolute winners with respect to their climate action strategies and outcomes. Each country has its strengths that it can play upon to advance its climate goals, and some pressing stress points that it needs to address to improve its climate performance in the long term. The comprehensive assessment undertaken here points out some of these relative strengths and weaknesses of the G20 countries. The report outlines some feasible recommendations that can ensure effective and equitable G20 climate action.
These recommendations can act as an input in defining the agenda of the G20 Climate Sustainability Working Group and can be instrumental in developing a voluntary framework that can strengthen global climate action through the establishment of specific institutional arrangements that ensure consistent achievement of targets and commitments. Comprehensive assessments made in this report can be extended to a G20-plus model, capturing experiences and realities of climate performance in the most underdeveloped nations and making recommendations based on these assessments that can broaden the ambit of global climate action.
Appendices
1: Sectoral Climate Policy Coverage for the G20 (in percent)
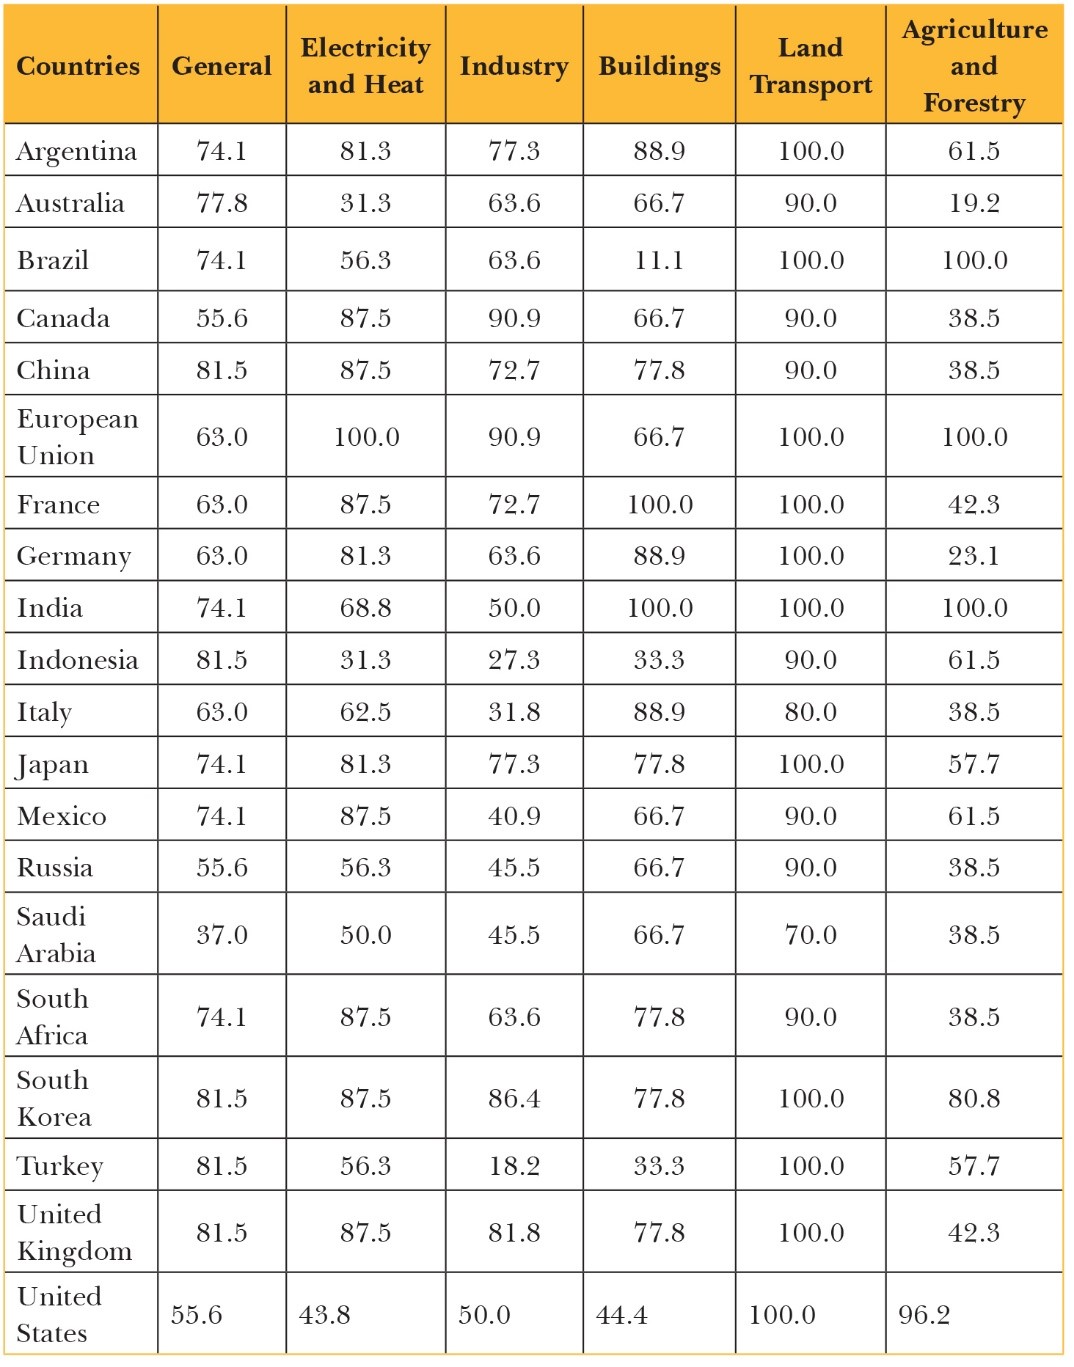
Source: Authors’ calculation, data from: Climate Policy Database[i]
2: Correlation Matrix for Component Indicators
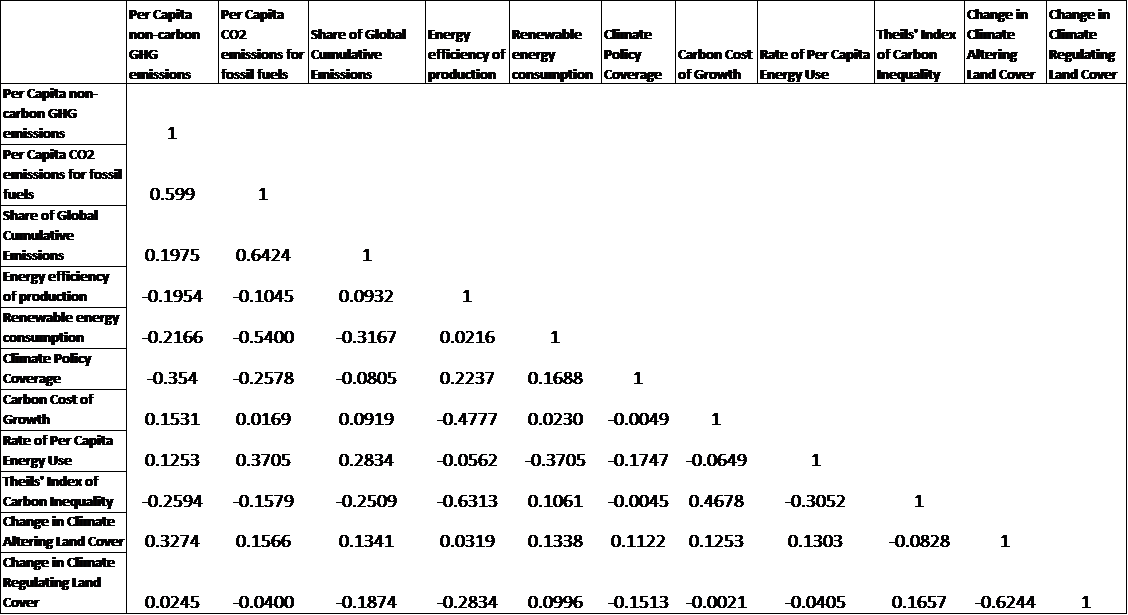
Source: Author’s own calculations on STATA 14.0
Renita D'Souza is a Fellow at ORF, Mumbai.
Debosmita Sarkar is a Junior Fellow at ORF, Kolkata.
The authors thank Kritika Gaba, former research intern at ORF, for the research assistance.
[i] Climate Policy Database, “Countries”
Endnotes
[a] The Theil Index of Carbon Inequality has been calculated, using emissions share data for top 10%, middle 40% and bottom 50%, based on the following calculation:
[b] The renewable energy consumption as a share of total final energy consumption for the European Union has been calculated as an average of individual member countries’ shares for the same indicator due to paucity of disaggregated data that can directly allow for calculation of the overall figure.
[c] ‘Change activity’ refers to changes in the levels of energy service demand and resource use efficiency for climate mitigation.
[1] “Group of Twenty - G20”, Ministry of External Affairs, October 27, 2011.
[2] Brittaney Warren, “G20 2021 Rome Climate Change Performance”, G20 Information Centre, December 27, 2021.
[3]Johannes Friedrich, Mengpin Ge, and Andrew Pickens, “This Interactive Chart Shows Changes in the World’s Top 10 Emitters,” World Resources Institute Insights, World Resources Institute, December 10, 2020.
[4] Brittaney Warren, “G20 2021 Rome Climate Change Performance”
[5] G20 Information Centre, “Chair’s Summary: Energy Transitions Ministers Meeting 2022”, G20 Information Centre, G20 Research Group, August 31, 2021.
[6] “Climate Action Tracker”, NewClimate Institute and Climate Analytics.
[7] Dido Gompertz, “Keeping 1.5 Alive”, E3G, May 23, 2022.
[8] Germanwatch, “Climate Change Performance Index”, November 11, 2022.
[9] “Climate Action Tracker”
[10] The World Bank, “CO2 Emissions (Metric Tons per Capita) | Data”, World Development Indicators.
[11] Climate Watch, “Greenhouse Gas (GHG) Emissions”.
[12] Hannah Ritchie, Max Roser, and Pablo Rosado, “CO₂ and Greenhouse Gas Emissions”, Our World in Data, May 11, 2020.
[13] Robbie M Andrew and Glen P Peters, “The Global Carbon Project’s Fossil CO2 Emissions Dataset”, Zenodo, October 17, 2022.
[14] The World Bank, “GDP Growth (Annual %) | Data”, World Development Indicators.
[15] WID - World Inequality Database, “Carbon Emissions Per Capita”.
[16] Hannah Ritchie, Max Roser, and Pablo Rosado, “Energy Production and Consumption”, Our World in Data, October 27, 2022.
[17] Ritchie, Roser, and Rosado, “Energy Production and Consumption”
[18] The World Bank, “GDP (Current US$)”, World Development Indicators.
[19] The World Bank, “Renewable Energy Consumption (% of Total Final Energy Consumption),” World Development Indicators.
[20] International Monetary Fund, “Land Cover Accounts”.
[21] “Land Cover Accounts”
[22] Climate Policy Database, “Countries”.
[23] Nilanjan Ghosh, Roshan Saha and Soumya Bhowmick, “SDG Index and Ease of Doing Business in India: A Sub-National Study”, ORF Occasional Papers, Observer Research Foundation, June 17, 2019.
[24] Climate Watch, “Greenhouse Gas (GHG) Emissions”
[25] Climate Watch, “Greenhouse Gas (GHG) Emissions”
[26] United States Environmental Protection Agency, “Understanding Global Warming Potentials”, Overviews and Factsheets, January 12, 2016.
[27] Debosmita Sarkar, “Addressing Carbon Inequalities through Development Cooperation”, ORF Expert Speak, Observer Research Foundation, July 30, 2021.
[28] Lucas Chancel, “Global Carbon Inequality over 1990–2019”, Nature Sustainability, Vol. 5, Issue no. 11, Pp. 931–38, September 29, 2022.
[29]James D Ward, Paul C. Sutton, Adrian D. Werner, Robert Costanza, Steve H. Mohr, and Craig T. Simmons, “Is Decoupling GDP Growth from Environmental Impact Possible?”, PLOS ONE, Vol. 11, Issue no. 10, October 14, 2016.
[30] Our World in Data, “Energy Use per Person”.
[31] “Reports and Publications”, Human Development Reports, United Nations, 2022.
[32] “Renewable Energy – Powering a Safer Future”, United Nations.
[33]United States Geological Survey, “How Do Changes in Climate and Land Use Relate to One Another? | U.S. Geological Survey”, Intergovernmental Panel on Climate Change.
[34] Intergovernmental Panel on Climate Change, Climate Change and Land: IPCC Special Report on Climate Change, Desertification, Land Degradation, Sustainable Land Management, Food Security, and Greenhouse Gas Fluxes in Terrestrial Ecosystems, 1st ed., Cambridge University Press, 2022.
[35] Climate Change Dashboard, “Land Cover Accounts,” October 8, 2022.
[36] Climate Policy Database, “India”.
[37] Ritchie, Roser, and Rosado, “Energy Production and Consumption”
[38] Press Information Bureau, “PM Launches Mission LiFE at Statue of Unity in Ekta Nagar, Kevadia, Gujarat”, October 20, 2022.
[39] Press Information Bureau, “Congratulatory Messages on the Launch of Mission LiFE from Heads of States/Governments”, October 20, 2022.
[40]Mildenberger, Bergquist, and Stokes, “Combining Climate, Economic, and Social Policy Builds Public Support for Climate Action in the US”
[41]Climate Policy Database, “Preparation of the Policy Matrix”, G20 Policy Coverage.
[42] “Preparation of the Policy Matrix”
[43] Leonardo Nascimento, Takeshi Kuramochi, Gabriela Iacobuta, Michel den Elzen, Hanna Fekete, Marie Weishaupt, Heleen Laura van Soest, Mark Roelfsema, Gustavo De Vivero-Serrano, Swithin Lui, Frederic Hans, Maria Jose de Villafranca Casas & Niklas Höhne, “Twenty Years of Climate Policy: G20 Coverage and Gaps”, Climate Policy, Vol. 22, issue no. 2, Pp 158–74, February 7, 2022.
[44] Aditi Singh, “India’s EV Economy: The Future of Automotive Transportation”, Invest India, February 3, 2023.
[45] "India’s EV Economy: The Future of Automotive Transportation”
[46] Ministry of Environment, Forest and Climate Change, Third Biennial Update Report to the United Nations Framework Convention on Climate Change. Ministry of Environment, Forest and Climate Change, Government of India
[47] Prabash Shukla, “Government Policies and Incentives for Electric Vehicles in India,” March 3, 2022.
[48] “Cabinet approves National Green Hydrogen Mission”, Ministry of New and Renewable Energy, Government of India, January 04, 2023.
[49] Ministry of Environment, Forest and Climate Change, Third Biennial Update Report to the United Nations Framework Convention on Climate Change
[50] “The National Recovery and Resilience Plan (NRRP),” Ministry of Economy and Finance, Government of Italy, May 26, 2021, https://www.mef.gov.it/en/focus/The-National-Recovery-and-Resilience-Plan-NRRP/
[51] “Italy Invests in Green Hydrogen,” International Trade Administration, U.S. Department of Commerce, United States of America, April O1, 2021.
[52] “EU Cohesion Policy: €1 billion for a just climate transition in Italy”, Press Release, European Commission, December 20, 2022.
[53] John Kirton, Brittaney Warren and Jessica Rapson, “Creating Compliance with G20 and G7 Climate Change Commitments through Global, Regional and Local Actors,” Policy Commons, April 1, 2021.
[54] Brittaney Warren, “Research Report: G20 Climate Change Commitments and Compliance”, November 28, 2016.
[55] Climate Policy Database, “Countries”
The views expressed above belong to the author(s). ORF research and analyses now available on Telegram! Click here to access our curated content — blogs, longforms and interviews.

 PDF Download