Despite sustained reduction in COVID-19 cases from initial hotspots located in Europe and the US, many new countries with large increases in the case load have emerged across the world. This has taken the official number of recorded cases to around 9 million, with yet another daily high of more than 183,000 new cases recorded on 22 June.
Unfortunately, India is one of those new global hotspots, and is consistently among the top three countries with the highest daily number of cases. As the World Health Organization (WHO) puts it, all countries are facing a delicate balancing act: between protecting the health of their people, while minimising the social and economic damage. Wearing masks, maintaining physical distance, finding and testing suspected cases, isolating and treating the confirmed cases early, tracing and quarantining contacts of cases, and protecting health workers are proven measures in the world’s fight against this pandemic.
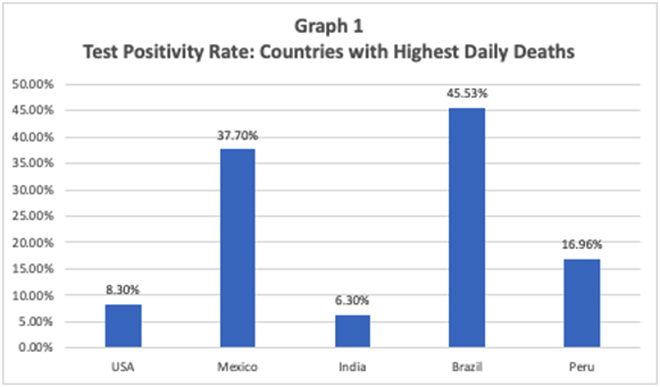
India tests around 190,000 samples per day now, and has come a long way from February when 100 samples were tested per day. Of the five countries that reported the highest number of deaths on 22 June, India has the lowest COVID-19 test positivity rates, even lower than USA (Graph 1). This may mean that questions about the adequacy of India’s overall level of testing may be exaggerated—at least relatively speaking—given that India still predominantly tests suspected cases and contacts and yet, has a very low test positivity rate. At the same time, there are stark regional variations within India. Given India’s continent like diversity, the national average may not mean much, necessitating a look at the state level data.
 Source: ORF Coronavirus Tracker
In mid-March, experts compared India’s number of tests conducted per million population to Thailand and Vietnam, and suggested it was too low. In the next few months, India has overtaken Vietnam, and is nearing Thailand in its testing levels. However, by itself this metric does not mean anything. Thailand and Vietnam were successful in reducing the spread of the virus early on, and their current levels of cases and deaths per million population are considerably lower than India. Not just testing, but timely deployment of testing is key.
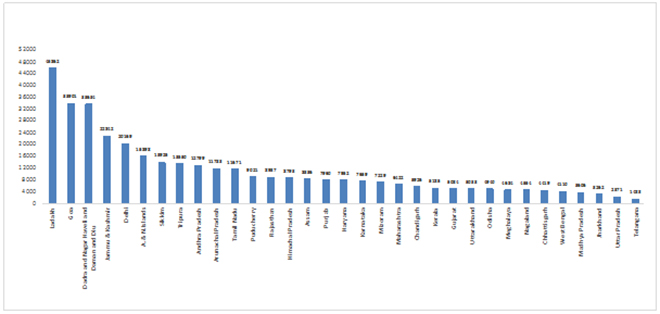
Graph 2: Number of Tests Conducted Per 1 Million Population
 Source: ORF Coronavirus Tracker
A look at the state level progress of the pandemic as well as testing numbers will bear this out. As Graph 2 shows, India has huge inter-regional differences in testing levels, ranging from Ladakh that has 45862 tests per million population to Bihar with 1314 tests per million population. Kerala’s relatively low number of tests per million population—at 5185, very close to the national average—may look like running counter to WHO’s dictum: “test, test, test”. However, Kerala managed to control the spread considerably with strategic testing; which was very aggressive to start with. With cases at manageable levels, Kerala’s test numbers went down relatively in the interim. With the risk of infection increasing with both domestic and international migrants returning, the numbers are picking up pace again.
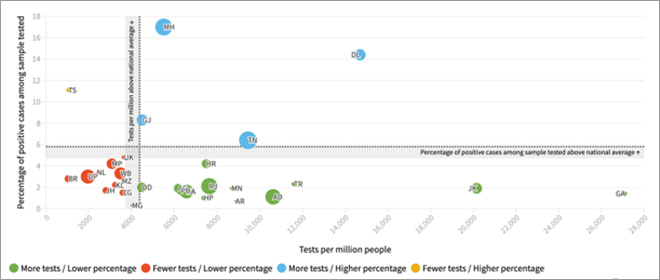
Graph 3: Tests Per Million Population and Test Positivity
 Source: https://science.thewire.in/covid19
Barring a few states, it needs to be said that testing in India, within the constraints of a low overall number, is somewhat optimally distributed across the states according to need. As Graph 3 shows, four out of all the five states (barring Telangana) that show test positivity rates higher than 5% have a higher number of tests per million than the national average. It is to be noted here that the WHO had advised governments that before lifting lockdown, test positivity rates should remain at 5% or lower for at least 14 days. In the case of all five states showing a high test positivity rate—namely Tamil Nadu, Telangana, Delhi, Gujarat and Maharashtra—there is a need to be more aggressive with testing. As Graph 4 shows, these are mostly the same states reporting the highest number of deaths, signifying a need to find and treat cases early, with the aim of reducing mortality.
Graph 4: COVID-19 Deaths in States with More Than 1000 Confirmed Cases
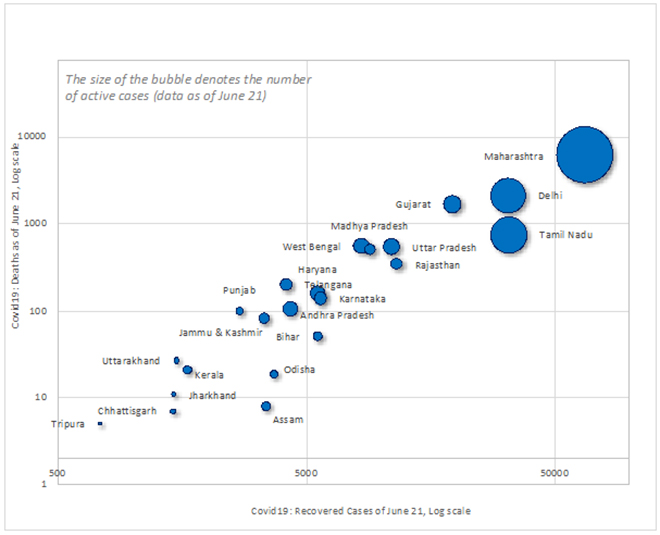 Source: ORF Coronavirus Tracker
The case of Uttar Pradesh stands out showing a relatively low impact of COVID-19 given its proximity to Delhi—which has the second highest number of cases and deaths in India. This huge Indian state has roughly the same population as Pakistan. Pakistan has 181,000 cases and 3590 deaths while Uttar Pradesh has managed to handle the pandemic better till now with 18,300 cases and 569 deaths. Interestingly, it also has one of the lowest numbers of tests per million population in the country, as well as test positivity rate. Bringing back a considerably high number of migrant workers home was a step that was expected to cause a surge of cases. However, Uttar Pradesh was able to contain the spread, and no particular district has shown surges as a result of uncontrollable clusters. The existing cases are distributed across districts, and with improved testing and a low positivity rate signifying a low spread within community, the state is expected to continue to control the epidemic at least in the short run.
Graph 5: Number of Tests Conducted Per Day
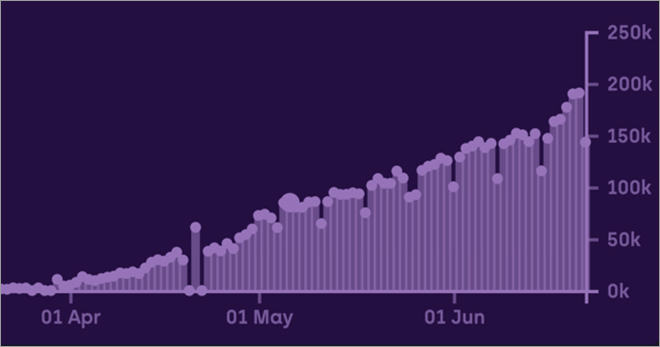 Source: https://www.covid19india.org/
However, with India opening up, things could change pretty fast. As the fight against COVID-19 intensifies and the virus takes root in the community, an interesting pattern one observes is the fall in the numbers of tests conducted every weekend (Graph 5)—like clockwork. It is a phenomenon observed across many countries. However, we need to keep in mind that the novel coronavirus does not take any weekend off.
The views expressed above belong to the author(s). ORF research and analyses now available on Telegram! Click here to access our curated content — blogs, longforms and interviews.


 Source:
  Source:
  Source:
  Source:
  Source:
  PREV
PREV


