
First originating from Wuhan, China, COVID-19 has spread like a wildfire across the globe in the past few months. It not only displayed deficiencies in global health systems, but also unearthed the deep-seated flaws in their economic and social systems.
Currently, the worst impacted country is the United States of America with over 4 million cases, followed by Brazil with over 2 million cases; and India with over 1.5 million confirmed cases. Among other worst affected nations are Russia, with over 800,000 cases and United Kingdom, with over 300,000 cases.
It is worth observing that in most of these countries, their commercial capitals—New York City, London and Mumbai—have been terribly hit by the pandemic. Characterized by high levels of economic activity, population density and migration, these urban centers have witnessed the highest caseloads.
While absolute poverty levels differ across these cities, rapid urban development has led to the rise of poor communities—that is people living in sub-par housing conditions with relatively lower economic opportunities, and access to basic amenities. The urban rich and the urban poor present stark differences in their socio-economic conditions resulting in high levels of income inequality in these cities. The skyrocketing housing and rent values also end up concentrating certain economic groups in particular areas of the city, thereby quite literally creating walls between the urban rich and poor.
While these cities are similar in broad aspects, their health systems differ in terms of access, availability and affordability. The degrees of privatisation and government intervention also contrast. Despite the varying nature of health systems, a similar trajectory of COVID-19 fatalities and caseloads are observed in these cities.
New York
America’s financial capital and most populated city, New York, currently faces over 200,000 covid-19 cases and over 22,000 deaths. With an average household income of $60,762, NYC is a largely mixed income city - the average household incomes ranges from $18,000 to $140,000. New York is divided into five large boroughs and within those, areas can be identified by their pincodes. A pincode-wise analysis of NYC’s Covid-19 impact revealed that the worst affected sub-regions of NYC are largely low income neighbourhoods with Black or Hiic majorities.
Of the 21 worst affected pincodes of NYC (those with a death/1,000 rates higher than or equal to the NYC average of 3.2), 76% were below average income neighbourhoods (median household income range: $20,000-$55,000), while only three pincodes saw household incomes over the city average. Over two thirds of these neighbourhoods were African American or Hiic majority areas.
The worst affected pincode of NYC is Spring's Creek (11239) with a death per 1,000 rate of 6, which is over four times the city average. Spring’s creek has a very low median household income ($27,104) and the neighbourhood is primarily black (57.1%). Moreover, Spring’s Creek has the highest concentration of people over 65 in the city, which may offer insight into the soaring death rates.
Figure 1 New York City: Death per 1000 population vs Proportion of minority population for the worst affected pin-codes
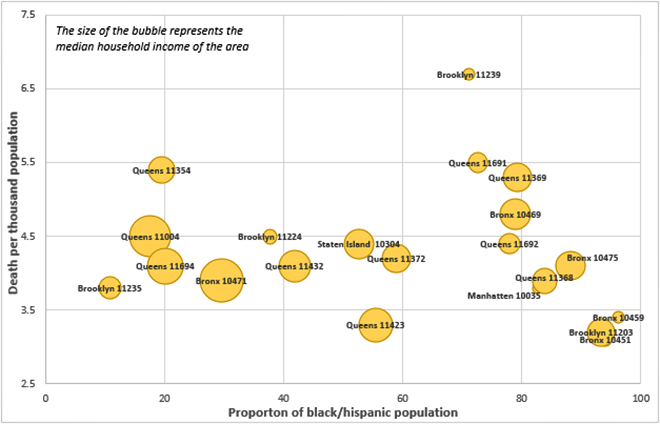 Source: https://projects.propublica.org/graphics/covid-nyc
Bronx is another one of New York’s worst affected boroughs, recording the highest number of hospitalisations and deaths. Despite Manhattan having a higher population, Bronx’s case fatality rate of Covid-19 is double than that of Manhattan. Bronx has also displayed higher than average rates of asthma, diabetes and hypertension–some of the nine illnesses linked with covid complications. Moreover, the Bronx itself has historically observed a lower life expectancy rate in comparison to other boroughs, with one of the lowest health outcomes among New York’s other counties. The borough is predominantly African American and the trajectory of the Bronx’s covid deaths indicates a larger issue in the American Health system—the dense inequity between the health outcomes of black and white people. African-American’s are twice as likely as to die of cardiovascular diseases as compared to whites and are statistically at a higher risk of being diabetic.
Similarly, the other minority group, Hiics--largely consisting of immigrants from Latin American nations— witness gaps in the economic/social spheres, compared to white Americans. Research shows that 1 in 4 Hiic people live below the poverty line, and 1 in 3 have not completed high school.
These disparities appear to be results of the institutional oppression faced by these racial/ethnic minorities leading to political, economic and social deprivation as well as low social mobility. Hence, we can say that like most other phenomena, the pandemic has amalgamated itself with the societal structures and institutions of regions, thereby affecting certain communities more aggressively than others.
Figure 2 New York City: Ethnicity (standardised) v/s Coronavirus death per 100,000 population
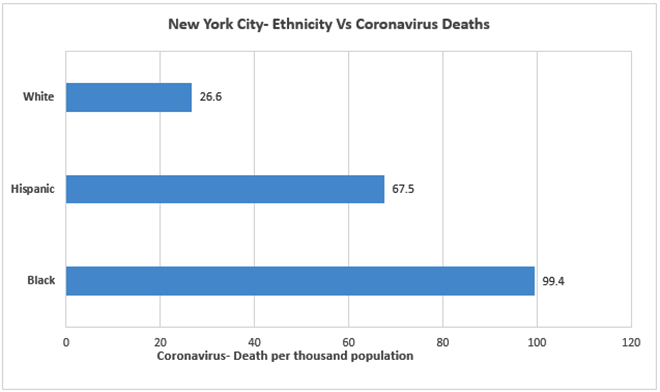 Source: https://www.apmresearchlab.org/covid/deaths-by-race
London The capital of the United Kingdom, is also the worst infected city in the country. London forms 15% of the UK's total population and constitutes over 21% of the UK's covid-19 cases.
One of the worst affected boroughs of London, Brent currently produces the highest case rate in London with over 1,495 cases, followed by Newham that has over 1,000 cases and Hackney with over 659 cases. Meanwhile, the wealthier boroughs of London like Kensigton and Westminster observe comparatively low case rates of over 505 and 676 respectively along with a lower number of deaths.
Table 1 London Boroughs with highest Death per thousand population
| Name |
Median HH income (£) |
Deaths per 100,000 (age standardised) |
| London |
£30,677 |
137.6 |
| Newham |
£23,426 |
201.1 |
| Brent |
£28,637 |
216.6 |
| Haringey |
£29,910 |
185.1 |
| Hackney |
£28,097 |
183.3 |
COVID-19 has stressed the health system, leading to increased disparity in health care provision. The persisting gaps in the health system have increased, with the poor and vulnerable societies dealing with the brunt of the stress. Hackney, has the second highest population density and Haringey is the ninth most deprived borough of London. Brent on the other hand, experiences very high tuberculosis rates (89 per 100,000) in addition to high levels of child poverty.
Newham is an especially impoverished borough with nearly 48% of its residents living in poverty. Moreover, a history of high levels of cardiovascular diseases and diabetes have contributed to the high mortality rate of the borough. Newham records the highest rates of tuberculosis in London (107 per 100,000).
The United Kingdom’s Office of National Statistics unveiled data that highlights that 10% of the most deprived pincodes in England and Wales had a death rate double that of the most affluent zip codes, thus depicting a linkage between pincodes and the fatality of the pandemic.
Mumbai
With over 100,000 cases, India’s financial capital, Mumbai, has been the worst affected by Covid-19.Urbanisation and migration have augmented the growth of urban poor populations, most of whom reside in the slums and chawls of the city. An estimated 42% of the city’s households live in slums, despite slums occupying just 7% of Mumbai’s land area.
Mumbai’s wards on an average see around 47% of their populations being slum dwellers. The socio-economic disparities in Mumbai have only been enhanced by the pandemic, where even though the poor have less chances of contracting the virus due to its spread through international travel, their likelihood of succumbing to the disease seems higher.
Figure 3 Mumbai Ward-wise Slum population % vs. Case fatality rate %
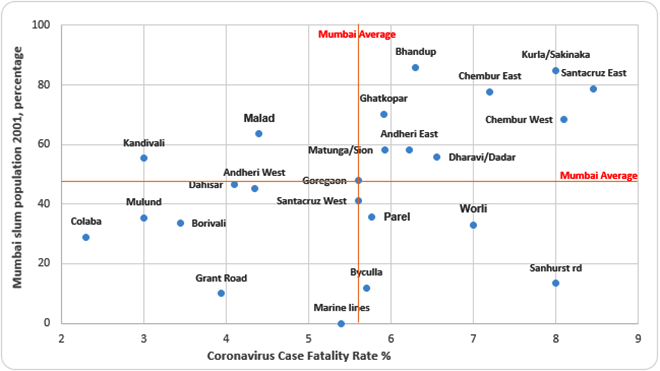 Source: Director of Census Operation, Maharashtra, Census 2001 & http://stopcoronavirus.mcgm.gov.in/assets/docs/Dashboard.pdf
A ward wise analysis of Mumbai’s case fatality rates and proportion of slum populations reveals that a majority of wards with above average case fatality rates also had above average proportions of slum-dwellers along with low cases/1,000 rates.
Table 2 Mumbai Wards with the highest Coronavirus Case Fatality Rate
| Ward |
Case fatality % |
Cases/1,000 |
Slum population % |
| Mumbai |
5.65% |
7.6 |
47% approx |
| M/W (Chembur West) |
8.1% |
6.81 |
68.48% |
| H/E (Santacruz East) |
8.46% |
6.44 |
78.79% |
| L (Kurla) |
8% |
5.85 |
84.86% |
| M/E (Chembur East) |
7.2% |
5.23 |
77.55% |
| B (Sanhurst Rd) |
8% |
6.13 |
13.33% |
These wards also fare poorly on the Human Development Index (HDI) being among the five wards with the lowest HDI levels. The highest HDI ward was D (Grant Rd), which sees a slum population of less than 10% and a case fatality rate of 4%.
Figure 4 Mumbai: Ward-wise Human Development Index Vs Coronavirus Case fatality rate
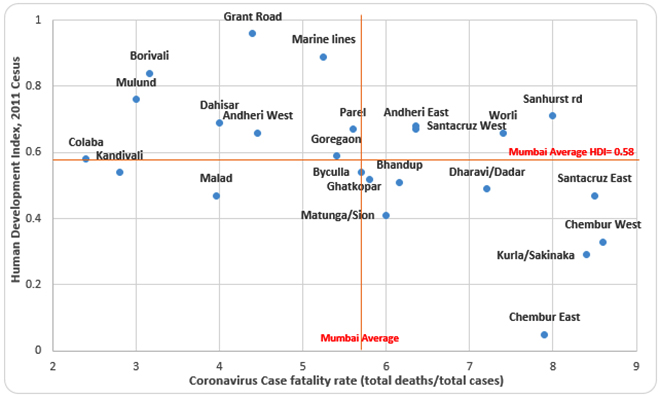 Source: http://mohua.gov.in/upload/uploadfiles/files/6Mumbai%20HDR%20Complete.pdf
These wards seem to have borne the brunt of rapid and unplanned urbanization that has resulted in toxic living conditions and rampant income inequality. The Mahul village in M/W ward was classified as a ‘critically polluted area’ by India’s pollution board. Mahul is one of the many areas in Mumbai where the poor are “rehabilitated” after their residential slums are taken over for infrastructural projects. Due to the toxic environment of Mahul resulting from open sewage pipes and poor waste management, the residents are more prone to diseases like asthma and tuberculosis. The same goes for the M/E ward where Asia’s largest dumping ground is situated, this dump-yard is responsible for releasing several toxic gases. The life expectancy for the people living around this area is only 39 years.
Low HDI levels point to a lack of basic amenities, including adequate healthcare. The existing prevalence of diseases like asthma and tuberculosis among the residents of these wards makes them more susceptible to succumbing to the disease. Chembur and Santacruz East had been seeing the highest case fatality rates consistently since the month of June, yet comparatively little efforts were made to build up Covid relief infrastructure in these areas. While the Brihanmumbai Municipal Corporation followed a rigorous plan of action in Dharavi and thereby controlled the spread there, other vast slum areas did not receive this consistent attention. The severe income inequalities, augmented by gentrification efforts, have created toxic outposts in Mumbai city, and the resulting inequalities manifested themselves powerfully during the pandemic.
Conclusion
The Covid-19 data from three urban centres of the world depict a similar trajectory in terms of their in-city hotspots. The poorest neighborhoods seem to have a higher affinity for fatalities over cases, while the higher income areas appear comparatively sheltered from high fatalities despite their higher caseloads.
Due to the coronavirus’ highly communicable nature, it has placed a higher burden on the already weak health systems nations. Socio-economic inequity that translated to health inequity has now manifested itself even more intensely since the high fatality, low-income neighborhoods endured high rates of diseases even before Covid-19. With inadequate budgets and evidence-based solutions, the health sector has been largely overlooked by policy makers, the outcome of which can be observed. The urban poor communities, especially in India, are one of the most vulnerable groups worldwide. The cause for such is often believed to be migration and overpopulation, but introspection into the unequal distribution of urban resources is required.
The author is an intern with ORF's Health Initiative
The views expressed above belong to the author(s). ORF research and analyses now available on Telegram! Click here to access our curated content — blogs, longforms and interviews.