It is no news that COVID-19 pandemic has resulted in worldwide economic recession. But the havoc it created on the global income distribution is not yet well-documented. It has reversed the progress made in global poverty reduction in the last decade or so. A study made by Pew Research Center has projected some initial estimates, and the results are deeply worrying.
An estimated additional 131 million people have fallen into poverty due to the pandemic. The downturn reversed the growth in global middle class achieved during the period between 2011 and 2019 and increased poverty sharply. The erosion of the middle class is concentrated in Asia. The rise in poverty is most prominent in Asia and Africa. It is estimated that South Asia suffered the largest decrease in the middle class and the greatest increase in poverty due to the COVID-19-induced economic downturn in 2020.
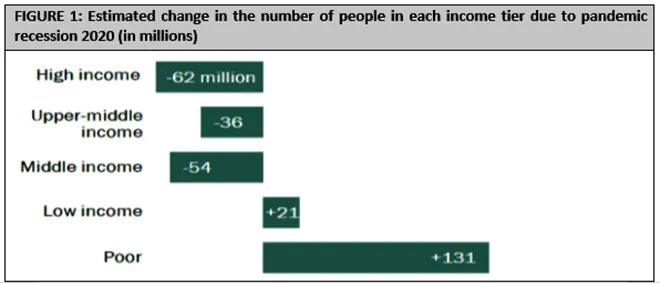
Pew Research Study defines “poor” as the people who live on US $2 or less daily, “low income” on US $2.01 to US $10, “middle income” on US $10.01 to US $20, “upper-middle income” on US $20.01 to US $50, and “high income” as the people who live on more than US $50 daily. The study used the World Bank PovcalNet database for estimation.
The changes (as depicted in the figures below) are the differences between the number of people in each income tier in pre-pandemic projections and in post-pandemic estimates. “Post-pandemic estimates” correspond to the period since the beginning of COVID-19 spread in January 2020. No change in income distribution in any region is assumed during the period beginning in the respective benchmark year (for each region and country) and ending in the projection year 2020.
 Source: Pew Research Center
Global middle-income tier is estimated to shrink by 54 million, while upper-middle-income tier has shrunk by 36 million and high-income tier by 62 million. This population has fallen down the income ladder and as a result low-income tier has increased by 21 million and poor by 131 million (Figure 1).
 Source: Pew Research Center
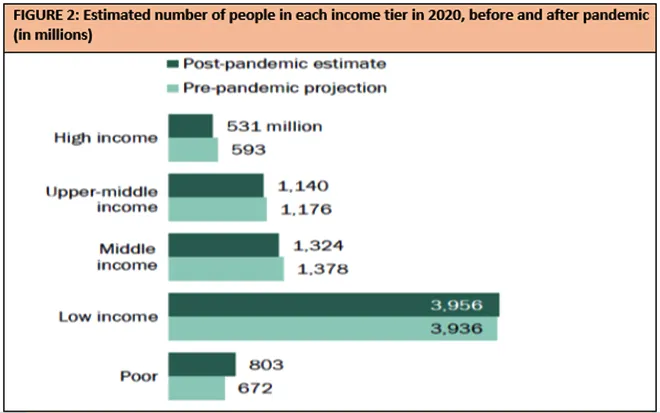
All income tiers above low income have shrunk, including upper-middle and middle-income tiers. Low- and poor-income tiers, on the other hand, have swollen in absolute numbers after pandemic (Figure 2).
 Source: Pew Research Center
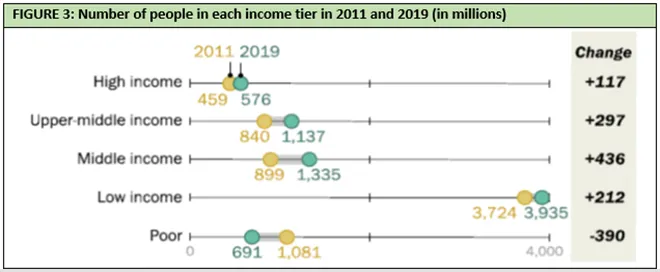
To put these latest shrinking middle class estimates in a perspective—there has been a rapid growth of global middle class between 2011 and 2019. Around 436 million people were added in middle income tier during this period, 297 million people entered the upper-middleincome tier, estimated 390 million people left the lowest ‘poor’ tier of the income ladder (Figure 3). This progress in global prosperity has been totally reversed due to the pandemic.
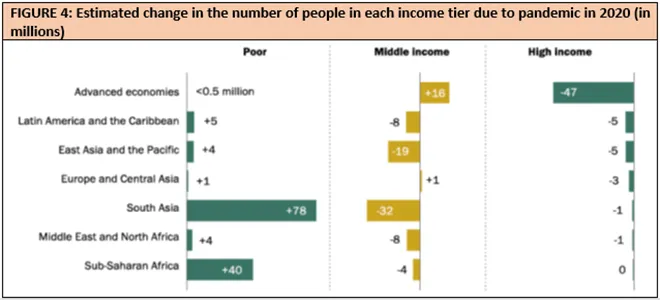
South Asia and Sub-Saharan Africa are two hugely affected region as far as increase in poverty is concerned. Substantial loss in middle-income group is experienced in South Asia, East Asia, and Pacific countries. Advanced economies have gone through a loss in number of people in high-income group, but the aggravation in poverty is much less, compared to others (Figure 4).
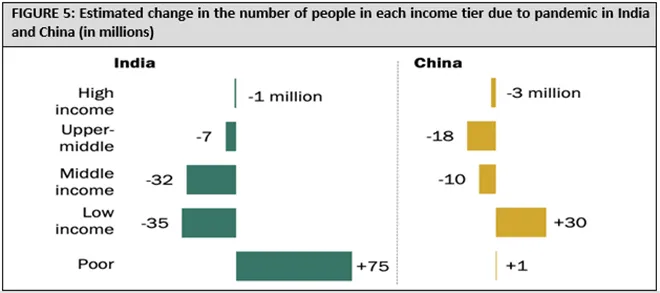
India almost entirely accounts for the 32 million loss in the middle income category in South Asia. The estimated increase in post-pandemic poverty is a staggering 75 million. In contrast, China’s loss is largely centred around upper-middle- and middle-income tiers (Figure 5).
While people in upper-middle- and middle-income groups are pushed down to low-income tier in China, people in middle- and low-income groups have fallen into poverty in India. This is not entirely unexpected as China somehow stalled economic deceleration in latter part of 2020 while India is still reeling under recession.
 Source: Pew Research Center
In India, 32 million people from middle-income group and 35 million people from low-income group have fallen down in the income distribution. As a result, estimated addition in “poor-income level” is a staggering 75 million. China’s loss in income distribution is mainly in upper-middle- and middle- income group at 18 million and 10 million, respectively. Those people have fallen into the low-income category and the number of people increased there by 30 million due to pandemic (Figure 5).
 Source: Pew Research Center
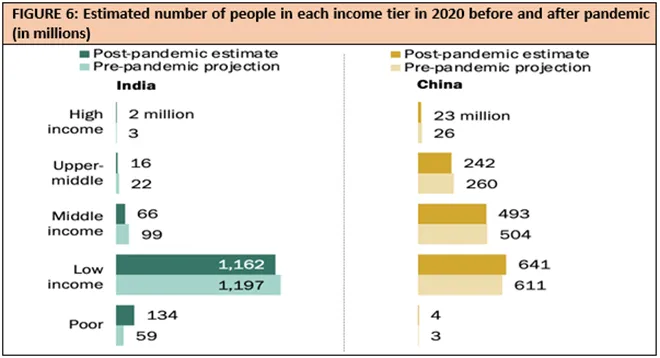
This is due to the existing composition of different income groups in these two countries, as can be observed in Figure 6. Over the last two decades or so, China bolstered its middle-income and upper-middle-income groups. In India, however, concentration of maximum population has been in the low-income group, whose daily income ranged from US $2.01 to US $10.
Here it is important to note that for both India and China, consumption has been taken as the proxy for income. There is no income survey in these two countries, only consumption expenditure surveys are undertaken. India conducts the household expenditure survey quinquennially. However, the 2017–18 survey was not released due to “data quality refinement” issues. No poverty estimates had been released in India since July 2013. Poverty data for 2011–12 was released by Planning Commission in 2013, based on Tendulkar Committee recommendations. Last NSS (National Sample Survey) Household Consumer Expenditure Survey was published in 68th Round for the year 2011–12.
So, the Pew Study used 2011 as base year for India and 2016 for China. After extrapolating benchmark year income (consumption) to projection year 2020 and determining 2020 income distribution based on extrapolated incomes, the population composition in each income tier in 2020 have been estimated.
The analysis also assumes that personal incomes change at the same rate as per capita GDP. However, empirically it is observed that personal income or consumption increases at a slower rate than per capita GDP. World Bank typically assumes a rate of 0.85—implying that 85 percent of national output growth is passed through to household income or consumption. Assuming a pass-through rate of 0.85 would change the estimates slightly for India—poor (+68 million), low income (-40 million), middle income (-22 million), upper-middle income (-5 million), and high income (-1 million). Though the extent of income loss may vary slightly across income tiers, the direction of aggravation is very likely to remain intact. Same is true for China’s income distribution losses.
 Source: Pew Research Center
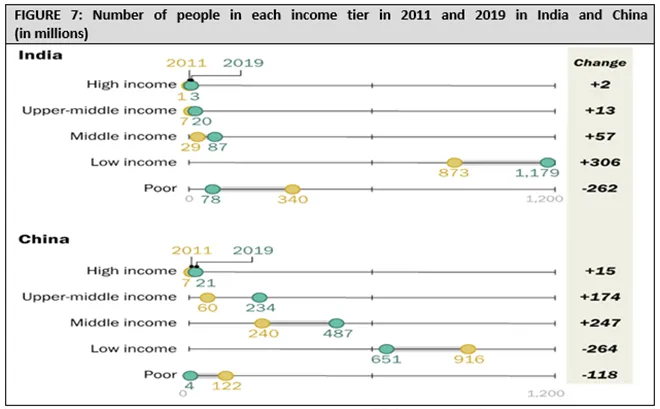
This is quite unfortunate as both India and China have made rapid progress between 2011 and 2019 in improving their national income distributions. India reduced number of people in “poor income category” by 262 million between 2011 and 2019. China bolstered its middle income category by 247 million in these years (Figure 7). This progress in income distribution has been sufficiently and alarmingly reversed during this pandemic.
The views expressed above belong to the author(s). ORF research and analyses now available on Telegram! Click here to access our curated content — blogs, longforms and interviews.