-
CENTRES
Progammes & Centres
Location
In the coming weeks and months, India will see a rise in movement as we start our journey towards the pre-COVID-19 normal. This is when the role of data science will benefit both decision makers and healthcare systems.
The World Health Organisation declared COVID-19 as a pandemic on 11 March 2020. At this point, the virus had already spread across 114 countries. To contain the outbreak, several countries adopted policy tools, such as social distancing measures, and deployed response mechanisms that restricted non-essential movement in the form of a ‘lockdown’. In India, the four-phase nationwide lockdown was imposed from 25 March to 31 May — making it the world’s biggest lockdown. As the country began its first phase of reopening the economy with moderate restrictions, some argued that this increased mobility has resulted in a rise in the number of cases over the last two weeks. Notably, the Google Community Mobility Report (GCMR) in this regard is imperative to understand the trends in movement over time. To this end, the latest GCMR released indicates that there has been a marginal change in mobility across the country since unlock 1.0.
Google uses its sophisticated mechanism to track the location of smartphones and catalogue the change in mobility across places such as retail and recreation, groceries and pharmacies, parks, transit stations, workplaces, and residential. The changes are reflected as a positive/negative percentage compared to the baseline days (baseline day = median value from the 5 weeks 3 January — 6 February 2020). The evaluation of the general trends in mobility of communities during a pandemic can serve as a useful tool to assess its correlation with the spread of the infection.
Figure 1: The change in mobility with respect to baseline during different phases in India
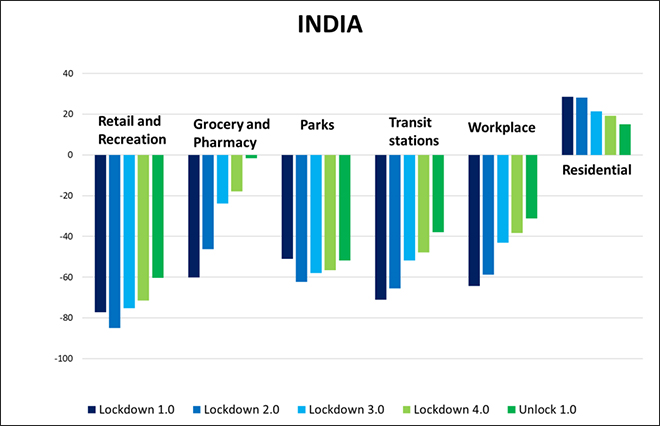 Source: Google Community Mobility Reports | Data as of 19 June 2020
The data from GCMR presents an analysis of the impact of mobility levels in India during different phases of the lockdown, as well as unlock 1.0 until 14 June. The announcement of the nationwide lockdown led to an unprecedented drop in movement at places like retail and recreation, groceries and pharmacies, parks, transit stations, and workplaces. However, the graph representing the number of people staying at home was steep. Despite the reopening of salons and spas, malls, retail stores, restaurants and the hospitality sector, only a minimal change in the movement is observed during unlock 1.0. The percentage change between lockdown 4.0 and unlock 1.0 in retail and recreational mobility has only been 16%, whereas a mere 8% change can be seen in parks. During unlock 1.0, offices were allowed to resume at 50% capacity in some states whereas states like Maharashtra restricted the capacity to 10%. Yet, the mobility observed at the transit stations and workplaces is -38% and -31% respectively, as opposed to -47.79% and -38.36% for the same during lockdown 4.0.
Since the first phase of the lockdown, there was a plunge in all activities with respect to the baseline level. The subsequent phases of the lockdown saw a gradual increase in mobility in Maharashtra. On the other hand, New Delhi has consistently registered a sharp rise in the mobility trend-line in various places over different phases. The average decline in retail and recreational activities during lockdown 1.0 in Maharashtra and New Delhi was -81.7% and -85.7%, respectively. However, during unlock 1.0 this decline stood at -71.6% in Maharashtra and -66% in New Delhi. The mobility relating to workplace in New Delhi saw a decline of 80.6% during lockdown 1.0, and saw an increased change of 42% during unlock 1.0 as opposed to lockdown 1.0 (-46.6%).
Figure 2: The change in mobility with respect to baseline during different phases in Maharashtra
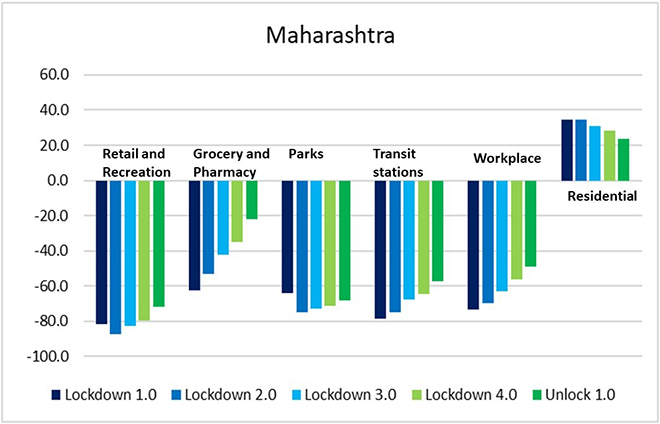 Source: Google Community Mobility Reports | Data as of 19 June 2020
Figure 3: The change in mobility with respect to baseline during different phases in New Delhi
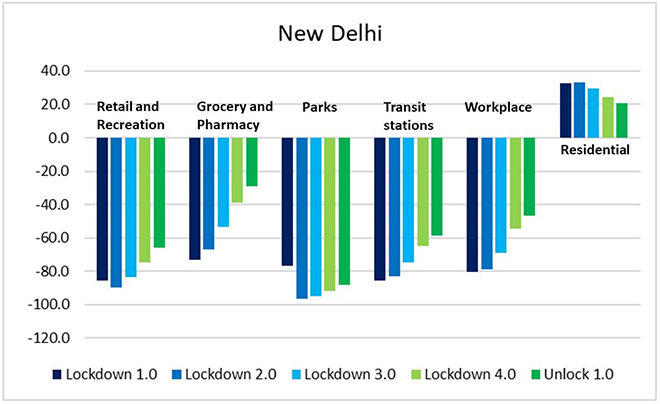 Source: Google Community Mobility Reports | Data as of 19 June 2020
Alternatively, Tamil Nadu, Gujarat and Uttar Pradesh have continued to illustrate large variations with respect to the baseline. The mobility in terms of transit stations and workplace has seen a substantial change in unlock 1.0, in comparison with lockdown 1.0. The average dip in the transit stations during lockdown 1.0 was -69%, -66.4% and -74.1% in Gujarat, Tamil Nadu and Uttar Pradesh, respectively. The change in the mobility during unlock 1.0 was -29.7% for Gujarat, -30.8% for Tamil Nadu and -41.2% for Uttar Pradesh. Similarly, the change in workplace mobility from lockdown 1.0 and unlock 1.0 in Gujarat, Tamil Nadu and Uttar Pradesh is 60%, 56% and 55%, respectively.
Figure 4: The change in mobility with respect to baseline during different phases in Uttar Pradesh
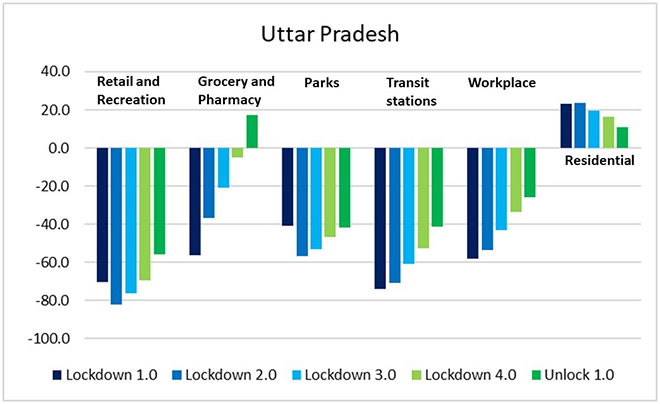 Source: Google Community Mobility Reports | Data as of 19 June 2020
Figure 5: The change in mobility with respect to baseline during different phases in Tamil Nadu
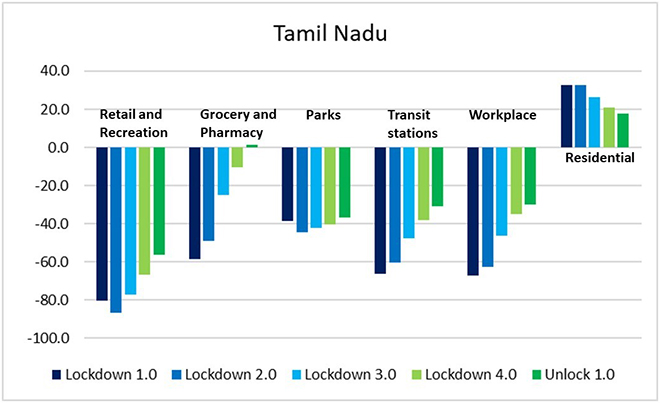 Source: Google Community Mobility Reports | Data as of 19 June 2020
Figure 6: The change in mobility with respect to baseline during different phases in Gujarat
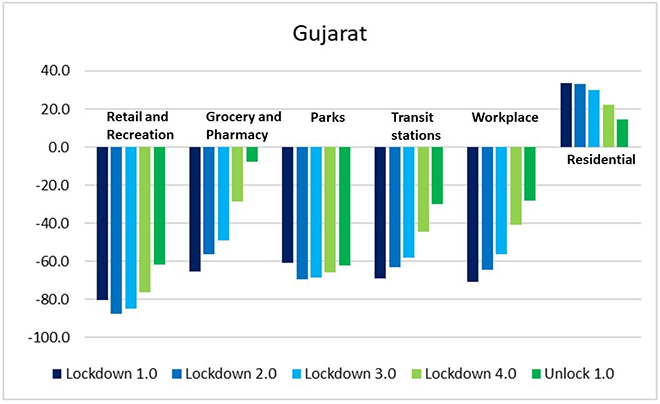 Source: Google Community Mobility Reports | Data as of 19 June 2020
States like Kerala and Karnataka are experiencing a win-win situation. These states have not only managed to contain the spread of the virus but are also witnessing an increase in mobility in retail and recreational activities, as well as transit stations and workplaces. Workplace mobility dipped to -70% in Karnataka and -57.2% in Kerala during lockdown 1.0. The same has increased to -34.3% in Karnataka and -21.2% in Kerala during unlock 1.0. Transit station movements too have increased by 61% in Kerala and 59% in Karnataka during unlock 1.0 in comparison with lockdown 1.0.
Similarly, states in the Northeast like Assam, are witnessing an increased change in mobility during unlock 1.0 with reference to lockdown 1.0: 52% in parks, 46% in transit stations and 64% in workplaces. An intriguing trend in retail and recreation mobility can be observed in states like Manipur, Meghalaya and Mizoram. While mobility declined by -56%, -58% and -68% in Manipur, Meghalaya and Mizoram respectively during lockdown 1.0, it further declined to -71.4%, -63.1% and -78.6% during unlock 1.0.
As much as the GCMR sounds promising, it does not track the movement of the entire population. It is skewed since only 40% of the total Indian population owns a smartphone (502.2 million). Additionally, these smartphones are required to enable location-sharing on their devices without which Google is unable to track their devices. On the flip side, maps by Google are so far the most accurate in determining the situation of traffic in any given part of the country.
Although, unlock 1.0 is aimed towards re-opening the economy, GCMR indicates that the ease in restrictions has not spurred mobility levels. There are several reasons that support the decline in the movement. Firstly, due to the increase in the number of cases at the macro-level, a sense of fear and apprehension of contracting the virus prevails among Indians when it comes to returning to the pre-COVID-19 normal. Secondly, within the Indian population, ‘work from home’ has become the new normal as people continue to prefer staying at home. Thirdly, in unlock 1.0, public transport is not yet seen as a preferred mode of commute by the people or the state governments. In cities like Kolkata, there has been a shift from public transport to bicycles as a means to maintain social distancing norms. Similarly, restrictions are also imposed on public transport by the state governments. In the case of Mumbai, the widely used mode of transport, local trains are only operational for front-line workers. Starting from 24 June, Tamil Nadu has also suspended inter-district bus travel.
"Although unlock 1.0 is aimed towards re-opening the economy, GCMR indicates that the ease in restrictions has not spurred mobility levels."
In the coming weeks and months, India will see a rise in movement as we start our journey towards the pre-COVID-19 normal. This is when the role of data science will benefit both decision makers and healthcare systems. Mobility reports — such as the GCMR — can act as an early warning indicator for decision makers to enhance social distancing measures, so that sudden spurts of cases do not overwhelm our healthcare systems. To prepare for the future, a continuous analysis of mobility and spread of the infection can help us understand and benefit from the intersectionality of the two open data sets in real time. Based on the incubation period of the virus, this information will be vital in controlling the burden on the healthcare system. Mobility trends would drive the infection spread in the country. Success in infection management and survival of high-risk populations will likely be dependent on how effectively decision-makers use the mobility data.
Figure 7: Workplace Mobility Changes
In % compared to the baseline
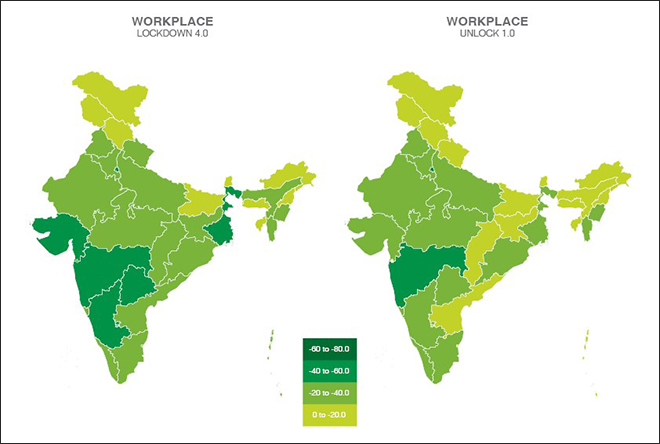 Source: Google Community Mobility Reports | Data as of 19 June 2020
Figure 8: Transit Stations Mobility Changes
In % compared to the baseline
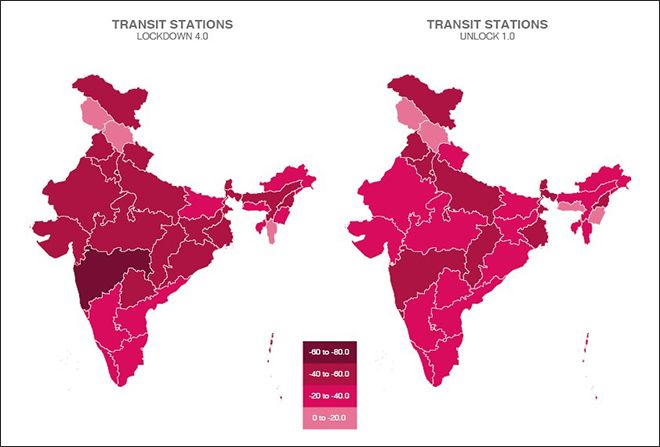 Source: Google Community Mobility Reports | Data as of 19 June 2020
Figure 9: Retail and Recreation Mobility Changes
In % compared to the baseline
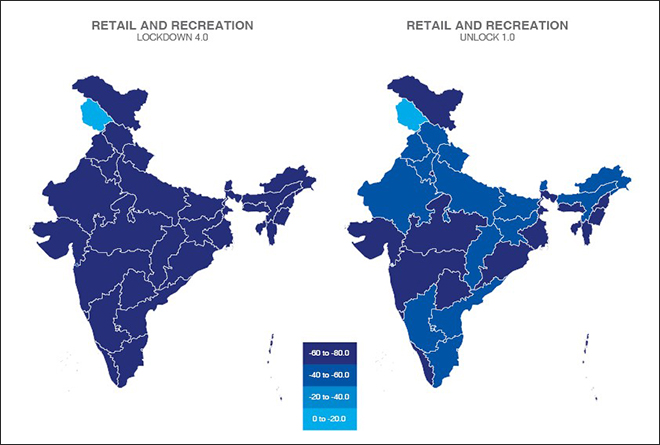 Source: Google Community Mobility Reports | Data as of 19 June 2020
The views expressed above belong to the author(s). ORF research and analyses now available on Telegram! Click here to access our curated content — blogs, longforms and interviews.

Anushka Shah was Sub-Editor at ORF. Anushkas research interests include: climate finance urban environmental policy use of technology for socioeconomic development.
Read More +