State government performance is going to matter in the coming months of fiscal and economic stress. The national performance will depend in the near term, crucially, on how the better-performing states pull their weight.
One criterion of state performance is the budget allocations for fiscal 2023-24 starting April 1
st and the outlook on fiscal rectitude. Consumer price inflation persists beyond the outer tolerance level of 6 percent set for the Reserve Bank of India (RBI) by the government. Fiscal prudence at the state level, without sacrificing targeted social welfare functions which pull in votes, could temper the overuse of growth-dampening monetary policy instruments like an increase in interest rates.
Optimal use of monetary policy needs supportive fiscal restraint
The outlook on India being able to avoid synchronising the repo rate with a hardening federal funds rate is not sanguine. The Union government has already played a salutary role by restraining its fiscal deficit (difference between total expenditure and revenue receipts) at 5.9 percent of GDP for fiscal 2023-24—a reduction, over three fiscal years, from the high of 9.2 percent of GDP at the height of the COVID-19 pandemic (2020-21). However, it remains well above the 4.5 percent targeted by 2025-26 and will pressure the new government, post-national elections in May 2024. The reduction in revenue deficit (difference between revenue receipts and revenue expenditure) over the same period from 7.1 to 2.9 percent of GDP is more praiseworthy. It is an exemplar for state governments to maximise capital expenditure and cut back on revenue expenditure, other than direct transfers for income support.
It is state governments, which implement “gap filling” investments, within the templated national infrastructure development roadmap so that the usefulness of massive Union government investments is not negated by poor last mile linkages or inadequate utility services support.
The rubber meets the road in State governments
State governments manage nearly two-thirds of public investment. Municipal or local government delivery systems remain ineffective and inadequately financed—a pity since it is closest to citizens. It is state governments, which implement “gap filling” investments, within the templated national infrastructure development roadmap so that the usefulness of massive Union government investments is not negated by poor last mile linkages or inadequate utility services support. State governments also have the opportunity of aligning investments with the peculiar infrastructure needs of specific communities and lagging regions (with an eye on valuable votes and on equity considerations) in tune with local priorities—an important aspect of citizen satisfaction with respect to state responsiveness.
This paper assesses the extent to which three state governments—Maharashtra, Tamil Nadu, and Gujarat—have responded to these mandates whilst formulating the 2023-24 budget in response to local needs, aligned with national spending priorities and carefully retaining fiscal discipline.
Why these three states?
We use the
ratio of states’ own resources (SOR) to total revenue receipts (TR) including from Union devolution, as a proxy for institutional maturity and resilience. The average ratio for all states and Union Territories (UT) for fiscal 2020-21 (the last year for which final accounts are publicly available) was 53 percent. We use the criterion of a minimum of 60 percent. Out of the 16 large states, just five met this qualifying criterion. In 2020-21, Haryana had an OSR/TR ratio of 78 percent, Telangana 72 percent, Maharashtra and Tamil Nadu both 67 percent, and Gujarat 63 percent. Of these, Maharashtra, Tamil Nadu, and Gujarat fit the comprehensive profile on scale, socio-economic achievements, and fiscal stability as explained below.
Economic Value addition: These three states contribute around one-fifth of the national GDP. They are amongst four of the largest states in Net State Domestic Product (current values). Karnataka, not in our set, is the second largest.
Population: The three states constituted one-fifth of the national population in 2011-12. Maharashtra (112 million), the largest state in our set was smaller than Uttar Pradesh—the most populous state. The next largest state—Tamil Nadu (72 million), had four states larger than it- Bihar, West Bengal, Andhra Pradesh, and Madhya Pradesh. The smallest Gujarat (60 million)—had two states, Rajasthan and Karnataka which are larger. The selected three states are consequently, fairly representative of the population spectrum across the larger states.
High per capita income: In terms of per capita net state domestic product, Tamil Nadu ranks fifth (Sikkim, Goa, Karnataka, and Haryana are richer) followed by Gujarat while Maharashtra is the eighth richest, preceded by Kerala, not in the set. The selected states are spread across the upper half of a set of large states on per capita income. Some smaller states (Sikkim, Arunachal Pradesh) have per capita incomes rivalling states in the upper half. The average per capita income is INR150,005 (current terms 2021-22).
Sustainable poverty reduction is better associated with either inherited, more equitable income and asset distributions as in Punjab and Himachal Pradesh or effective, targeted income distribution initiatives as in Kerala.
Social and economic metrics
Table 1 compares historical achievements in social and human development across the three selected states, using three metrics—Poverty level (2011-12), Under-five female mortality per 1,000 live births (2020), and the Niti Aayog Health Index for 2019-20.

All three states do better than the national average poverty level headcount of 21.9 percent but paradoxically, not as well as states in the topmost quartile. Five states—Kerala at 7.1 percent, Himachal Pradesh at 8.1, Punjab at 8.3, Andhra Pradesh at 9.2, Jammu and Kashmir at 10.4 had better outcomes, whilst Uttarakhand at 11.3 and Rajasthan at 14.7 percent had comparable outcomes. This illustrates that high average per capita income is a blunt proxy for equity. Sustainable poverty reduction is better associated with either inherited, more equitable income and asset distributions as in Punjab and Himachal Pradesh or effective, targeted income distribution initiatives as in Kerala.
Reducing the under-five female mortality is a metric closely related to the strength of public health services and effective incentives, to induce a behavioural shift in social perception of gender equality. Tamil Nadu at a score of 13 does well to be the second best after Kerala at 4, the clear front-runner. Jammu & Kashmir and Himachal Pradesh at 19 have comparable metrics with Maharashtra, whilst Karnataka and West Bengal at 22 do better than Gujarat at 23. Even more so, than in poverty reduction, improving health and gender outcomes has much to do with cultural change and a deep, supporting framework of social protection services.
In the comprehensive health index (2019-20) the selected three states are on firmer ground, though Kerala, is the national front-runner yet again at 82.2, followed by Tamil Nadu at 72.42. Maharashtra at 69.14 is marginally behind Andhra Pradesh at 69.95, followed by Gujarat at 63.59.
Fiscal metrics
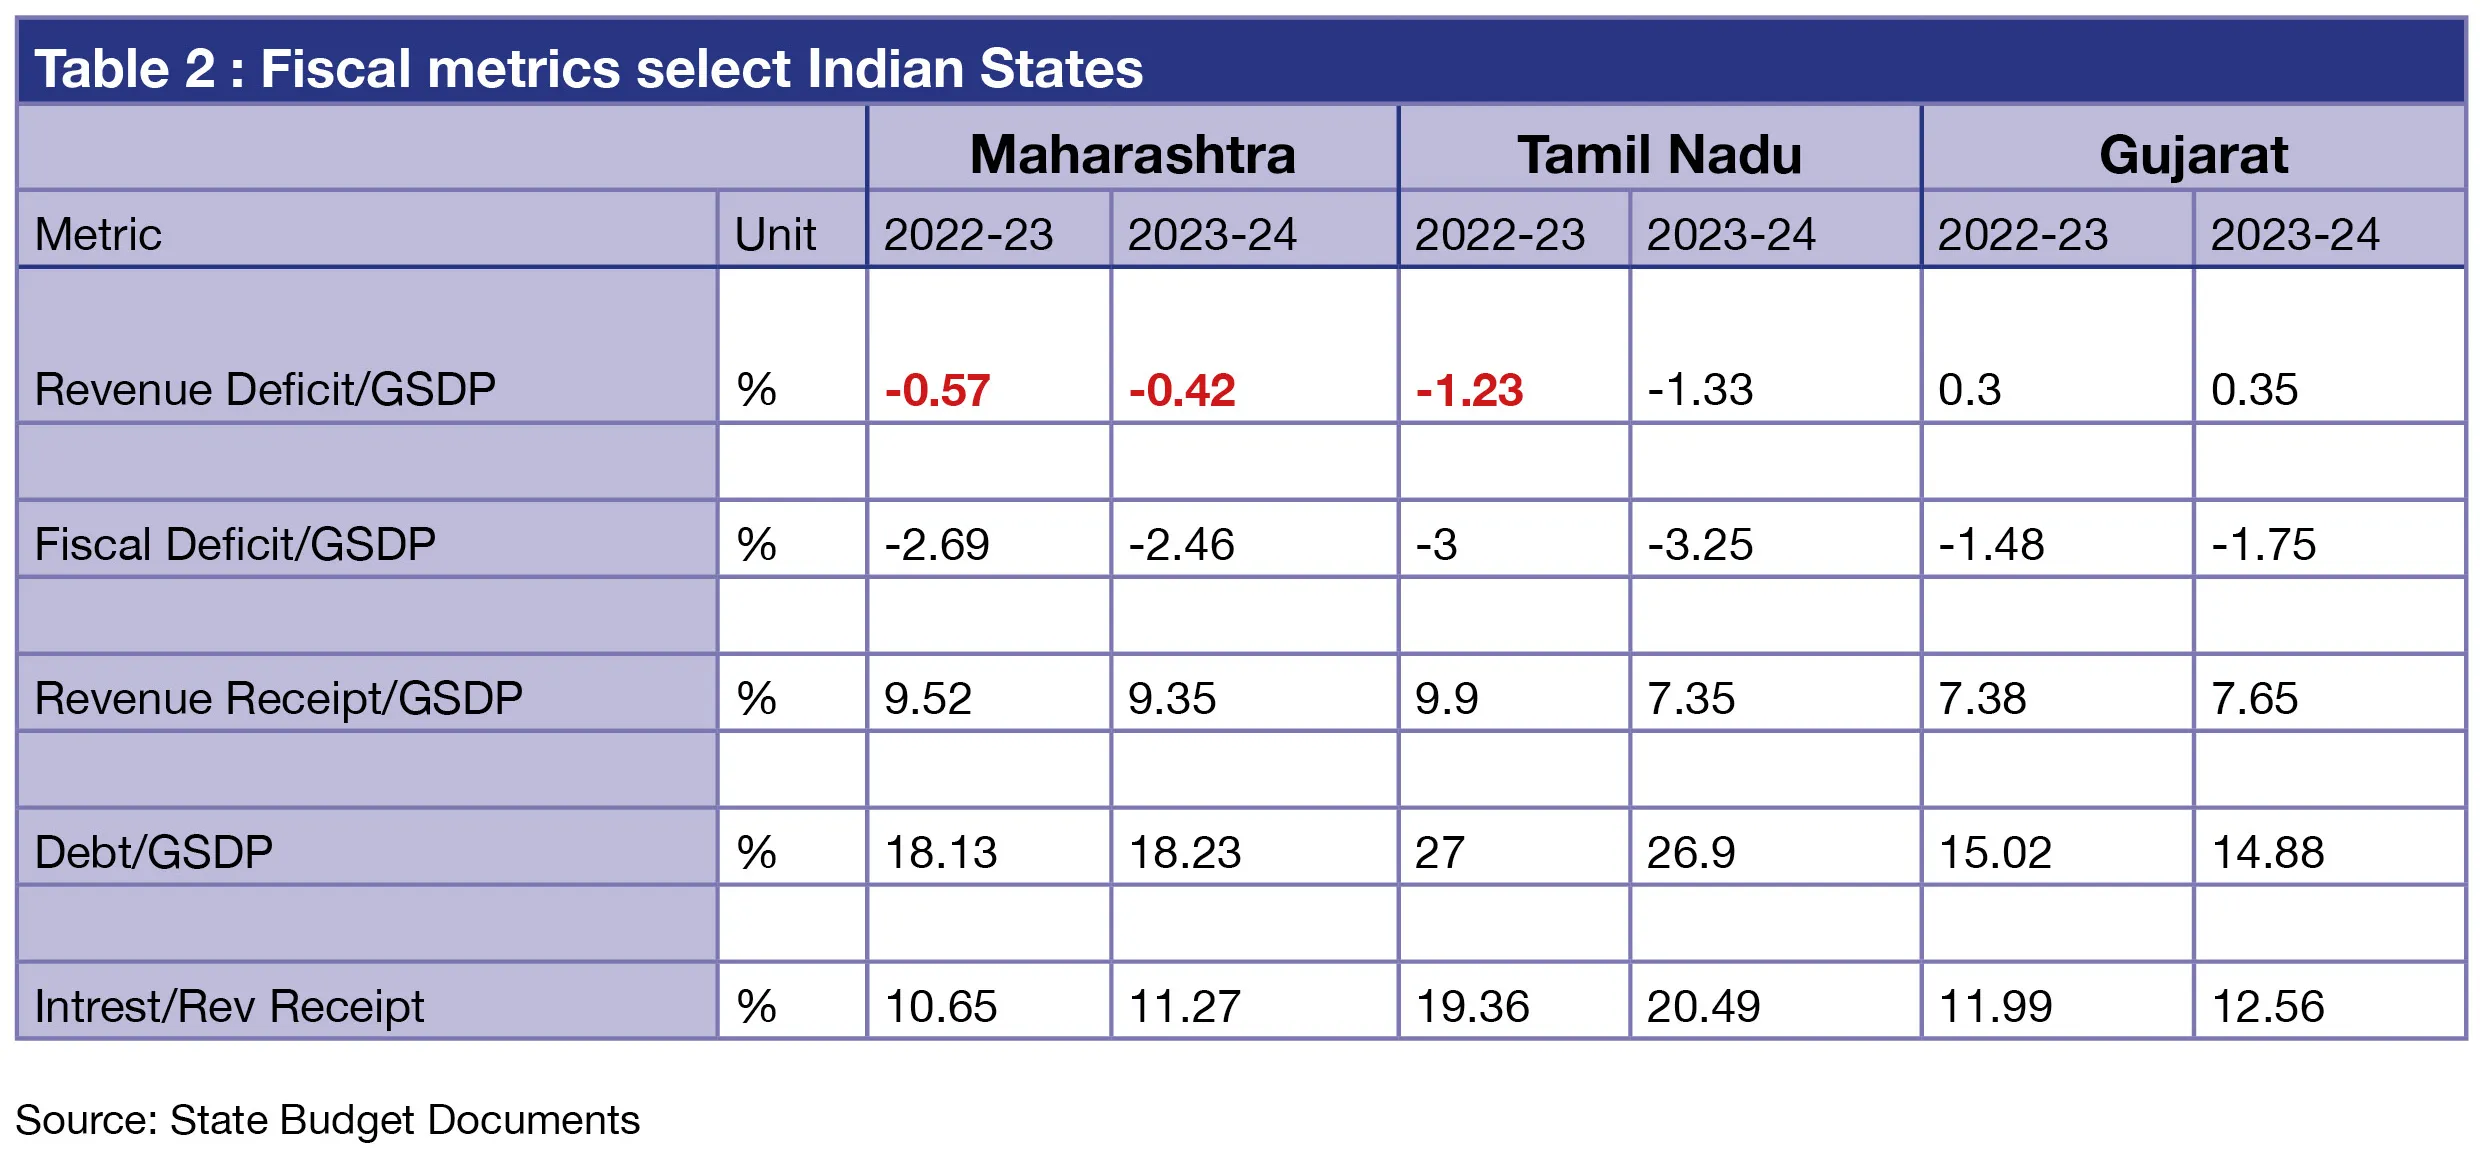
Table 2 provides fiscal metrics of the selected three states. The average state government revenue deficit in 2019-20, the last normal fiscal prior to the COVID-19 pandemic, was 0.6 percent of GDP which increased to 1.9 percent in 2021-22 and subsequently reduced to 0.3 percent in 2022-23. Gujarat is the national front-runner with a revenue surplus. Maharashtra remains above the national average at 0.57 in 2022-23 reducing to 0.4 percent in 2023-24. Tamil Nadu’s revenue deficit remains high, though improving from a revenue deficit of 2.1 percent in 2021-22. Achieving a balance between social sector spending and the quality of infrastructure spending is key to reigning in the revenue deficit—a balance Gujarat excels at but Tamil Nadu must emulate.

The average state government fiscal deficit (FD) was 2.6 percent of GDP in 2019-20 which increased to 4.1 percent in 2021-22 but reduced to 3.4 percent in 2022-23 versus the maximum limit of 3 percent of GDP. Gujarat has normalised the FD much lower at 1.75 percent and Maharashtra hopes for further reductions. FD in Tamil Nadu remains high, though it is level with the revised outside limit for 2023-24.
A high debt burden and increasing debt serving in Tamil Nadu can squeeze its revenue space for the generous social protection services it is known for.
The problem with high FD, unaccompanied by a revenue surplus, is that servicing the accumulating debt progressively shrinks the space for productive social sector allocations. A high debt burden and increasing debt serving in Tamil Nadu can squeeze its revenue space for the generous social protection services it is known for.
Can the three flying geese lead?
Gujarat is clearly the front runner on fiscal rectitude with a revenue surplus, low fiscal deficits, low ratio of outstanding debt to GSDP and a low ratio of interest to revenue receipts, courtesy proactive debt optimisation—a critical metric of fiscal sustainability. This is commendable, despite revenue receipts being on the lower side at 7.65 percent of GSDP and also despite a relatively high share of the generally low productivity primary sector (agriculture and mining) contributing 21 percent to Net Value Added. This compares with 17 percent for Maharashtra and 13.4 percent for Tamil Nadu both of which are traditional manufacturing powerhouses with relatively well-developed infrastructure and human resource capability. All three states are magnets for inward migration of workers and professionals, which adds to the economic muscle of these states and benefits hinterland states through remittances.
The three flying geese have the advantage of institutional maturity and scale economies to experiment with and develop templates for growth under fiscal stress, which could guide other states, towards joined-up progress in poverty reduction, social protection, and sustainable growth.
The views expressed above belong to the author(s). ORF research and analyses now available on Telegram! Click here to access our curated content — blogs, longforms and interviews.


 State government performance is going to matter in the coming months of fiscal and economic stress. The national performance will depend in the near term, crucially, on how the better-performing states pull their weight.
One criterion of state performance is the budget allocations for fiscal 2023-24 starting April 1st and the outlook on fiscal rectitude. Consumer price inflation persists beyond the outer tolerance level of 6 percent set for the Reserve Bank of India (RBI) by the government. Fiscal prudence at the state level, without sacrificing targeted social welfare functions which pull in votes, could temper the overuse of growth-dampening monetary policy instruments like an increase in interest rates.


 PREV
PREV


