Understanding the Impact of GSP Withdrawal on India’s Top Exports to the US
This brief analyses the impacts of the withdrawal of the United States’ Generalized System of Preferences (GSP) programme on India’s exports, domestic production and employment.[1] Until 5 June 2019, when the GSP withdrawal came into effect, India was the largest beneficiary of the GSP of which it had been part since 1974. A decline in exports to the US was anticipated as items under zero-tariff rate were subjected to a higher rate after withdrawal of GSP. This brief conducts a sectoral analysis of the top nine Indian exports to the US and shows that six out of them were unaffected by the GSP withdrawal. Indeed, exports in the Electrical machinery sector grew. The brief recommends reinstating GSP foreign trade policies instead of putting retaliatory tariffs on US products.
Attribution:
Shriya Chauhan, “Understanding the Impact of GSP Withdrawal on India’s Top Exports to the U.S.,” ORF Issue Brief No. 392, August 2020, Observer Research Foundation.
Introduction
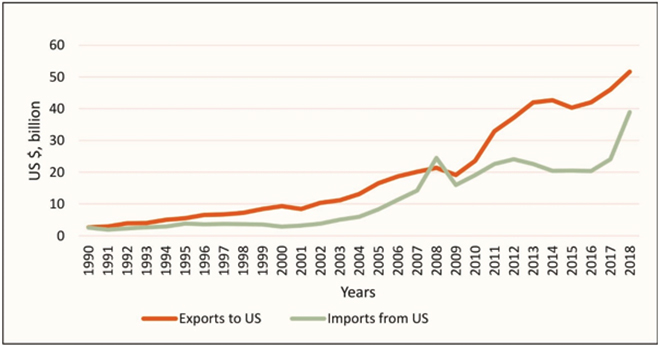
India and the United States (US) have been trade partners since the mid-1990s, as the Indian economy was experiencing a rapid expansion. (See Figure 1) As of 2019, more than 10 percent of India’s total trade was with the US, making it a top source of revenue as trade comprises 43 percent of India’s GDP.[2] Thus, striking a bilateral trade deal with the US is extremely crucial for India.
As the total value of trade between the two countries increased over the years, so too, have the tensions, causing tremendous market-access disputes. US trade officials have been wanting to negotiate a “mini trade deal” with India. Tensions between the two countries mainly stem from America’s use of tariff and non-tariff barriers to shield local agricultural producers and selected manufacturing industries. Historically, the Indian government has maintained prohibitive tariffs on a broad range of agricultural goods to protect domestic farmers for whom competing with more efficient foreign products had been difficult. [3]
Over the past three years, India has also increased tariffs on information and communications technology products, in violation of World Trade Organization (WTO) commitments.[4] The Government of India justified these actions by pointing to the US’ anti-competitive practices, referring to President Donald Trump’s unilateral steel and aluminium tariffs and use of subsidies for US domestic dairy producers.
An important aspect of the proposed “mini trade deal” was the Generalized System of Preferences (GSP), which allows eligible developing countries to export duty-free goods to the US. The GSP gave the Most Favoured Nation (MFN)[5]clause a permanent exception and allowed special tariff treatment to a few countries. The GSP programme also tried to promote exports from developing countries to diversify their export basket, which in turn aided in their economic growth.[6]
Two years after the Trade Act of 1974,[7]the US implemented its own programme. The GSP is not mutual—i.e., it does not impose certain restrictions on non-reciprocal preferences. Section 504(a) of the US Trade Act gives discretionary powers to the US President to withdraw, suspend or limit the application of GSP to beneficiary countries based on conditions such as respecting arbitral awards in favour of a US corporation, combating child labour, and respecting internationally recognised workers’ rights. [8]
In April 2018, the Office of the US Trade Representative initiated a review of India’s eligibility for the GSP on the grounds that India had denied adequate access to its agricultural and dairy markets and had placed prohibitive price controls on medical devices. In March 2019, President Trump’s administration announced that it would revoke India’s GSP status, since India failed to make improvements. India’s GSP benefits were terminated in June 2019. Consequently, special duty treatment on US$5.6 billion worth of exports to the US was removed, affecting India’s export-oriented sectors such as pharmaceuticals, textiles, agricultural products and automotive parts.
To be sure, this was not the first time GSP was revoked for India. In 1992, the US had ceased India’s GSP benefits in certain pharmaceuticals, chemicals and related products based on Intellectual Property Rights (IPR) considerations. The US government expected this action to resolve disputes in return for tariff reductions on steel and aluminium and reinstatement of GSP benefits for India. However, this was not to be the case, as a trade deal failed to come through.
Some Indian trade officials dismissed the impact of GSP withdrawal as “insignificant” as the benefits were only about US$190 million every year,[9] but the Indian government addressed this as an “irreparable damage” to exports as it affected the employment statistics and Micro, Small and Medium Enterprises (MSME) sector in India.[10] This brief explores these consequences for several industries and provides suggestions towards a trade agreement where the paramount aim is reinstating India’s GSP status.
Impact of GSP Withdrawal on India’s Exports
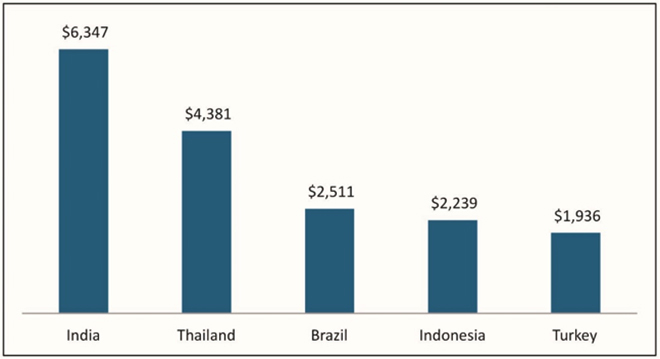
India was the largest beneficiary of the GSP programme at the time of its withdrawal in June 2019 (See Figure 2). Therefore, it was anticipated that the potential losses to the Indian export industry would be substantial. In total, 1,945 Indian products were covered under the GSP programme. The tariff concessions for these products were well above US$241 million—which translates to the total cost India bore due to the withdrawal of GSP status.
Figure 2. Top 5 Beneficiaries of the US GSP Programme (2018, US$ million)
Table 1 shows the top exports under GSP from India to the US in 2018. The top exports were chosen based on the criterion that they export more than US$150 million under GSP. Usually the criterion given for developing countries is US$100 million,[11] but this brief focuses on a narrow selection of industries for three reasons. First, the US GSP withdrawal came into force in 2019, though the talks were on since 2018, and this analysis focuses on the abrupt impact. Second, factors like exchange rate fluctuations, lack of demand, or even price volatility in host or exporting country (or both) could affect volume of exports. However, the time span considered for this study is short (roughly 2015 to 2018, according to data availability), and none of these factors—either in the US or in India—has shown extraordinary volatility during this period that would affect Indian exports. Considering all these factors as constant, the withdrawal of GSP is certain to affect India adversely, and thus, the objective of this brief is to understand that part of the impact solely. Finally, as stated in an earlier ORF paper on the same subject as this brief,[12] in the long run India has to find ways to export without such support programmes, though the abrupt nature of the withdrawal is likely to result in immediate negative impact on the Indian economy (particularly on MSMEs). Therefore, even if GSP is withdrawn by the US it should be done in a phased manner so that production in India does not experience an abrupt fallout.
The main Indian product sectors that enjoyed zero-tariff rate in the US under GSP were organic chemicals, machinery and mechanical parts, vehicles, articles of iron or steel, plastics, and electrical machinery. Of these product groups, five (HS Codes: 29, 73, 84, 85, 87) fall under the top 20 Indian exports to the US irrespective of GSP status.[13] This implies that these commodities are important to India’s overall export basket, which puts into doubt the claim made by Indian trade officials that the GSP withdrawal would have “insignificant” effect. While the maximum exports under GSP were in the organic chemical industry, the percentage of exports under GSP for the plastic industry was significant.
Looking at the average MFN rates for goods that had no GSP and were under the same HS code, the iron and steel industry had the highest tariff rate. Therefore, all these factors play an important role in determining which industry is affected the most. The next section analyses the nine selected industries to understand the sectoral effects of the GSP withdrawal and the tariff concessions lost due to the same.
Sectoral Analysis of India’s Top Exports under GSP
Table 1 shows the export values and percentage of Indian exports under GSP for various sectors. This reflects the significance of Indian GSP exports in that sector. A higher percentage indicates a stronger impact on that sector because that proportion is subject to the MFN rate (higher than the zero-tariff rate). Therefore, most of the groups are likely to experience an adverse effect on their future exports to the US.
The graphs for the sectors unaffected by GSP withdrawal are provided in the Appendix. A few important dates have been considered for this analysis: April 2018 indicates the month when India’s eligibility was put under review; it was in March 2019 that the Trump administration officially announced the revocation of India’s GSP status, which then came into effect in June 2019.
Table 1: Indian GSP Exports and Respective MFN Tariff Rates (2018)
As of 2018, 33.50 percent of exports under GSP were classified as Organic Chemicals (Table 1). Figure A in Annexe shows that there was an immediate reduction in exports following the pivotal months (dotted-lines). This was expected, since 34 percent of the exports classified under this sector was now subjected to an annual average MFN rate of 2.75 percent. Though the average annual MFN rate for this sector has not changed over time (see Table A1), the export cost has gone up and eventually resulted in increased prices. A price rise made such products uncompetitive. However, after July 2019, the products’ export value stayed almost the same. It can be concluded that the withdrawal of GSP initially affected the export value adversely, and in the long run it only made a marginal difference. This is perhaps because the percentage under GSP exports was relatively low. Furthermore, the significance of these products in Indian exports did not diminish in the US market as Organic Chemicals are in the top 20 exports to US irrespective of GSP status. This may be an indication that some commodities in this group were able to withstand the adverse effect of GSP withdrawal. Overall, this group is not as adversely affected as some others.
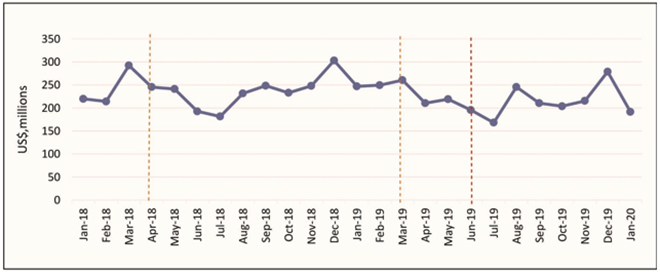
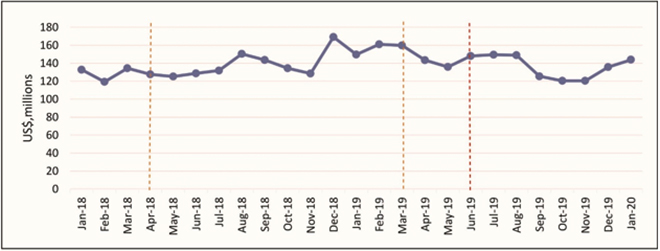
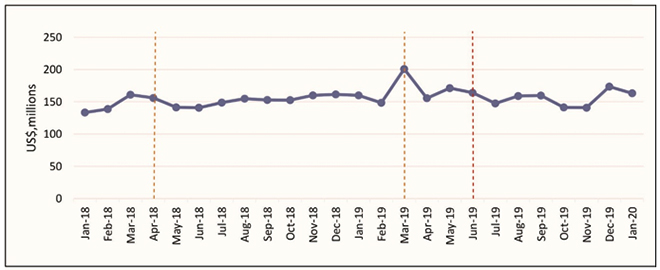
2. HS Code: 84 (Nuclear Reactors, Boilers and Machinery)
As of 2018, 21.65 percent of exports under GSP were classified as Nuclear Reactors, Boilers and Machinery. As shown in Table 1, an immediate drop in the export value was noticed following the pivotal months (Figure 3). Since the average annual MFN rate for this sector has not changed over time (Table A1), 22 percent of exports under zero-tariff rate moved to a tariff rate of 1.25 percent. The decline in exports flattened after July 2019 followed by a sudden increase in exports in November 2019, which could be due to a high demand of those products in the country.
Overall, the Nuclear Reactors, Boilers and Machinery sector was only marginally affected by the withdrawal as the percentage of GSP exports and the overall tariff rate were low. Furthermore, the significance of these products in Indian exports did not diminish in the US market; the sector remained in the top 20 irrespective of the GSP status. This may be an indication that some commodities in this group were able to withstand the adverse effect of GSP withdrawal, and overall, this group is not as adversely affected as some others.
Figure 3: Export Value of Nuclear Reactors over time
As of 2018, 23.47 percent of exports under GSP were classified as Vehicles and parts (Table 1). Like the previous two sectors, this one also observed almost immediate decline in export value in the months following the pivotal months (Figure 4). However, the average annual MFN rate for this sector has not changed over time (Table A1), and 23 percent of exports that were under zero-tariff rate moved to an MFN rate of 3.09 percent. While the MFN rate is high, it is applied to a small proportion. Therefore, it can be observed that the export values increased after August 2019 and have remained high thereafter. The significance of these products in Indian exports did not diminish in the US market irrespective of the GSP status as the sector is in top 20 India exports to the US. It can be concluded that this group was able to withstand the withdrawal and suffered marginally.
Figure 4: Export Value of Vehicles and parts over time
As of 2018, 44.39 percent of exports under GSP were classified as Articles of Iron and Steel (Table 1), making it the third largest percentage of exports under GSP. A slight decline in export value was recorded after the eligibility review and the official announcement regarding GSP. After June 2019, the export value remained constant for two months, which could be because the average MFN rate remained low at 1.21 percent. However, after August 2019, the export value dropped and continued to fall until November 2019 (Figure 5). It could be a result of high export prices as a large proportion of goods within this sector is subject to tariff. However, this rate is low compared to the other sectors, it is applied to a larger proportion of exports. This could also be a delayed effect. Therefore, it can be concluded that Articles of Iron and Steel in Indian exports to the US were negatively affected by the withdrawal.
Figure 5: Export Value of Articles of Iron and Steel over time
As of 2018, 75.49 percent of exports under GSP were classified as Plastics and articles thereof (Table 1), making it the largest percentage of exports under GSP. Figure 6 shows a decline in export value in this sector after the official announcement and effective date of withdrawal. For this sector, the annual average MFN rate changed over time from 4.27 percent in 2017 to 4.24 percent in 2019 (Table A1). The lowered average is due to more products being included while calculating the average (which were excluded earlier). Now, 75 percent of the products that were under zero-tariff rate moved to an MFN rate of 4.24 percent. Since both the rate and proportion are quite high, it would exponentially increase the cost of export prices thereby making these products uncompetitive. Therefore, a steady decline after the effective date is seen. Figure 6 exactly conveys the same idea as the export value fell after August 2019. It can be concluded that plastic articles have been negatively impacted by the GSP withdrawal.
Figure 6: Export Value of Plastic and articles over time
As of 2018, 25.48 percent of exports under GSP were classified as Electrical machinery (Table 1). Figure 7 shows that after the official announcement there was a decline in the export value, but after the effective month, the export values increased. The annual average MFN rate lowered from 1.46 percent in 2017 to 1.38 percent in 2019 (Table A1). About 25 percent exports that were under zero-tariff moved to an MFN rate of 1.38 percent. Since both the rate and proportion are low, no major change in export prices could be expected. Therefore, after August 2019, the products’ export values saw an increase. It could be because the dip in the average MFN rates made the product group cheaper to export, implying lower taxes. Therefore, the US resorts to trade more with India than China, despite the latter being the largest exporter of Electric machinery. It can be concluded that Electrical machinery remained unaffected by the GSP withdrawal. Indeed, this sector is booming after the withdrawal.
Figure 7: Export Value of Electric machinery over time
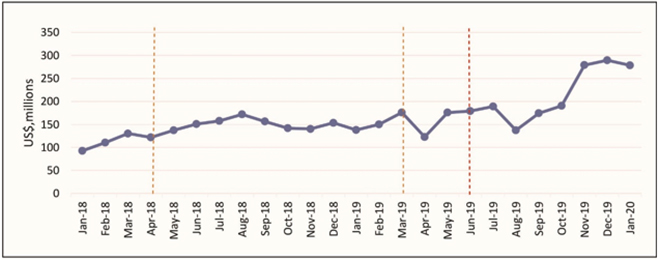
As of 2018, 50.19 percent of exports under GSP were classified as Articles of Leather (Table 1), making it the second largest percentage of exports under GSP. Figure B in Annexe shows the monthly growth rate of export values of Articles of Leather over time. The graph displays that after the official announcement, the exports decreased and then increased after the effective date. Although the average annual MFN rate for this sector has not changed over time (Table A1), 50 percent of the products that were under zero-tariff moved to an MFN rate of 7.73 percent, the highest annual MFN rate across all sectors. This mostly increases the cost of export with a possibility of rise in prices, which in turn makes these products uncompetitive. However, it can be seen that from August 2019 till November 2019, the product export values remained unaffected. This commodity group was predicted to be affected significantly but no major change has been noticed, which could be because the US is the biggest market for this product.
Overall, the significance of Articles of Leather in Indian exports to the US did not diminish after the withdrawal and the export values remained mostly unaffected.
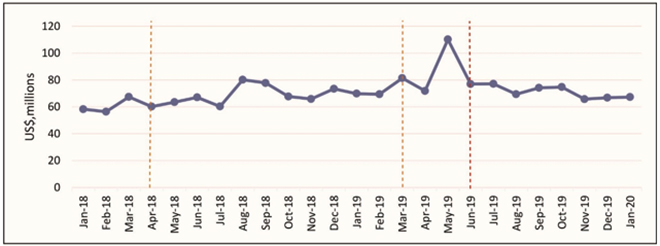
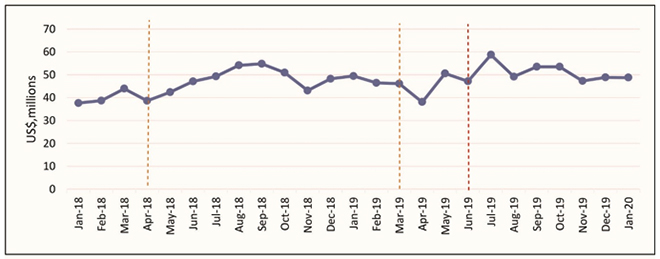
8. HS Code: 40 (Rubber and articles thereof)
As of 2018, 32.43 percent of exports under GSP were classified as Rubber and articles thereof (Table 1). Figure C (Appendix) shows that after the official announcement and effective date, the export value fell for this sector. The average annual MFN rate for this sector has not changed over time (Table A1), so 32 percent of the products that were under zero-tariff moved to an MFN rate of 1.56 percent. The MFN rate might be low, but it is applied to a relatively larger proportion of exports. However, from August 2019 till November 2019, the product export values have shown an increase. This could be because the MFN rate is relatively low and did not impact the export prices significantly.
Overall, Rubber and articles thereof in Indian exports were not affected by the GSP withdrawal.
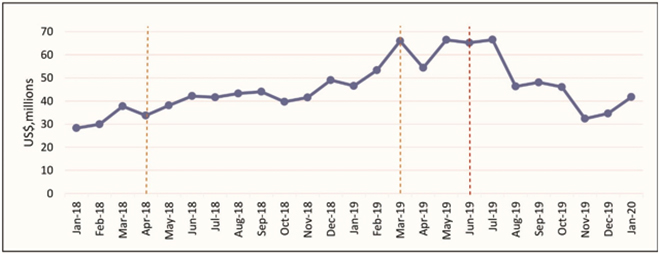
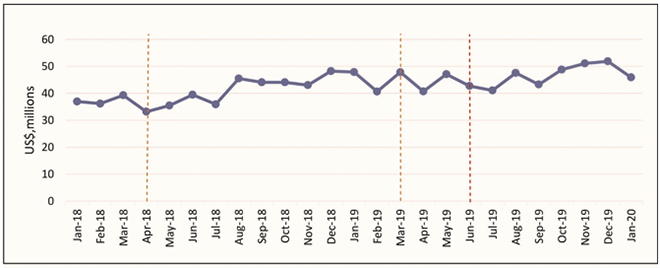
9. HS Code: 68(Articles of Stone, Plaster and Cement)
As of 2018, 34.48 percent of exports under GSP were classified as Articles of Stone, Plaster and Cement (Table 1). We notice that after the official announcement there was an immediate decrease in exports in this sector (Figure 8). However, in the month of July 2019, stability in the values could be seen. The average annual MFN rate for this sector has not changed over time (Table A), so 34 percent of the products that were under zero-tariff rate moved to an MFN rate of 1.49 percent. This shift mostly increases the cost of export with a possibility of rise in prices, thereby making these products uncompetitive. It can be observed that after July 2019, the products’ export values have plummeted.
Overall, Articles of Stone, Plaster and Cement in Indian exports suffered a negative impact due to the GSP withdrawal.
Figure 8: Export Value of Articles of stone, plaster and cement over time
Although it was anticipated that almost all the product groups would be adversely affected by the GSP withdrawal, only three of the nine sectors registered a decline. Five sectors showed marginal decline in exports in the short run but there was no persistent effect—mostly unaffected in the long run. Electrical Machinery was the only sector that grew after the withdrawal, as it is the most traded global product. [14] Most of these changes could also have been due to policy re-adjustments or change in level of significance in the US markets.
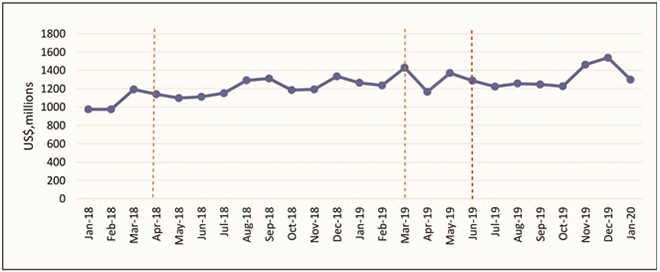
Figure D (Annexe) displays the aggregate export trade values across all the top nine GSP sectors and it can be seen that the export trade value remained consistent after the GSP withdrawal in June 2019 till October 2019, and then it started increasing. However, at the sectoral level there has been an impact on export trade value.
Effects of GSP Withdrawal on Employment and Output
To understand the extent of the GSP withdrawal’s impact, it is also important to investigate its effects on employment and domestic production in India.
The ORF paper written by Mukhopadhyay and Sarma[15] best matches 2-HS Codes to 3-NIC 2008 level for five different product groups (Table A2). The same classification has been used for studying the following HS Codes: 29, 39, 42, 40, 68, and the same technique has been followed to understand the impact. They use two different statistics until 2017, and this study extends that to 2018. They first calculate the total persons engaged in the sector, i.e., L/Y to indicate how much labour is used for each rupee of output earned. Therefore, a fall in export values due to the withdrawal should increase this cost (ratio) and eventually increase unemployment. Next, they calculated the ratio of exports to domestic production in that sector in percentage for the financial years [16] 2015–16 and 2016–17, [17] on the basis of which calculations for 2017–18 have been done in order to predict the future impact on employment and output.
Table 2: Impact of Withdrawal on Employment and Output from 2015 to 2018 (pre- GSP Withdrawal)
L/Y
Ratio of exports to domestic production
HS Code
2015–2016
2016– 2017
2017–2018
2015–2016
2016–2017
2017–2018
29
0.012
0.014
0.012
13%
14%
15%
39
0.026
0.027
0.025
21%
19%
21%
42
0.063
0.068
0.070
26%
27%
35%
40
0.028
0.027
0.026
20%
21%
18%
68
0.047
0.044
0.040
4%
4%
3%
Source: Ministry of Commerce and Industry, and Ministry of Statistics and Programme Implementation
Source: Ministry of Commerce and Industry, Ministry of Statistics and Programme Implementation.
The L/Y value indicates the units of labour required to make 100 units of output; this ratio is greater than zero across all sectors (Table 2). A higher ratio suggests a bigger impact on employment, making the sector more vulnerable. Product 42 (Articles of Leather) had the largest ratio, and more than one-third of its domestic production was exported in 2017–18. It was predicted that the withdrawal of GSP would have a negative impact on employment generation, but the export values did not change much (Figure B), and therefore it could be possible that in 2018–19 even employment was mostly unaffected.
Although organic chemicals’ (HS code 29) export dependence has increased over the years, it is still about 15 percent. Moreover, the L/Y is between 0.012 to 0.014. Its dependence on export is relatively less than three other sectors and the use of labour is also quite low. On the other hand, sector 68 (Articles of Stone, Plaster and Cement) has a higher L/Y ratio of 0.040 but lowest export dependence among all sectors. Therefore, for both these sectors the withdrawal impact prediction is difficult. Surprisingly, the product group 68 has a huge change in export values, which suggests that there are job losses in that sector due to high L/Y ratio. Product 29 has no change in exports thereby indicating no job losses. Therefore its overall impact is muted.
Product groups 39 and 40 have similar Y/L ratios and export dependence, but the export value for product group 39 dropped after the withdrawal and for 40 it did not. This suggests that there is a possibility of increasing unemployment in sector 39.
One caveat to this analysis is that approximate matching procedures were followed, therefore it is possible that these are likely impacts which are estimated by overcoming classification and data availability hurdles.
Conclusion and Recommendations
Soon after the US revoked India’s GSP status, India put retaliatory tariffs on 29 US products, which created tensions between the two countries and affected their trade. It is extremely important that the Government of India offers fiscal help to the affected sectors, not by increasing tariffs, but by making sure that it can offer some relief to producers suffering losses due to the GSP withdrawal. It is important to ensure that during this process, India is compliant with WTO rules that protect all its members equally from undue sops given to exporters. One possible consideration would be refunding taxes for goods that were once under GSP but now are not. This could aid sectors as well as protect jobs, prioritising the government’s goal of protecting industries and promoting ‘Make in India’. [18] Though, it has been seen that despite facing higher tariffs due to revoking of GSP, imports from most of the previously GSP eligible products have increased by about 40 percent.
The best way forward for the government is to focus on the industries that are exporting and adding more policies that shelter firms. This will help them compete with ease in the international markets. As the labour per output is lower, the government is under pressure to provide employment opportunities for India’s swelling population—two-thirds of Indians are below the age of 35, out of which 23.3 percent are unemployed.[19]
The government should shift its focus from bilateral trade disputes and retaliatory tariffs and look for useful opportunities to improve India’s foreign trade policies such as diversifying the exports baskets or increasing exports of products that do not require the GSP benefits. While reinstating GSP is important for India, it is not suffering massive losses yet, after the withdrawal. India must use this to its advantage, and policymakers must note that dependence on preferential trade schemes can often be a double-edged sword as short-term benefits are incompatible with the long-term developmental goals of the beneficiary countries.
The analysis in this brief suggests that while there is a sizable negative impact on Indian exports to the US due to the GSP withdrawal, it is limited to only a few sectors. It also elucidates the impact on export value and employment in the domestic economy. Given President Trump’s recent combative attitude on trade, it is unlikely that the US will reconsider its decision to withdraw India’s GSP status. India is close to becoming a developed country; the Indian government must craft a plan to soften the impact on the domestic economy and find new export markets to venture to that plan.
[5] The first multilateral free trade agreement came into effect with the signing in 1948 of the General Agreement on Tariffs and Trade (GATT), which aimed to facilitate the free movement of trade of goods and services across borders. Amongst the agreement’s most important provisions was the Most Favoured Nation (MFN) clause that required that each nation be treated at par when it comes to tariffs.
[8] Hoda, A., and Prakash, S. “Has India’s Trade Benefited from the US’ Generalised System of Preferences?” Economic and Political Weekly, Vol. 47, No. 41, pp 59-68, 2012.
[10] Public Country Practice Hearing for the U.S. Generalized System of Preferences (GSP).
[11] The figure of US$100 million is chosen as the United Nations Conference on Trade and Development considers this as a threshold exports benchmark for developing countries.
[12] Abhijit Mukhopadhyay and Nandini Sarma, “US Trade ‘Realignment’: The Impact of GSP Withdrawal on India’s Top Exports to the United States,” ORF Occasional Paper No. 233, February 2020, Observer Research Foundation.
The views expressed above belong to the author(s). ORF research and analyses now available on Telegram! Click here to access our curated content — blogs, longforms and interviews.

 PDF Download