Tackling Industrial Pollution in India: Where is the Data?
This brief argues that the understanding of city-level air quality could be strengthened if residents who live in spaces where industries are present, are able to access information about industrial emissions in their areas. Indeed, even as there are some 4,000 OCEMS (online continuous emissions/effluents monitoring systems) in place in different pollutive industries across the country, the data they collect—inarguably vital for public health—is largely inaccessible to the public; in the few cases that the data is accessible, it remains opaque. The imperative is for these thousands of monitors to be immediately brought under a transparent regime where the data can be analysed, verified and reported.
Attribution:
Chetan Bhattacharji and Ronak Sutaria, “Tackling Industrial Pollution in India: Where is the Data?” ORF Issue Brief No. 423, November 2020, Observer Research Foundation.
Introduction
Hundreds of millions of people in India are continually exposed to toxic air:[1]they inhale, for example, a 24-hour average of up to 25 micrograms/cubic metre of air of the deadly, microscopic pollutant, PM 2.5—far above the World Health Organization’s (WHO) limit of 10 micrograms/cubic metre. With long-term exposure, this particulate matter goes deep into the lungs and on to other organs and systems, gradually defeating the body’s defence mechanism. Repeated exposure to toxic air causes cardiovascular and respiratory diseases, lung and other cancers, strokes, pre-term birth, type-2 diabetes, and other illnesses.[2]
Since February 2014, the government of India has been monitoring industrial emissions and effluents in rivers and lakes across the country. The monitoring is done through what is called the Online Continuous Emissions/Effluents Monitoring Systems (OCEMS). There are 17 categories[3] of industrial units that are required to have OCEMS—these include power plants; aluminium, zinc, copper plants; cement plants; distilleries; fertilisers, iron and steel plants; oil refineries; petrochemicals; and tanneries. The emissions monitored under the OCEMS regulations include particulate matter (PM), CO (carbon monoxide), NOx (nitrogen oxide), SO2 (sulfur dioxide), and fluoride.
In mid-March 2020, discussions in Parliament indicated that there were some 3,700 OCEMS[4] installed in different industrial locations across the country. A month earlier, Parliament was informed by the Union government that the total number of targeted units was 4,245.
Meanwhile, there are only 234 continuous air pollution monitors[5] (also known as CAAQMS – Continuous Ambient Air Quality Monitoring Systems) in the country as of October 2020; the data from these monitors serve as basis for the AQI or national Air Quality Index. By this yardstick, it is apparent that the scale of monitoring of pollutants is bigger in the country’s industrial sector. The OCEMS network is regulated by the same regulatory body, the Central Pollution Control Board (CPCB), and monitors similar parameters as those covered by the CAAQMS. However, in the OCEMS, the commissioning and operations of the monitoring systems is left to the same industries which are themselves being monitored for their emissions.
While the installation and operations of CEMS equipment is highly technical, the understanding of the data from the CEMS network does not need to be as complex. The nuance of this is best understood by identifying who are the people most affected by the pollution from these industrial units where the CEMS equipment is installed. Both CAAQMS and CEMS are designed to benefit the people who are living in the vicinity of that monitoring system. The authors of this brief argue that the people living in the vicinity of the industrial unit should be able to access the air pollution emissions data from the CEMS network in much the same way that they can access real-time air quality data from the CAAQMS network.
However, the data on industrial emissions is almost impossible to access for the public. Each industrial unit’s operator has access to the data as well as the Central and state pollution control boards. The stated aim of OCEMS is for monitoring and self-regulation. But here is where the CPCB appears to sidestep transparency of OCEMS data.
To be sure, the CPCB recognises clean air as “a matter of right.”[6] Under the industrial pollution section of the regulatory website,[7] detailed guidelines are provided for industries to report their continuous emissions data using an online platform. The most recent guidelines for CEMS were issued by CPCB in August 2018.[8] While the regulatory body has issued a legal directive “under section 5 of the Environment (Protection) Act to the units for installation of Online monitoring systems for strengthening monitoring and self-regulation”, it has relied on building a self-regulatory system for industrial emissions monitoring. The law states: “CPCB neither certifies nor assessed any sensors/ analysers. Industrial units are free to choose any type/ make of analysers including the indigenous equipment, meeting the prerequisites. The unit should give calibration protocol, periodicity/frequency of calibration and ± variation specified when matched with manually monitored results.” In essence, while the regulations have ordered 17 polluting industries to report continuous emissions data, they have at the same time, allowed these industries to self-regulate in the installation and reporting of the data.
Seeking Transparency in Pollution Data
In the publicly available information related to operations of the CEMS systems in India, the regulator, CPCB, has provided periodic minutes of the meetings[a] held since July 2017.[9] In those meetings, lists of “Grossly Polluting Industries” (or GPIs) are discussed. The regulator makes recommendations about closure of the industrial unit that has violated emission standards, as well as the reasons for the revocation of such recommendation for closure. At the time of writing this brief, information related to 43 such meetings of the CEMS have been provided; in each meeting, an average of six to 10 industries were discussed. While the CEMS guidelines acknowledge that the industries are potentially highly polluting and these industries have continuous emissions data being shared with a publicly funded agency, i.e. CPCB, the actual datasets related to the emissions are not made available to the public.
In a March 2016 directive,[10] the Central Pollution Control Board (CPCB) outlined a list of industrial sectors that it has tagged as being in the “Red category”—i.e., the highest polluting industrial sectors that are required to follow all CEMS norms. The directive has recategorised 60 “Red category” industrial sectors (down from the earlier 85 sectors identified in September 2011). The list was finalised based on these industries having a pollution index score of 60 and above. The Red category includes sectors such as automobile manufacturing, manufacturing of lubricating oils, and paper and pulp manufacturing.
During the March discussions in parliament, the minister of state in the environment ministry, Babul Supriyo was asked whether data on pollution emissions from industries can be made available to the general public.[11] He replied that the data is available in the public domain[12] (emphasis added) through the various websites of the state pollution control boards. This data, he added, is voluminous—as it is captured every 15 minutes. Six months later, during Parliament’s monsoon session, authorities appear to have opened themselves up to a contradiction. With data still largely inaccessible, more pointed questions were asked as to why the data in the CPCB site is blocked, and whether the environment ministry will make this information available to the general public. The ministry informed Parliament that “data available at Central Portal is reported by industries on self-monitoring and reporting purposes and not owned or generated by CPCB,hence not shared in public domain (emphasis added).”[13]The minister’s reply did say that the OCEMS data is accessible to the public on the websites of state pollution control boards; he gave a list of 19 states and union territories (UTs) for which the data is available.
These authors checked the 19 states and UTs to confirm the veracity of the environment ministry’s pronouncements before Parliament. Overall, most of the data is inaccessible; in those few cases where data is accessible, it is difficult to track. (See Table 1)
Table 1: Ministry of Environment’s List of States with available pollution data: Reality check
Source: Authors’ own. Checking conducted between 4th-10th October 2020.
Note: The ‘green’ states indicate those which have provided CEMS links which are providing useful industrial emissions data. The ‘yellow’ states are showing some data but not enough to make it useful. The ‘red’ states are those which are not providing any CEMS data to the public.
Of the 28 states and eight union territories of India, CEMS links for 18 states and one UT were provided in the Rajya Sabha reply of the ministry of environment. Of these States/UTs, only seven were found to have real-time CEMS data which could be used by the public to understand the type and degree of air pollution emissions from the industries located in their areas. But even for these seven states that have reported industrial pollution data, there is no consistency in the data formats and the results of the CEMS datasets are not available in Open Data (Machine Readable data formats)—the only way in which the data can be used for any meaningful analysis. According to globally accepted norms, all such industrial datasets are to be provided in csv (comma separated value) formats which allow for the datasets to be analysed at scale and in real-time. Moreover, links for 10 states—including major industrial ones like Uttar Pradesh, Jharkhand and Chhattisgarh—as well as seven UTs were not provided by the environment ministry during the Parliament hearings.
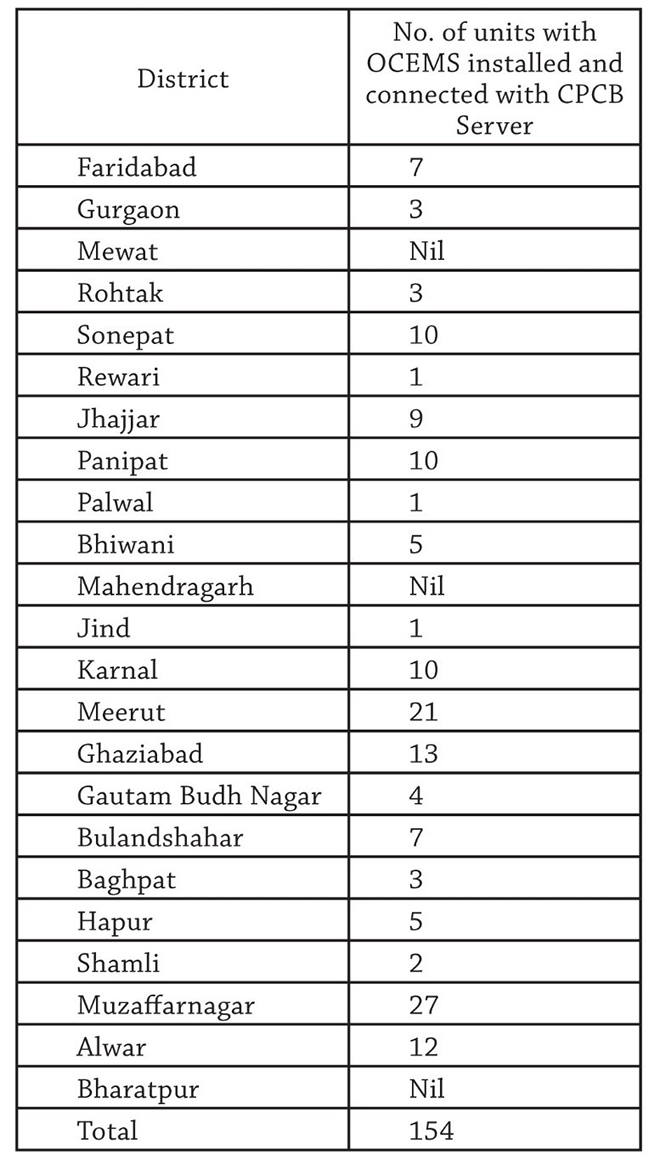
The overall opaqueness of industrial pollution data in India becomes even more alarming given a couple of other factors. The CPCB gets real-time data from thousands of pollution monitors. The data is sent to a central portal run by the agency, which recognises the importance of such data in tracking air pollution. Its parent, the environment ministry, in a reply to Parliament in March 2020 flagged the role of OCEMS in tracking compliance amongst what it called “all red category, air polluting industries”[14] in 23 districts in the National Capital Region (NCR). There are 154 such industries around Delhi, a region which has some of the worst air pollution levels in the world.[b]
Table 2: Emissions and effluents monitoring systems in Delhi
In the United States (US), the Environment Protection Agency (EPA) makes industrial emissions data from all CEMS-regulated monitoring locations freely available to the public. In the countries of the European Union (EU), the European Environmental Agency maintains the European Pollutant Release and Transfer Register (E-PRTR) which contains industrial pollution data from more than 34,000 facilities across 33 EU countries.[16] The data from the E-PRTR register enables citizens to track industrial air pollution data across Europe, including who the top polluters are and the spatial and temporal trends of the emissions for each of those industrial locations. Data made available to citizens allow them to focus on the area where they live; they are made aware of the short- and long-term trends of industrial pollution in their neighbourhoods, and thereby make certain decisions informed by the data. Environmental groups have used such data to identify the air polluters in a region and have held them accountable, such as the Tata Steel plant in Netherlands.[17] Overall, in the European countries, industrial pollution emissions have steadily gone down since 2007,[18] when the datasets were first made available across the Union.
These examples of best practices from the US and EU highlight the importance of having a public that is aware of the pollution emissions around them from stationary sources such as stacks and boiler plants. Tracking emissions from industrial sources helps build accountability amongst people who run the industries and allows citizens to understand the potential sources of pollutants in their vicinity. Tracking OCEMS data is a way to address this part of the air pollution challenge, but the system needs to be made transparent and usable by the affected population.
India’s pollution control officials have the power to shut down industrial plants for polluting the air or water even if they have a valid consent to operate.[19] If any plant has caused “grave injury” to the environment, it can be shut down without a show-cause notice under the Environment (Protection) Act, 1986.
Transparency will also go far in reducing corruption. In mid-October 2020 in Tamil Nadu, the Directorate of Vigilance and Anti-Corruption conducted raids on the rented premises of an environmental engineer[20] of the pollution control board. The authorities seized over INR 3.3 million. The first information to the police mentions that the case was in connection with a meeting of the ZLCCC (zonal level consent clearance committee) for factories in Vellore and other districts in the zone. The ZLCCC meets regularly[21] to grant Consent to Operate permissions to industrial units. The allegation is that the environmental engineer received this money as bribes, in exchange for granting permissions to operate. The investigations are ongoing at the time of writing this brief.
The acute lack of transparency in industrial pollution emission means that whatever little data or information is released will remain shrouded in a cloud of questions. Take for instance, what government refers to as “Grossly Polluting Industries”—those which are monitored through OCEMS primarily for the waste they dump into rivers, especially in the Ganga basin. As of July 2019, according to government records, of almost 2,500 GPIs, as many as 89 percent were complying[22] with environmental standards. The state of Uttar Pradesh, with almost 1,100 GPIs, has reported that 88 percent of these industries are complying with environmental norms; Bihar, with 50, has 100-percent compliance; and Haryana, where the Ganga’s tributary Yamuna flows, has a 98-percent compliance amongst 638 industries. The question thus is, if indeed compliance rate is this high, why then has there only been a marginal improvement[23] in the Ganga pollution levels.
Indeed, there is a strong case for open data on air quality in India. After all, in 2019, India was the 5th most polluted country across the world; it is home to 14 of the top 20 cities[24] with the worst PM 2.5 air pollution levels. Day-to-day monitoring is vital for people especially the vulnerable like the elderly and children, and those with health conditions like asthma and heart disease.
To be sure, there are certain individual, micro-level responses. Some schools, for example, have taken it upon themselves to track air quality more closely. There are schools in the capital that have mandated that all outdoor activities for students will be conducted only if the AQI levels were favourable. Still, sustainable, large-scale responses have remained lacking.
It has become even more urgent as the number of deaths due to air pollution in India has sharply risen by over 500,000 since 2017. A report[25] by the Boston-based Health Effects Institute estimates that the number of deaths in India related to toxic air is somewhere at 1.67 million in 2019, or three deaths per minute. This is higher than the 1.15 million estimated[26] in 2017 by the government’s Indian Council of Medical Research (ICMR).
Conclusion
There is no dearth of scientific evidence that links air pollution to manifold negative health consequences, including low birth weight and pre-term births. The latest edition of the State of Global Air, 2020[27] says that air pollution contributed to over 116,000 infant deaths in India—or a high of one in every five neonatal deaths. This, despite an overall improvement seen in household air pollution, owing partly to the government’s Ujjwala Yojana scheme for poor households, in which biomass is replaced with cleaner LPG for cooking. Transparency around continuous emissions of industrial plants such as coal-fired thermal power plants can help estimate the impact of moving to renewable energy and matching it in the context of power generation efficiency. Most importantly, such information is vital for the people living around these power-generating plants.
Until as recently as November 2019, the government has played down existing model-based estimates on the link of pollution to certain premature deaths.[28] Asked further what schemes there are to protect children from pollution, the environment ministry named a handful, amongst them OCEMS. Yet, pinning the people’s hopes for cleaner air on the currently opaque OCEMS regime, as this brief analysis suggests, may just prove to be highly futile.
About the Authors
Chetan Bhattacharji is Managing Editor at NDTV. Ronak Sutaria is Founder and CEO at Respirer Living Sciences.
Endnotes
[a] CPCB’s chairperson, members and other officials attend such meetings.
[b] In 2019, Delhi PM 2.5 annual average was almost 10 times WHO’s limits. See https://www.iqair.com/us/world-most-polluted-cities
[8] According to the guidelines: “Industries such as Power, Cement, Iron & Steel, Chlor-alkali, Pharmaceuticals, Fertilizers, Refineries, Pesticides, Distilleries, Sugar, Pulp & Paper, Textile, Tanneries, and other categories of industries release large quantum of pollutants through air emissions.”
[14] Rajya Sabha, “Unstarred Question No. 2454: Online Continuous Emission Monitoring System.” Ministry of Environment, Forest and Climate Change, Government of India. March 2020.
The views expressed above belong to the author(s). ORF research and analyses now available on Telegram! Click here to access our curated content — blogs, longforms and interviews.

 PDF Download