INTRODUCTION
India's post-Independence development strategy emphasised state-led industrialisation based on import substitution as an important instrument for sustained growth (Aggarwal and Sato 2011; Unel 2003). Various controls were formulated on the pattern of industrialisation to achieve the development goals laid out in the various five-year plans. The industrial licensing policy of 1951 regulated entry, exit and expansion of industrial units. Private participation was excluded from a number of sectors by reserving them for public sector units (Pandey and Dong 2007). These policy initiatives were complemented by restrictions on foreign technology imports, and high tariff and non- tariff barriers on imports (Aggarwal and Sato 2011; Ahluwalia 2002). The inefficiency in resource use due to industrial controls on output, investment, and trade, brought about through these policy initiatives, resulted in poor TFP growth in the industrial sector of the economy. The annual average growth rates of labour and factor productivity in the manufacturing sector were close to 2 percent and nil, respectively, from 1959-60 to 1979-80 (Unel 2003).
The poor performance of the industrial sector forced policy revisions; a process of reorientation of the policy framework began in the late 1970s and gathered pace in the 1980s (Klein and Palanivel 2000). The process introduced a series of piecemeal reforms during the early 1980s with the objective of improving productivity in existing units. The new economic policies of 1985 accelerated the pace of deregulation and businesses were allowed to expand in related areas without seeking fresh licences under the facility of broad banding. In addition, barriers to entry and expansion were reduced and access to better technology and intermediate material imports became easier.
In addition to the reforms in the 1980s, significant economic and structural reforms occurred after 1991. With the advent of major economic reforms in the 1990s, industrial licensing was abolished in majority of industries, followed by a second wave of de-licensing in the mid-1990s (Kathuria et al. 2013). The economic reforms of 1991 started with liberalising the Indian economy, in general, and its industrial sector in particular, by removing various controls and regulations, establishing a competitive market system, introducing new methods of production, and adopting modern technology to increase productivity and competitiveness (Siraj 2011). The reform process ushered in an era of economic integration where productivity growth was recognised as a key feature of economic dynamism (Sehgal and Sharma 2011; Singh 2012).
Productivity growth is considered the basis of efficient economic growth, where economic growth is defined as the process of a sustained increase in the production of goods and services. Scarcity of resources, which includes physical, financial and human resources, is recognised as a limiting factor to economic growth. While output expansion based on increased use of resources is feasible, it is not sustainable. Therefore, efficiency or productivity of resources becomes a critical factor in economic growth. Moreover, productivity increase induces a rise in output in perpetuity, while this might not be true of input use (Sun and Fulginiti 2007). Productivity measures that relate to only one class of inputs are known as partial productivity measures; such partial measures, however, do not account for interdependence between inputs. A more complete measure of productivity is TFP growth or multi-factor productivity (MFP) that takes into account all the factors of production (or inputs). TFP—defined as the efficiency with which firms turn inputs into output—is the measure of performance of a productive unit.
It is popularly agreed that TFP can be estimated by calculating the growth residual, which includes the growth caused by factors that cannot be observed directly. The factors influencing “the residual” are very complicated, since besides output, the “residual value” may also be affected by factor inputs and technical progress, institutional change, macroeconomic policy, and so on. According to Solow's growth framework, the residual refers to the part of output growth that cannot be explained by the growth in inputs. In this way, TFP is interpreted as a shift of the production function over time, whereas the growth in factor inputs refers to movements along a production function (Ozyurt 2009).
Many studies have analysed the relative contribution of factor inputs and technical progress to economic growth. Here, this paper examines whether the economic growth experience mainly led by the Indian manufacturing sector, is input driven or technology-based. Is the growth in output due to increased application of inputs or due to productivity gains? Further, is this growth sustainable in the long run? The paper evaluates the impact of economic reforms of the 1980s and the 1990s on the manufacturing sector in India by analysing the productivity performance of (registered) manufacturing over the period 1974-75 to 2012-13. The spill-over effects of non- manufacturing sectors and inter-and intra-sectoral effects of trade liberalisation on firm-level productivity are not considered explicitly in the present analysis. The authors present empirical evidence on the growth of productivity in the organised manufacturing sector of India by analysing the inter-temporal and inter-industry comparison of TFP following a parametric approach.
PRODUCTIVITY: CONCEPTS AND MEASUREMENT
The change in productivity over time is widely considered an indicator of the performance of an industry (Rezitis 2006) and can be measured with respect to a single factor input or a combination of inputs (Trivedi et al. 2000).The partial or single factor productivity (PFP), for any specific input, is defined as the ratio of the volume of output to the quantity of the given factor of production. While TFP is defined as the ratio of real output to a weighted sum of the factor inputs and is an indicator of sustained economic growth. Chen (1997) and Trivedi et al. (2000) trace the origin of the concept of TFP to the empirical works of Tinbergen in 1942 and Solow in 1957 that consider TFP as the broadest measure of productivity and efficiency in resource use. In a scenario where partial measures of productivity fail to provide the correct contribution of each factor under changing levels of production, due to factor proportions changing collectively, TFP tries to address this by decomposing changes in production due to variations in the quantity of inputs used and in the residual factors (such as change in technology, capacity utilisation, quality of factors of production, and learning by doing).
Chaudhury (2013) argues that the growth in TFP can be explained as an increase in the residual amount of real output that is not accounted for by the growth in inputs, referred to as an 'index of ignorance'. The TFP growth itself can be separated into two components-efficiency change and technological change (Heshmati and Kumbhakar 2010). Technical efficiency as proposed by Farrell (1957) refers to the ability of a production unit to achieve maximum output from a given set of inputs (Chaudhary 2013). It indicates the degree to which the operating unit produces the maximum feasible output for a given level of inputs, or uses the minimum amount of feasible inputs to produce a given level of output. However, higher efficiency from one period to another does not necessarily suggest that the operating unit achieves higher productivity, since the technology may also have changed during this period (Rezitis 2006). The efficiency component can be broken up into a pure technical change component and an efficiency change component. The technical change component of the growth relates to an increase in output per unit of inputs and is observed as an upward shift of the production function (Sun and Fulginiti 2007).
The measurement of TFP (Chen 1997) crucially depends on: (1) the specification of the relationship between input and output, (2) the proper measurement of the factor inputs, and (3) the weights assigned to the different categories of an input in the aggregation of sub-inputs. There are four prominent approaches to the measurement of TFP: the growth accounting approach; the index number approach; the econometric approach; and the distance function approach (or data envelopment analysis, DEA). The growth accounting approach, econometric approach and index number approach (mainly parametric) assume that the TFP change is due to technical progress alone since efficiency changes are not assumed. The stochastic frontier analysis and DEA method, on the other hand, do not make such an assumption and therefore allow separation of TFP change into technical change and technical efficiency change (Chaudhury 2013).
Alternatively, the growth accounting approach and econometric methods—including the stochastic frontier method—are parametric methods of TFP estimation, whereas the index number approach (non- parametric indices) and DEA are non-parametric methods. Most index number approaches are non-parametric and non-stochastic, with Tronquist type indices which can be calculated directly from the data.
The growth accounting approach (GAA) enables output growth to be separated into growth of different inputs and changes in TFP. This requires specification of a production function that defines what level of output can be produced at a particular time given a set of inputs, and TFP. The three main indices used in the GAA are: (i) Kendrick Index (KI);
(ii) Solow Index (SI); and (iii) Divisia Index; a discrete version of the continuous Divisia index in the translog index (TLI).
Most econometric approaches are parametric and stochastic and rely on the estimation of a Cobb-Douglas (C-D) production function from which input contributions are isolated from productivity change. There is a third approach that is the combination of the first two approaches; a parametric stochastic index approach.
The advantages of using the non-parametric approach are that it avoids imposing a parametric specification for the underlying technology as well as for the distributional assumption of the inefficiency term. However, some weaknesses associated with a non-parametric approach are that this method is deterministic and attributes all the variation from the frontier to inefficiency, a frontier estimated by being likely to be sensitive to measurement errors or other noise in the data. Further, the non-parametric method does not permit statistical tests and hypotheses to pertain to production structure and the degree of inefficiency. The parametric approach employs econometric techniques and the deviation of actual cost from the minimum cost is separated into two parts, viz., the statistical noise and inefficiency. The various alternatives within the parametric approach are as follows: (a) econometric frontier approach; (b) thick frontier approach, and (c) distribution free approach. Each of these approaches involves arbitrary assumptions regarding the distribution of the noise and inefficiency components (Trivedi et al. 2000; Rezitis 2006).
Studies on productivity have essentially relied on the concept of production function for productivity estimates at industry and economy-wide levels. Three most common forms of production functions mainly used in the empirical literature on productivity measurement are: (i) Cobb-Douglas (C-D) production function; (ii) Constant Elasticity of Substitution (CES) production function, and occasionally variable elasticity of substitution (VES); and (iii)
Transcendental Logarithmic (TL) production function. The most frequently used form of production function in empirical studies is C-D production function.
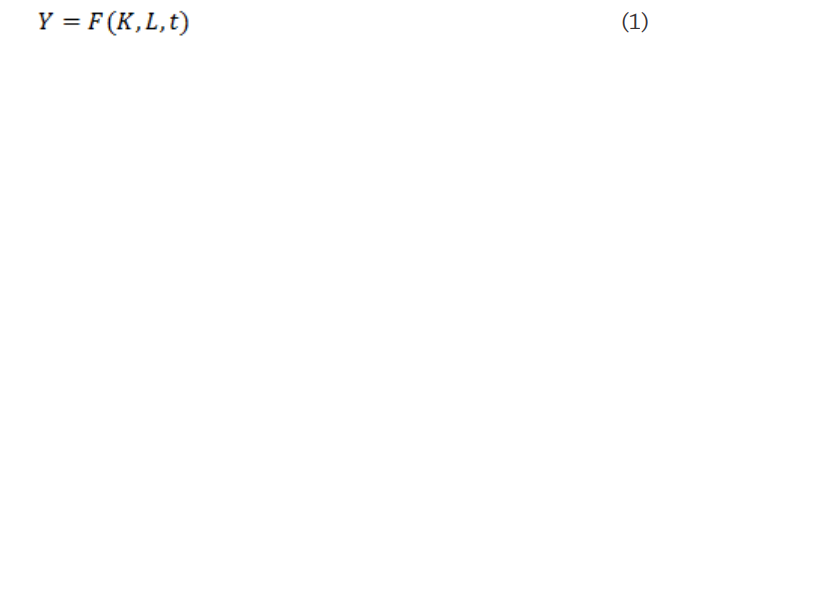
We begin by estimating TFP using a simple a general neo-classical production function given as:
Differentiating the above equation with respect to time and rearranging, we have
 (2)
(2)
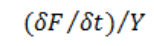 is the proportional rate of shift of the production function. It is therefore technological change or TFP. Under neo- classical assumptions,
  are factor shares of capital and labour respectively. Denoting the growth rates of Y, K, L by Y, K, L respectively, the above equation becomes
 (3)
(3)
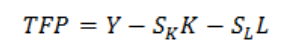
where SK and SL are respectively capital and labour shares in income.
 (4)
(4)
The above equation can therefore be used to calculate the sources of growth, viz. the contribution to growth by capital, labour, and TFP.
Using a C-D production function, TFP estimation can be explained as follows:
The production function for a single good with two factors can be written as
 (5)
(5)
where Yt,Kt,Lt, are output, capital and labour inputs at time t respectively. At is the technology parameter governing the shift of the production function ß is the output elasticity of capital and 1- ß is the output elasticity of labour. Output elasticity measures the response of output to a change in the levels of either labour or capital used in the production.
 Here, At can be defined as

(6)
Indicating that the technology grows at a constant exponential rate of λ
 (7)
(7)
Taking the logarithm on both sides of (7), we get
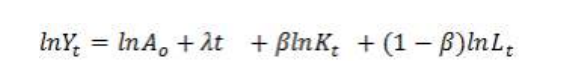 (8)
(8)
λ is the technological change that is not embodied in factor inputs but takes place in the form of better methods and organisation that improve the efficiency of both new and old factor inputs (Chen 1997). The technological change as measured here is thus exogenous.
The C-D production function expressed in log-linear form is in fact the same as eq. (3). TFP thus calculated from eq. (4) is a 'residual' a catch-all sum indicating that part of output growth that cannot be explained by increases in factor inputs.
In essence there is no real difference between the Cobb-Douglas production function estimation and the growth accounting approach as far as the underlying methodology is concerned. The growth accounting method is to use the factor shares in national income as weights when combining the individual factor inputs to form an index of total factor input, and to define that part of output growth which cannot be explained by increases in factor input as TFP.
MATERIALS AND METHODS
3.1 Data
The data cover all the two-digit level Annual Survey of Industries (ASI) list of manufacturing industries according to the International Standard Industrial Classification (ISIC), revision 3.1, corresponding to NIC classification 2008. The data are drawn mainly from the ASI, published by the Central Statistical Organisation (CSO), Government of India. The Economic and Political Weekly has created a systematic, electronic database using ASI results (EPW database). For this analysis, some industries are combined to achieve a sufficiently large number of observations. The industries include basic chemicals and chemical products except petroleum and coal, basic metal and alloy industries, food products, beverages and tobacco, leather and leather products, fur and substitutes of fur, metal products and parts except machinery and equipment, non-metallic mineral products, paper and paper products, printing and reproduction of recorded media, rubber, plastic, petroleum and coal products, textiles and apparel, transport equipment and parts, wood and wood products, and other manufacturing. Since there have been wide variations in productivity and output growth, to understand the broad trends in manufacturing sector in different time periods, the study period has been divided in three sub-periods: (a) Period I (1974-75 to 1991-92), (b) Period II (1992-93 to 2001-02) and
(c) Period III (2002-03 to 2012-13.The reason for choosing 1974-75 as
the initial year of the study is that a major change in the classification of industries was introduced that year. It is to be noted that during the 39 years of this analysis period, industrial classification has undergone changes.
Construction of the variables and sources of data:
The series on value of gross output at constant price representing the total output of the manufacturing sector was obtained by deflating the series by GDP deflator at 2004-05 prices. The capital stock series was constructed using the Perpetual Inventory Method. In order to construct it the following information was used: benchmark capital stock, gross investment and depreciation. In this study, the benchmark year for constructing capital stock is 1973-74. The benchmark year capital stock was created by multiplying the fixed capital of that year with the gross-net ratio obtained from Balakrishnan and Pushpangadan (1994). The investment figures were obtained using the following formula
 (8)
(8)
where Bis the book value of fixed capital, D is the depreciation andis the price index for machinery and machine tools for the year t. Finally the capital stock series was constructed by using the formula

 (9)
(9)
wher Kt is the capital stock for the period t, It, is the gross investment in period t and δ is the annual rate of depreciation of capital. The annual rate of depreciation of capital is taken as 5 percent following Unel (2003).
The series on energy was constructed using the series on fuel consumption. Given that the fuel consumption consists of varying amount of coal, petroleum, natural gas and electricity for different industries during the accounting year, the series was deflated by GDP deflator at 2004-05 prices. Similarly, the series on materials consumed was deflated by GDP deflator at 2004-05 prices. Materials consumed represents the total delivered value of all items of raw materials, chemicals, packing materials and stores which actually entered into the production process of the factory during the accounting year. The series on labour was obtained by using the series on total emoluments defined as the sum of wages and salaries including bonus. It was also deflated by GDP deflator at 2004-05 prices.
3.2 Methods
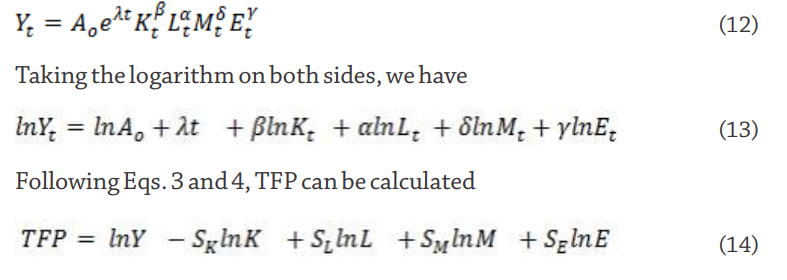
We assume a general Cobb-Douglas production function with four inputs; capital (K), labour (L), energy (E) and material (M).
 (10)
(10)
where Yt, Kt, Lt, Mt, Et, are output, capital, labour, material and energy inputs at time t respectively. At is the technology parameter governing the shift of the production function. ß the output elasticity of capital, α the output elasticity of labour, δ the output elasticity of material and γ the output elasticity of energy. Output elasticity measures the responsiveness of output to a change in level of labour, capital, energy or material used in the production.
Here, Atcan be defined as

(11)
Indicating that the technology grows at a constant exponential rate of λ With technology included, the production function can be rewritten as:
FINDINGS OF THE STUDY
Table 1 reports the total manufacturing in India from 1975-76 to 2012-
13. The manufacturing sector has experienced an increase in emoluments at an average rate of 4.6 percent per annum, capital at 3.78 percent, energy at 6.98 percent and materials at 8.11 percent. The output generated by this sector has increased at an average rate of 7.83 percent annually, while the increase was 6.51 percent during the period 1975-76 to 1991-92, 6.43 percent - the lowest among all the sub- periods- during 1992-93 to 2001-04, and 11.11 percent from 2002-03 to 2012-13. Moving to a disaggregated picture, we find that among all the factor inputs considered here, the increase in capital use has been the lowest with figures ranging from 1.86 to 4.22 percent. Instead, the use of materials has been relatively more than other inputs. Looking at the rate of change in the use of these inputs through different sub- periods, we found that the use of energy and materials show a decline from sub-period I to sub-period II. Labour in the form of emoluments paid has marginally increased between these two periods. However, we observe marginal increase (less than 1 percent) in all the inputs use from sub-period II to sub-period III.
Table1: Growth in Indian Manufacturing
(average percent per annum)
|
Period
|
Value of gross output
|
Capital
|
Labour
|
Energy
|
Materials
|
|
1975-76 - 2012-13
|
7.83
|
3.78
|
4.60
|
6.98
|
8.11
|
|
1975-76 - 1991-92
|
6.51
|
1.86
|
3.33
|
8.25
|
6.87
|
|
1992-93 - 2001-02
|
6.43 (-0.01)
|
4.22 (1.27)
|
4.10 (0.23)
|
4.73 (-0.42)
|
6.11 (-0.11)
|
|
2002-03 - 2012-13
|
11.11 (0.72)
|
6.34 (0.50)
|
7.00 (0.70)
|
7.07 (0.49)
|
11.86 (0.94)
|
Note: Figures in parentheses show the rate of change.
Source: Authors' calculations
A comparative view of the various industries in terms of capital intensities and average shares of various inputs is given in Tables 2 and
3. It is seen that the basic metal and alloy industry accounted for the highest share of energy (27.23 percent) and capital (24.09 percent), from 1974-75 to 2012-13. Labour use (14.45 percent) is the second highest in this industry while material use is the highest (22.16 percent) in rubber, plastic, petroleum and coal products, followed by food products, beverages, tobacco and related products (19.23 percent) and basic metal and alloy industry (14.35 percent). This scenario remains the same from 1974-75 to 1991-92. Average share of emoluments is highest in the textiles industry (24.55 percent), capital and energy highest in the basic metal and alloy industry (25.41 percent and 26.46 percent respectively), and material in the food products, beverages, tobacco and related products industry (24.69 percent). This trend continues in the second sub-period with some changes observed from 2002-03 to 2012-13. Basic metal and alloy industry accounts for the highest average share of capital (23.26 percent), emoluments (14.58 percent) and energy (29.3 percent) whereas material use is the highest in rubber, plastic, petroleum and coal products industry (26.3 percent).We also examine that this industry accounts for as high as 18 percent of the value of gross output of the manufacturing sector during the entire period 1974-75 to 2012-13, and close to 22 percent during
2002-03 to 2012-13. The other sub-period estimates point at food products, beverages, tobacco and related products industry contributing the highest to the value of gross output of the manufacturing sector, with contributions to the tune of 21 percent from 1974-75 to 1991-92 and 19.77 percent from 1992-93 to 2001-02.
To sum up, on an average, the textiles industry provided the maximum emoluments (16.5 percent of the total employment in the manufacturing sector) from 1974-75 to 2012-13, capital investment (24.09 percent) and energy use (27.23 percent) were the highest in Basic metal and alloy industry during the same period while rubber, plastic, petroleum and coal products industry accounted for the highest use of material (27.23 percent).
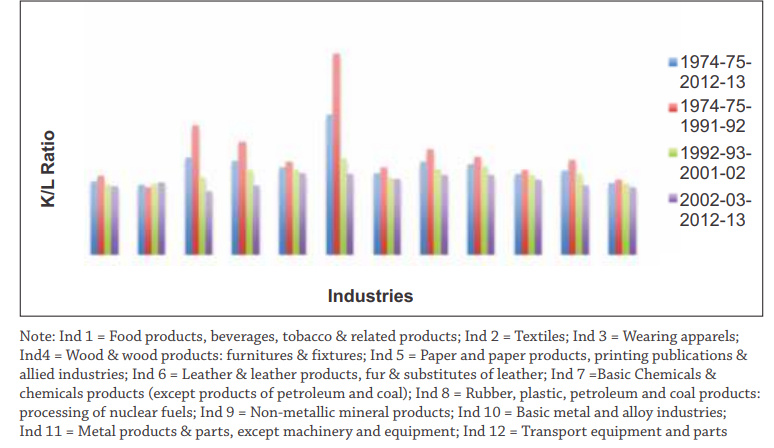
On examining capital intensities in each industry, we find that lower capital availability in textiles, transport equipment, food products, beverages, and tobacco industries as compared to the leather industry, though the leather industry experienced a sharp decline in capital intensity from sub-period I to sub-period II (Fig.1). It declined further in sub-period III. The basic metal and alloy industry, even with high capital share, fares poorly on capital intensity measures. Sub-period estimates show a decline in capital intensity in this industry. It is worth noting that capital intensities across the manufacturing sector have been around 2 percent over the years 1974-75 to 2012-13, while period- on-period change suggests that the capital intensity has mostly declined in each industry barring the textiles industry. This argument is supported by the rate of change figures in Table 3.

Table 2: Average shares of real capital stock, emoluments, fuel consumed, material used and real value of gross output of various industries in the manufacturing sector
(As a percentage of manufacturing sector)
|
Industry
|
1974-75 - 2012-13
|
1974-75 - 1991-92
|
1992-93 - 2001-02
|
2002-03 - 2012-13
|
|
VGO
|
K
|
L
|
E
|
M
|
VGO
|
K
|
L
|
E
|
M
|
VGO
|
K
|
L
|
E
|
M
|
VGO
|
K
|
L
|
E
|
M
|
|
Ind 1
|
17.41
|
10.03
|
13.68
|
8.36
|
19.23
|
20.94
|
10.27
|
12.74
|
8.43
|
24.69
|
19.77
|
9.97
|
14.94
|
8.38
|
23.07
|
15.53
|
9.91
|
13.56
|
8.33
|
16.47
|
|
Ind 2
|
9.28
|
12.17
|
16.46
|
12.74
|
8.69
|
14.46
|
12.80
|
24.55
|
14.88
|
13.64
|
11.45
|
12.60
|
16.30
|
14.02
|
11.43
|
6.99
|
11.54
|
11.45
|
11.33
|
6.44
|
|
Ind 3
|
1.90
|
0.86
|
3.49
|
0.64
|
1.55
|
1.78
|
0.65
|
1.42
|
0.39
|
1.65
|
2.41
|
0.82
|
2.77
|
0.61
|
2.06
|
1.75
|
1.02
|
5.19
|
0.74
|
1.35
|
|
Ind 4
|
3.01
|
1.40
|
3.16
|
0.70
|
3.16
|
1.51
|
1.39
|
2.11
|
0.52
|
1.38
|
2.50
|
1.39
|
2.95
|
0.73
|
2.40
|
3.62
|
1.41
|
3.93
|
0.76
|
3.90
|
|
Ind 5
|
2.74
|
4.90
|
4.95
|
4.34
|
2.32
|
3.46
|
5.35
|
5.38
|
5.02
|
2.81
|
3.35
|
5.05
|
5.23
|
4.98
|
2.88
|
2.31
|
4.53
|
4.51
|
3.78
|
2.00
|
|
Ind 6
|
1.00
|
0.40
|
1.34
|
0.39
|
1.04
|
1.14
|
0.29
|
0.99
|
0.25
|
1.30
|
1.23
|
0.40
|
1.23
|
0.37
|
1.36
|
0.88
|
0.47
|
1.62
|
0.44
|
0.87
|
|
Ind 7
|
15.00
|
21.64
|
13.50
|
19.25
|
13.00
|
15.52
|
23.08
|
13.03
|
21.89
|
13.74
|
18.45
|
22.74
|
15.97
|
22.05
|
16.01
|
13.63
|
20.11
|
12.41
|
16.90
|
11.80
|
|
Ind 8
|
18.00
|
8.27
|
6.23
|
6.46
|
22.16
|
12.58
|
5.84
|
4.28
|
4.34
|
15.80
|
12.31
|
7.27
|
5.96
|
5.41
|
14.95
|
21.62
|
10.38
|
7.60
|
7.75
|
26.29
|
|
Ind 9
|
3.95
|
6.59
|
5.59
|
14.43
|
2.30
|
4.16
|
5.81
|
5.05
|
13.23
|
2.59
|
4.17
|
6.64
|
5.20
|
14.73
|
2.42
|
3.82
|
7.06
|
6.15
|
14.72
|
2.18
|
|
Ind 10
|
15.43
|
24.09
|
14.45
|
27.23
|
14.35
|
14.87
|
25.41
|
14.74
|
26.46
|
13.38
|
13.47
|
24.05
|
13.87
|
23.57
|
12.30
|
16.30
|
23.26
|
14.58
|
29.30
|
15.30
|
|
Ind 11
|
3.17
|
2.24
|
4.78
|
1.95
|
2.92
|
2.72
|
2.16
|
3.54
|
1.41
|
2.60
|
2.77
|
2.11
|
4.03
|
1.88
|
2.63
|
3.44
|
2.36
|
5.98
|
2.18
|
3.11
|
|
Ind 12
|
9.12
|
7.40
|
12.40
|
3.51
|
9.27
|
6.86
|
6.94
|
12.17
|
3.17
|
6.44
|
8.13
|
6.97
|
11.55
|
3.28
|
8.49
|
10.11
|
7.94
|
13.01
|
3.75
|
10.30
|
Source: Authors' calculations
Table 3: Average capital intensity in the Indian manufacturing Industry
|
Industry
|
1974-75 -
2012-13
|
1974-75 -
1991-92
|
1992 -93 -
2002-03
|
2002-03 -
2012-13
|
|
K/L
|
K/L
|
K/L
|
K/L
|
|
Food products, beverages, tobacco & related products
|
1.84
|
1.96
|
1.74 (-0.11)
|
1.71 (-0.01)
|
|
Textiles
|
1.74
|
1.69
|
1.76 (0.04)
|
1.80 (0.02)
|
|
Wearing Apparels
|
2.43
|
3.22
|
1.94 (-0.39)
|
1.58 (-0.18)
|
|
Wood & wood products; furniture &fixtures
|
2.34
|
2.81
|
2.11 (-0.24)
|
1.74 (-0.17)
|
|
Paper and paper products, printing publications & allied industries
|
2.19
|
2.33
|
2.11 (-0.09)
|
2.03 (-0.03)
|
|
Leather & leather products, fur & substitutes of leather
|
3.50
|
5.01
|
2.42 (-0.51)
|
2.02 (-0.16)
|
|
Basic chemicals & chemical products (except products of petroleum and coal)
|
2.03
|
2.18
|
1.91 (-0.12)
|
1.89 (-0.01)
|
|
Rubber, plastic, petroleum and coal products; processing of nuclear fuels
|
2.32
|
2.63
|
2.14 (-0.18)
|
1.98 (-0.07)
|
|
Non-metallic mineral products
|
2.25
|
2.44
|
2.20 (-0.09)
|
2.00 (-0.09)
|
|
Basic metal and alloy industries
|
2.01
|
2.11
|
1.99 (-0.05)
|
1.87 (-0.06)
|
|
Metal products & parts, except machinery and equipment
|
2.09
|
2.36
|
2.01 (-0.14)
|
1.73 (-0.13)
|
|
Transport equipment and parts
|
1.79
|
1.87
|
1.77 (-0.05)
|
1.69 (-0.04)
|
Source: Authors' calculations
Note: Figures in parentheses show the rate of change.
Table 4 presents results of the production function estimation, with output from both the fixed-effects and random-effects models. It is seen from the table that the estimates obtained by the fixed-effects and the random effects are close (almost similar) for the entire study period
(1974-75 to 2012-13) except for the time variable, which is significant only in the random-effects model. Going by the p-value for Hausman test, the estimates obtained by the fixed-effects model are preferred. The insignificant time trend variable, which captures the unobserved exogenous components of technical change as well as economic policy effects, indicates that economic growth can be accounted for by increases in factor inputs rather than technological change.
Fig 1: Average capital intensity in the Indian manufacturing Industry
The sub-period estimates, beginning with period -I, suggest the fixed- effects model as a preferred choice. Technological change is seen to have a negative impact on output growth. This period is characterised by inward looking economic policies. The manufacturing sector was protected from international competition with quotas and tariffs on imports, while a complex system of industrial licensing governed the entry of private firms into the manufacturing sector. Moreover, most enterprises were small and the informal economy huge and growing over time; as a result, the advantages of economies of scale were low.
The random effects result for the second sub-period hint towards statistically insignificant capital input use in the growth of output. The output growth in this period is largely dependent on the use of material inputs (with coefficient value of 0.78) and labour (0.16), and technological change (0.008). In the last sub-period 2002-03 to 2012- 13, results from the random effects model suggest statistically insignificant capital and poor TFP. These results show that the production process in the Indian manufacturing sector was mainly based on the use of material, labour and energy.
Table 4: Estimates of production function-Indian manufacturing
|
Explanatory Variables
|
Fixed Effects
|
Random Effects
|
|
Period: 1974-75 - 2012-13
|
|
|
Coefficients
|
t-statistics
|
Coefficients
|
z-statistics
|
|
ln(K)
|
0.091336*
|
5.06
|
0.064951*
|
4.30
|
|
ln(L)
|
0.086339*
|
6.10
|
0.099208*
|
7.75
|
|
ln(E)
|
0.063050*
|
4.55
|
0.052676*
|
4.35
|
|
ln(M)
|
0.809871*
|
84.33
|
0.802878*
|
85.10
|
|
t (time)
|
0.001129
|
1.13
|
0.002827*
|
3.64
|
|
No. of observations
|
468
|
|
Overall R2
|
0.9935
|
|
0.9945
|
|
|
Hausman Statistics
|
18.61*
|
|
Wald Chi2 (5)
|
|
|
154891.98
|
|
|
Period-I: 1974-75 - 1991-92
|
|
|
Coefficients
|
t-statistics
|
Coefficients
|
z-statistics
|
|
ln(K)
|
0.3874991*
|
5.44
|
-0.0212954
|
-0.78
|
|
ln(L)
|
0.1044384*
|
3.54
|
0.1105712*
|
4.02
|
|
ln(E)
|
0.0862948*
|
3.72
|
0.1034038*
|
4.82
|
|
ln(M)
|
0.8415373*
|
36.91
|
0.8007637*
|
39.93
|
|
t (time)
|
-0.0122985*
|
-6.15
|
-0.0031194**
|
-2.07
|
|
No. of observations
|
216
|
|
Overall R2
|
0.9723
|
|
0.9956
|
|
|
Hausman Statistics
|
55.45*
|
|
Wald Chi2 (5)
|
|
|
20810.05
|
|
|
Period-II: 1992-93 - 2001-02
|
|
|
Coefficients
|
t-statistics
|
Coefficients
|
z-statistics
|
|
ln(K)
|
-0.0625861
|
-0.81
|
-0.0047931
|
-0.12
|
|
ln(L)
|
0.1791854*
|
3.44
|
0.1553412*
|
3.19
|
|
ln(E)
|
0.0077299
|
0.22
|
0.0525773
|
1.69
|
|
ln(M)
|
0.8121316*
|
23.29
|
0.7790779*
|
24.77
|
|
t (time)
|
0.0111416*
|
3.16
|
0.0082918*
|
4.81
|
|
No. of observations
|
120
|
|
Overall R2
|
0.9692
|
|
0.9960
|
|
|
Hausman Statistics
|
10.16
|
|
Wald Chi2 (5)
|
|
|
20810.05
|
|
|
Period-III: 2002-03 - 2012-13
|
|
|
Coefficients
|
t-statistics
|
Coefficients
|
z-statistics
|
|
ln(K)
|
-0.1213834
|
-1.46
|
-0.0061924
|
-0.14
|
|
ln(L)
|
0.1355278*
|
3.33
|
0.0917133*
|
3.08
|
|
ln(E)
|
0.0748943
|
1.72
|
0.1029693*
|
3.03
|
|
ln(M)
|
0.776712*
|
24.57
|
0.7739687*
|
32.14
|
|
t (time)
|
0.0099036**
|
2.06
|
0.0033031
|
1.30
|
|
No. of observations
|
132
|
|
Overall R2
|
0.9810
|
|
0.9929
|
|
|
Hausman Statistics
|
4.27
|
|
Wald Chi2 (5)
|
|
|
10458.63
|
|
*Significant at 1% level ** significant at 5 %.
Source: Authors' calculations
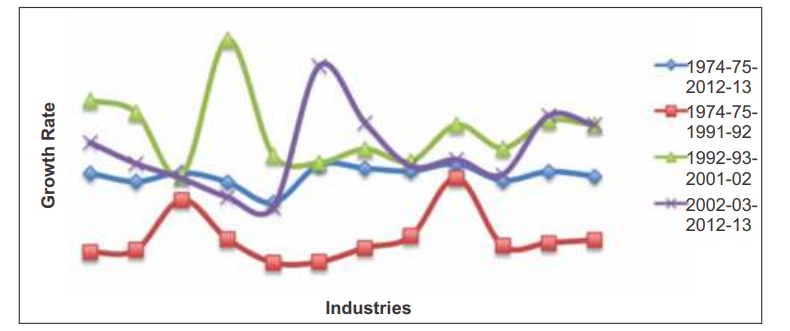
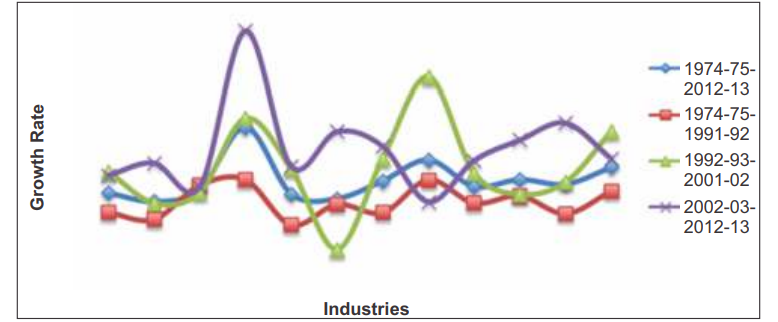
The details of TFP growth computed in this study are provided in Table 5 and Fig 2.The overall TFP growth of the manufacturing sector is very poor of the order of 0.07 percent. However, period-wise productivity growth is mixed; a decline (of close to 1 percent) in the first sub-period, positive (0.89 percent) in the second and positive again (0.52 percent) in the third sub-period. Industries that have witnessed productivity improvement, even though marginally, during the entire study period are: non-metallic mineral products, apparel, food products, beverages tobacco, metal products, transport equipment, rubber, petroleum coal products, basic chemicals and l eather. All industries except non-metallic mineral products experienced a decline in TFP in sub-period I. However, the manufacturing sector shows improvement in its factor productivity growth from 1992-93 to 2001-02
(sub-period II). The growth remains positive for most of the industries other than wood and wood products and paper industries, where TFP declined by less than 0.5 percent during the period 2002-03 to 2012-13.
The details of TFP growth computed in this study are provided in Table 5 and Fig 2.The overall TFP growth of the manufacturing sector is very poor of the order of 0.07 percent. However, period-wise productivity
growth is mixed; a decline (of close to 1 percent) in the first sub-period, positive (0.89 percent) in the second and positive again (0.52 percent) in the third sub-period. Industries that have witnessed productivity improvement, even though marginally, during the entire study period are: non-metallic mineral products, apparel, food products, beverages tobacco, metal products, transport equipment, rubber, petroleum coal products, basic chemicals and leather. All industries except non- metallic mineral products experienced a decline in TFP in sub-period I. However, the manufacturing sector shows improvement in its factor productivity growth from 1992-93 to 2001-02 (sub-period II). The growth remains positive for most of the industries other than wood and wood products and paper industries, where TFP declined by less than
0.5 percent during the period 2002-03 to 2012-13.
Table 5: Total factor productivity growth in the Indian manufacturing (1975-76 to 2012-13)
(average annual growth in percentage)
|
Industry
|
1975-76-
2012-13
|
1975-76-
1991-92
|
1992-93-
2001-02
|
2002-03-
2012-13
|
|
TFPG
|
TFPG
|
TFPG
|
TFPG
|
|
Food products, beverages, tobacco & related products
|
0.12
|
-1.31
|
1.45
|
0.68
|
|
Textiles
|
-0.03
|
-1.27
|
1.23
|
0.30
|
|
Wearing Apparels
|
0.13
|
-0.36
|
0.08
|
0.03
|
|
Wood & wood products; furniture & fixtures
|
-0.04
|
-1.07
|
2.55
|
-0.31
|
|
Paper and paper products, printing publications & allied industries
|
-0.41
|
-1.50
|
0.45
|
-0.49
|
|
Leather & leather products, fur & substitutes of leather
|
0.27
|
-1.49
|
0.31
|
2.07
|
|
Basic chemicals & chemical products (except products of petroleum and coal)
|
0.21
|
-1.23
|
0.56
|
1.04
|
|
Rubber, plastic, petroleum and coal products; processing of nuclear fuels
|
0.16
|
-1.02
|
0.34
|
0.25
|
|
Non-metallic mineral products
|
0.29
|
0.04
|
1.00
|
0.37
|
|
Basic metal and alloy industries
|
-0.01
|
-1.19
|
0.58
|
0.10
|
|
Metal products & parts, except machinery and equipment
|
0.15
|
-1.14
|
1.08
|
1.17
|
|
Transport equipment and parts
|
0.07
|
-1.09
|
1.00
|
1.00
|
|
Overall average
|
0.07
|
-1.05
|
0.89
|
0.52
|
Source: Authors' calculations
Fig 2: Total factor productivity growth in Indian manufacturing (1974-75 to 2012-13)
Note: Ind 1 = Food products, beverages, tobacco & related products; Ind 2 = Textiles; Ind 3 = Wearing apparels; Ind4 = Wood & wood products: furnitures & fixtures; Ind 5 = Paper and paper products, printing publications & allied industries; Ind 6 = Leather & leather products, fur & substitutes of leather; Ind 7 =Basic Chemicals & chemicals products (except products of petroleum and coal); Ind 8 = Rubber, plastic, petroleum and coal products: processing of nuclear fuels; Ind 9 = Non-metallic mineral products; Ind 10 = Basic metal and alloy industries;Ind 11 = Metal products & parts, except machinery and equipment; Ind 12 = Transport equipment and parts
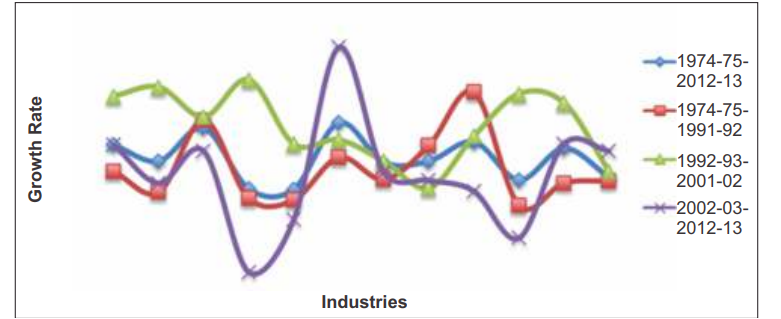
In Figures 3 to 6, yearly movements in partial factor productivity of each input are shown, while growth rates are reported in Table 6. Growth of capital productivity seems to be highest in wood & wood products (8.17 percent). Sub-period estimates also support this finding except for the first sub-period 1974-75 to 1991-92 in which the apparel industry takes the lead.
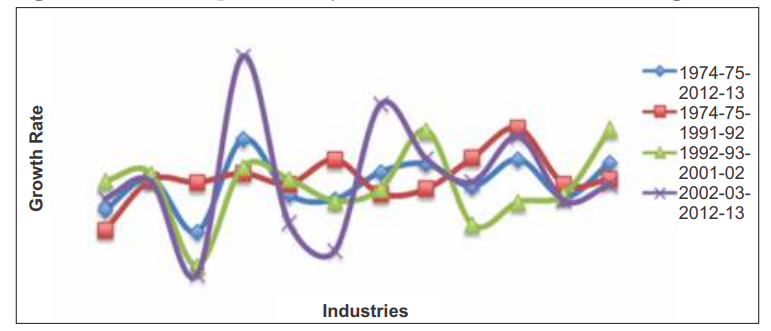
The wood and wood products industry also seems to have experienced high growth rates in labour productivity with 2002-03 to 20012-13, estimates standing at 11.51 percent per annum, and the overall figure at 5.87 percent. The apparel industry reports the lowest growth with figures like -3.32 percent and -0.43 percent per annum respectively for the same time periods.
The wood and wood products industry stands out again for its productivity gains in energy use with an overall figure of 5.08 percent and 13.39 percent per annum during the period 2002-03 to 2012-13.
The rubber, plastic, petroleum and coal products industries show improvement in energy productivity during the period 1992-93 to 2001-02 with an average annual figure of 9.40 percent. The poorest performance during the same period was by the leather industry (-5.54 percent per annum). Surprisingly, in the sub-period 1974-75 to 1991- 92 the maximum gain in energy productivity was an average of 0.50 percent per annum, while the drop was to the extent of 3.39 percent in the paper industry.
Productivity gains in terms of material use are quite low (0.61 percent in the leather industry) for the entire manufacturing sector across all periods; a maximum of 1.94 percent on average in the leather industry, while the drop is in the order of -2.04 percent in wood and wood products from 2002-03 to 2012-13.
Across industries, overall capital productivity growth ranges from an average of 1.46 to 8.17 percent. The comparative figures for labour are -
0.43 to 5.87 percent, energy from -1.39 to 5.08 percent annually and material from an average -0.58 to 0.61 percent.
Table 6: Partial factor productivity growth in the Indian manufacturing
(average annual growth in percentage)
|
Year
|
Ind 1
|
Ind 2
|
Ind 3
|
Ind 4
|
Ind 5
|
Ind 6
|
Ind 7
|
Ind 8
|
Ind 9
|
Ind 10
|
Ind 11
|
Ind 12
|
|
PFP of Capital
|
|
1975-76 - 2012-13
|
2.80
|
1.46
|
3.17
|
8.17
|
2.93
|
2.66
|
4.42
|
5.67
|
3.58
|
5.30
|
3.84
|
5.30
|
|
1975-76 - 1991-92
|
3.95
|
1.92
|
7.06
|
5.01
|
4.25
|
6.48
|
5.76
|
5.99
|
6.97
|
6.31
|
4.37
|
5.16
|
|
1992-93 - 2001-02
|
1.92
|
-0.21
|
-0.78
|
8.53
|
2.26
|
-1.00
|
2.08
|
4.39
|
-0.33
|
1.94
|
2.87
|
5.00
|
|
2002-03 - 2012-13
|
1.78
|
2.07
|
0.18
|
11.97
|
1.38
|
0.67
|
3.69
|
5.29
|
2.50
|
6.12
|
4.68
|
4.94
|
|
PFP of Labour
|
|
1975-76 - 2012-13
|
1.07
|
3.19
|
-0.43
|
5.87
|
2.13
|
1.78
|
3.65
|
4.20
|
2.67
|
4.51
|
1.95
|
4.29
|
|
1975-76 - 1991-92
|
-0.29
|
3.13
|
2.95
|
3.57
|
2.84
|
4.50
|
2.18
|
2.52
|
4.63
|
6.66
|
2.82
|
3.18
|
|
1992-93 - 2001-02
|
3.05
|
3.54
|
-2.71
|
4.01
|
3.17
|
1.69
|
2.48
|
6.47
|
0.07
|
1.61
|
2.12
|
6.57
|
|
2002-03 - 2012-13
|
1.84
|
3.00
|
-3.32
|
11.51
|
0.20
|
-1.71
|
8.25
|
4.54
|
2.98
|
6.07
|
1.70
|
2.83
|
PFP of Energy
|
1975-76 - 2012-13
|
-0.64
|
-1.39
|
-0.35
|
5.08
|
-0.73
|
-1.13
|
0.40
|
2.23
|
-0.07
|
0.53
|
0.12
|
1.59
|
|
1975-76 - 1991-92
|
-2.31
|
-2.90
|
0.03
|
0.50
|
-3.39
|
-1.61
|
-2.34
|
0.50
|
-1.51
|
-0.87
|
-2.42
|
-0.46
|
|
1992-93 - 2001-02
|
1.22
|
-1.53
|
-0.59
|
5.85
|
1.46
|
-5.54
|
2.34
|
9.40
|
1.08
|
-0.76
|
0.30
|
4.70
|
|
2002-03 - 2012-13
|
0.90
|
1.97
|
-0.10
|
13.39
|
1.68
|
4.70
|
3.43
|
-1.40
|
2.19
|
3.97
|
5.45
|
2.35
|
|
PFP of Material
|
|
1975-76 - 2012-13
|
0.21
|
-0.08
|
0.52
|
-0.57
|
-0.58
|
0.61
|
-0.10
|
-0.08
|
0.27
|
-0.42
|
0.15
|
-0.36
|
|
1975-76 - 1991-92
|
-0.26
|
-0.63
|
0.65
|
-0.73
|
-0.76
|
-0.01
|
-0.40
|
0.20
|
1.15
|
-0.86
|
-0.46
|
-0.43
|
|
1992-93 - 2001-02
|
1.07
|
1.23
|
0.70
|
1.36
|
0.22
|
0.30
|
-0.08
|
-0.55
|
0.36
|
1.11
|
0.95
|
-0.25
|
|
2002-03 - 2012-13
|
0.21
|
-0.46
|
0.10
|
-2.04
|
-1.11
|
1.94
|
-0.27
|
-0.41
|
-0.61
|
-1.44
|
0.23
|
0.10
|
Source: Authors' calculations
Note: Ind 1 = Food products, beverages, tobacco & related products; Ind 2 = Textiles; Ind 3 = Wearing apparels; Ind4 = Wood & wood products: furnitures & fixtures; Ind 5 = Paper and paper products, printing publications & allied industries; Ind 6 = Leather & leather products, fur & substitutes of leather; Ind 7 =Basic Chemicals & chemicals products (except products of petroleum and coal); Ind 8 = Rubber, plastic, petroleum and coal products: processing of nuclear fuels; Ind 9 = Non-metallic mineral products; Ind 10 = Basic metal and alloy industries;
Ind 11 = Metal products & parts, except machinery and equipment; Ind 12 = Transport equipment and parts
 Fig 3: Partial factor productivity growth of capital in Indian manufacturing
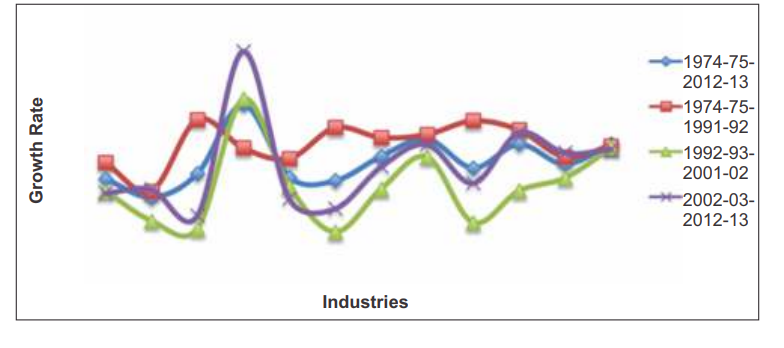
 Fig 4: Partial factor productivity of labour in Indian manufacturing
Note: Ind 1 = Food products, beverages, tobacco & related products; Ind 2 = Textiles; Ind 3 = Wearing apparels; Ind4 = Wood & wood products: furnitures & fixtures; Ind 5 = Paper and paper products, printing publications & allied industries; Ind 6 = Leather & leather products, fur & substitutes of leather; Ind 7 =Basic Chemicals & chemicals products (except products of petroleum and coal); Ind 8 = Rubber, plastic, petroleum and coal products: processing of nuclear fuels; Ind 9 = Non-metallic mineral products; Ind 10 = Basic metal and alloy industries;
Ind 11 = Metal products & parts, except machinery and equipment; Ind 12 = Transport equipment and parts
 Fig 5: Partial factor productivity of energy in Indian manufacturing
Note: Ind 1 = Food products, beverages, tobacco & related products; Ind 2 = Textiles; Ind 3 = Wearing apparels; Ind4 = Wood & wood products: furnitures & fixtures; Ind 5 = Paper and paper products, printing publications & allied industries; Ind 6 = Leather & leather products, fur & substitutes of leather; Ind 7 =Basic Chemicals & chemicals products (except products of petroleum and coal); Ind 8 = Rubber, plastic, petroleum and coal products: processing of nuclear fuels; Ind 9 = Non-metallic mineral products; Ind 10 = Basic metal and alloy industries;
Ind 11 = Metal products & parts, except machinery and equipment; Ind 12 = Transport equipment and parts
 Fig 6: Partial factor productivity of material in Indian manufacturing
Note: Ind 1 = Food products, beverages, tobacco & related products; Ind 2 = Textiles; Ind 3 = Wearing apparels; Ind4 = Wood & wood products: furnitures & fixtures; Ind 5 = Paper and paper products, printing publications & allied industries; Ind 6 = Leather & leather products, fur & substitutes of leather; Ind 7 =Basic Chemicals & chemicals products (except products of petroleum and coal); Ind 8 = Rubber, plastic, petroleum and coal products: processing of nuclear fuels; Ind 9 = Non-metallic mineral products; Ind 10 = Basic metal and alloy industries;
Ind 11 = Metal products & parts, except machinery and equipment; Ind 12 = Transport equipment and parts
POLICY IMPLICATIONS FOR 'MAKE IN INDIA'
In the background of the declining share of the manufacturing sector in country's gross domestic product (GDP) and joblessness in the sector, the Indian government launched the 'Make in India' initiative in September 2014, to facilitate investment, foster innovation, enhance skill development, protect intellectual property and build best-in-class manufacturing infrastructure in the country.
The share of the manufacturing sector in country's GDP has roughly been around 15 percent in the last two decades or so, while the services sector share, which has been increasing steadily from around 43 percent in 1990-91, reached 58.4 percent in 2011-12 (Table 7). In 2014-15, almost 72.4 percent of the growth in India's GDP came from the services sector. At present, India's manufacturing makes up around 17 percent of GDP, compared to Malaysia's 24 percent and Thailand's 33 percent. The pattern of sectoral share of employment has changed over the last two decades with the share of agriculture falling, and of industry and services rising steadily. Services share in employment at 28.5 percent in 2011-12 is higher than industry's at 24.4 percent (Table 8).
Table 7: Sectoral composition of GDP in different sectors of Indian economy
|
Year
|
Agriculture & Allied
|
Industry
|
Services (in Rs. Cr.) at
|
|
|
Services (in Rs. Cr.)
at 2004-05 Prices
|
Manufacturing (in Rs. Cr.) at 2004-05 Prices
|
Other industrial sectors
(in Rs. Cr.) at 2004-05 Prices
|
2004-05
Prices
|
|
1970-71
|
2,45,699 (41.7)
|
75,118 (12.8)
|
64,203 (10.9)
|
1,96,158 (33.3)
|
|
1975-76
|
2,72,899 (39.9)
|
88,482 (12.9)
|
73,241 (10.7)
|
2,40,036 (35.1)
|
|
1980-81
|
2,85,015 (35.7)
|
1,11,376 (13.9)
|
93,485 (11.7)
|
3,00,614 (37.6)
|
|
1985-86
|
3,33,616 (32.9)
|
1,47,496 (14.5)
|
1,15,489 (11.4)
|
4,09,162 (40.4)
|
|
1990-91
|
3,97,971 (29.5)
|
2,03,295 (15.1)
|
1,69,065 (12.5)
|
5,73,465 (42.5)
|
|
1995-96
|
4,47,127 (25.7)
|
2,84,221 (16.4)
|
2,10,041 (12.1)
|
7,94,041 (45.7)
|
|
2000-01
|
5,22,755 (22.3)
|
3,63,163 (15.5)
|
2,76,880 (11.8)
|
11,79,976 (50.4)
|
|
2005-06
|
5,94,487 (18.3)
|
4,99,020 (15.3)
|
4,11,393 (12.6)
|
17,48,173 (53.7)
|
|
2010-11
|
7,13,477 (14.5)
|
8,01,476 (16.2)
|
5,92,403 (12.0)
|
28,29,650 (57.3)
|
|
2011-12
|
7,39,495 (14.1)
|
8,23,023 (15.7)
|
6,19,475 (11.8)
|
30,61,589 (58.4)
|
Source: https://data.gov.in
Note: Figures in parentheses indicate percent share
While services have been booming, manufacturing has lagged. India's manufacturing is constrained by poor infrastructure, burdensome regulations, limited access to land and credit, and lack of workers skilled in high-end manufacturing. Moreover, labour market regulation in India is extremely complex, with state and central rules numbering almost 250. This results in an over-regulated labour market with large transaction costs, as suggested by Ghosh and Pal (2017).
Table 8: Sector-wise employment trends
|
|
Absolute number (million) Share in percent given in parentheses
|
|
|
1993-94
|
1999-00
|
2004-10
|
2009-10
|
2011-12
|
|
Agriculture
|
204.3 (61.1)
|
214.7 (58.5)
|
226.8 (54.5)
|
220.5 (51.6)
|
204.4 (47.1)
|
|
Industry
|
53.5 (16.0)
|
61.7 (16.8)
|
81.0 (19.5)
|
93.1 (21.8)
|
106.1 (24.4)
|
|
Services
|
76.6 (22.9)
|
90.6 (24.7)
|
108.0 (26.0)
|
113.7 (26.6)
|
123.9 (28.5)
|
Source: GoI 2015
Realising the importance of the manufacturing sector in spreading the benefits of economic growth to the poor, the government through its ‘Make in India’ initiative is seeking to increase manufacturing's share of GDP to 25 percent, and create 100 million new jobs within a decade, by simplifying regulations, improving infrastructure and providing other incentives. The primary objective is to attract investments from across the globe and strengthen India's manufacturing sector. Alongside a concerted push in the service sector is also envisioned. The focus of ‘Make in India’ is on 25 sectors - automobiles, aviation, chemicals, IT & BPM, pharmaceuticals, construction, defence manufacturing, electrical machinery, food processing, textiles and garments, ports, leather, media and entertainment, wellness, mining, tourism and hospitality, railways, automobile components, renewable energy, biotechnology, space, thermal power, roads and highways, and electronics systems.
Given these priority sectors, this study provides an overall assessment of past trends in employment and output growth in Indian manufacturing, including some of the sectors that are listed in the ‘Make in India’ initiative of the government.
Table 9: Employment and output growth in Indian manufacturing
|
Industry
|
1974-75- 1991-92
Period I
|
1992-93- 2001-02
Period II
|
2002-03-2012-13
Period III
|
|
|
Labour employed
|
VGO
|
Labour employed
|
VGO
|
Labour employed
|
VGO
|
|
Food products, beverages, tobacco & related products
|
1.96
|
5.61
|
0.38
|
5.13
|
1.65
|
8.12
|
|
Textiles
|
-0.81
|
3.38
|
-1.14
|
3.34
|
1.80
|
6.53
|
|
Wearing Apparels
|
5.13
|
9.11
|
5.21
|
2.60
|
10.65
|
9.83
|
|
Wood & wood products; furniture &fixtures
|
0.67
|
6.48
|
3.65
|
14.71
|
5.12
|
13.53
|
|
Paper and paper products, printing publications & allied industries
|
1.03
|
5.86
|
-0.80
|
4.84
|
3.17
|
5.88
|
|
Leather & leather products, fur & substitutes of leather
|
5.35
|
8.83
|
2.98
|
5.90
|
6.90
|
7.82
|
|
Basic chemicals & chemical products (except products of petroleum and coal)
|
3.60
|
7.43
|
2.03
|
6.05
|
4.44
|
8.00
|
|
Rubber, plastic, petroleum and coal products; processing of nuclear fuels
|
4.69
|
7.67
|
2.14
|
10.01
|
6.78
|
13.73
|
|
Non-metallic mineral products
|
2.85
|
9.39
|
0.26
|
4.22
|
4.08
|
11.13
|
|
Basic metal and alloy industries
|
2.05
|
7.89
|
-2.19
|
1.51
|
6.64
|
12.81
|
|
Metal products & parts,
except machinery and equipment
|
1.53
|
5.71
|
1.48
|
5.79
|
8.40
|
13.15
|
|
Transport equipment and parts
|
1.28
|
6.91
|
-2.04
|
7.04
|
9.20
|
12.65
|
Source: Authors' calculations
Table 9 offers an analysis of employment generated and value of gross output of each industry during the three different time periods. The compound annual growth rates (CAGR) presented in the table reflect the poor employment scenario in the manufacturing sector, particularly during the period 1992-93 to 2001-02. Most industries picked up in the later years (2002-03 to 2012-13) with employment growth rates above 5 percent, the exceptions being food products, beverages, tobacco and related products, textiles, paper and paper products, basic chemicals and non-metallic mineral products industries. However, output growth in these industries during the same period is way more than 5 percent. Output growth, in general, has been above 5 percent in most industries in all three periods, with period II being relatively poor for certain industries, especially basic metal and alloys (1.5 percent), apparel (2.6 percent), textiles (3.34 percent), and non-metallic mineral products (4.22 percent). Across periods, growth in output is impressive in wood and wood products (picking up from more than 6 percent), rubber, plastics, petroleum and coal products (growing from more than 7 percent), metal products and parts (up from more than 5 percent), and transport equipment and parts (above close to 7 percent).
Employment growth figures, unlike output figures, are comparatively low across industries; the CAGR in textiles during periods I and II is negative, while negative growth is also observed for basic metal and alloy industries and transport equipment industry in period II. The CAGR of employment in the leather, apparel and rubber industries was to the tune of 5 percent, highest among all industries between 1974-75 and 1991-92. Of these three industries, the apparel industry alone continued to maintain above 5 percent growth in employment in the next period 1992-93 to 2001-02, despite decline in output. Improvements in employment and output growth rates are observed in the last period, 2002-03 to 2012-13.
This analysis clearly indicates the growing disconnect between economic growth and employment generation in the manufacturing sector (Table 9). For instance, reviewing output and employment figures of 2002-03 to 2012-13, it is found that the wood and wood products industry shows a huge gap between output and employment generated. Other industries depicting a similar scenario are: non- metallic mineral products, food products, beverages, tobacco and related products, and textiles. So even if the value of gross output is healthy in this decade (CAGR of more than 5 percent), employment creation in the manufacturing sector needs immediate focus of the government. Based on the data and analysis of employment and output growth rates, it can be concluded that industries like textiles, food products, paper and paper products with output CAGR above 5 percent are losing out on job creation. Industries with likely potential for employment generation and output growth are: transport equipment and parts, metal products and parts, apparel, leather, rubber, plastics, petroleum and coal products, and basic metals and alloys. While this analysis presents an overall picture of Indian manufacturing over time, the data-set created will be important information for the “Make in India” policy. Of course a deeper study of the nuances of working of each industry will complement this bird's eye view of Indian manufacturing over the last four decades.
Apparently, given the low growth of manufacturing vis-à-vis services, the latter may have better scope of employment generation and higher TFP compared to the former.
CONCLUSION
This study examines the empirical evidence on the growth of productivity in the organised manufacturing sector of India, following a parametric approach. It uses a Cobb-Douglas production applied to industry level data from 1974-75 to 2012-13 to calculate productivity change in the Indian manufacturing sector. While often translog production function is preferred for measuring technical efficiency, C-D production is easier to handle to arrive at conclusions, given our hypotheses. This paper has not ventured into estimating technical efficiency, which can be taken up in the future. A summary of the important conclusions emerging from the analys is presented below.
The Indian manufacturing sector has grown at an average rate of 7.82 percent annually from 1975-76 to 2012-13. The increase was 6.51 percent during the period 1975-76 to 1991-92, 6.43 percent from 1992-
93 to 2001-04, and 11.11 percent from 2002-03 to 2012-13. Of all the industries considered in this study, rubber, plastic, petroleum and coal products account for the highest share of around 18 percent of the value of gross output of the manufacturing sector during the entire period 1974-75 to 2012-13, and close to 22 percent between 2002-03 and 2012-13. The other sub-period estimates point at food products, beverages, tobacco and related products contributing the highest to the value of gross output of the manufacturing sector, with contributions to the tune of 20.94 percent between 1974-75 and 1991-92, and 19.77 percent from 1992-93 to 2001-02.
The growth in the use of inputs like labour, capital, energy and material increased on an average by 4.6, 3.78, 6.98 and 8.11 percent per annum, respectively. Among these inputs, the increase in capital use was the lowest with figures ranging from 1.86 to 4.22 percent. Instead, the use of materials has been relatively more than other inputs. The use of inputs at the level of each industry shows that the basic metal and alloys industry accounted for the highest share of energy use (27.23 percent) and capital (24.09 percent) from 1974-75 to 2012-13. Labour use (14.45 percent) was the second highest in this industry, the highest being in the textiles industry, while material use was the highest (22.16 percent) in rubber, plastics, petroleum and coal products, followed by food products, beverages, tobacco and related products (19.23 percent) and basic metals and alloys (14.35 percent).
It is worth noting that capital intensities across the manufacturing sector have been around 2 percent over the years 1974-75 to 2012-13, while period-on-period change suggests that capital intensity has mostly declined in each industry barring textiles.
The overall TFP growth of the manufacturing sector has been very poor, of the order of 0.07 percent. However, period-wise productivity growth is mixed: a decline (of nearly 1 percent) in the first sub-period, followed by a rise (0.89 percent) in the second and a rise again (0.52 percent) in the third sub-period.
Industries that have witnessed productivity improvement, even if marginally, during the entire study period are: non-metallic mineral products, apparel, food products, beverages, tobacco, metal products, transport equipment, rubber, petroleum and coal products, basic chemicals and leather. Across industries, overall capital productivity growth ranged from an average of 1.46 percent textile ) annually to 8.17 percent (wood and wood products). The comparative figures for labour productivity are -0.43 percent (apparel) to 5.87 percent (wood and wood products), energy productivity from -1.39 percent (textiles) to 5.08 percent (wood and wood products industry), and materials productivity from an average -0.58 percent (paper) to 0.61 percent annually (leather).
From the 'Make in India' perspective, this study highlights the existing gap between economic growth and employment generation in the manufacturing sector in general. Specifically, industries like wood and wood products, non-metallic mineral products, food products, beverages, tobacco and related products, and textiles indicate the growing disconnect between output growth and employment generation. Among these, textiles and food products are categorically listed as priority sectors in the ‘Make in India’ initiative. Alongside, this study has also identified industries that appear to have potential for employment generation and output growth: transport equipment and parts, metal products and parts, apparel, leather, rubber, plastics, petroleum and coal products, and basic metals and alloys. Though the industries listed here are at the two-digit level, a disaggregated view of these will mostly cover the priority sectors, pertaining to manufacturing in the 'Make in India' policy.
In conclusion, India needs to grow its shrunken manufacturing sector to increase its share in GDP and create jobs. The results of this study highlight the poor growth of Indian manufacturing sector in the last four decades. The analysis should draw the attention of government, which has taken a series of steps such as 'Make in India' to create jobs in the manufacturing sector for inclusive growth in the country.
The contribution of the manufacturing sector to India's GDP has hovered around 15 percent, while services contributed nearly 72.4 percent of the growth. Availability of modern and facilitating infrastructure is a very important requirement for the growth of industry. The services sector being the major driver of country's economic growth is viewed as the 'sector of the current millennium', in terms of generating employment, skill development, bringing in foreign direct investment, enhancing trade and boosting strategic partnerships.
Given the potential of the services sector for generating inclusive and equitable economic growth, it would be interesting to study the correlation between the extent of liberalisation in India and the growth in the country's different services subsectors. Studies to follow will take up productivity analysis of services and the primary sectors so as to arrive at better indicative pictures of productivity growth, investment opportunities for ‘Make in India’, and potential for employment generation
The views expressed above belong to the author(s). ORF research and analyses now available on Telegram! Click here to access our curated content — blogs, longforms and interviews.

 PDF Download