Indian investments in Africa: Scale, trends, and policy recommendations
Indian investments in Africa, from both public and private sector entities, have increased considerably in the last decade. Yet despite the growing importance of Indian investments in Africa, only a few empirical studies have been carried out on the subject. This paper undertakes a disaggregated analysis of Indian foreign direct investment outflows to Africa from 2008 to 2016, and presents three main findings. First, it confirms earlier analyses that the bulk of Indian investments in Africa are directed to Mauritius, a tax haven. Second, energy security is the main pull factor behind public sector investment in Africa, and among the leading investors are Indian public sector oil and gas companies like ONGC Videsh, Gujarat State Petroleum Corporation, and Oil India Limited. Third, the Indian private sector has also invested in a range of non-energy sectors, including manufacturing. India’s private sector also has the potential to play an important role in India’s development cooperation efforts in Africa. This paper finds, however, that the correlation between India’s development cooperative initiatives and investments in Africa is currently weak. It recommends the establishment of an institutional vehicle to promote Indian investments in Africa.
Historically, the foundations of India’s relations with Africa were built upon movements against colonialism and racial discrimination. India also supported development initiatives in African countries under the banner of South-South Cooperation. But trade and investment relations between India and Africa were limited during the 1960s and ‘70s. Some large Indian companies did invest in East African countries even in the 1960s when domestic policies were highly restrictive in releasing the foreign exchange necessary for domestic companies to invest abroad. The Birla Group was the first Indian company to invest in Ethiopia in 1956. In 1969, the Birla Group also entered into a joint venture, Pan-Paper, with the Kenyan government and the World Bank. However, investments in that era were typically led by a handful of large Indian firms and were also considerably smaller in magnitude compared to contemporary flows. Most studies suggest that the domestic companies which ventured abroad during this period did so, to either defend the market for their export products or to avoid the anti-monopoly legislation’s restrictions on their domestic activities.[i]
Indian investments in Africa have increased remarkably in the last two decades. The reason behind the growth of Indian investments in Africa can be traced to a number of developments in both sides. First, as a capital-scarce country with limited foreign exchange resources, India was highly restrictive in releasing the foreign exchange necessary for Indian firms to invest abroad. With the economic reforms of the 1990s, the rules and procedures for outward investments were gradually liberalised. By 2003, the overall investment ceiling on outward Indian investment was abolished and Indian companies were practically free to invest abroad. Second, with higher growth rates, India’s energy requirements also increased dramatically. As a result, energy security concerns took centre stage of India’s foreign policy discourse. Diversification of energy suppliers and investment in oil and gas ventures abroad became important objectives of India’s foreign policy.[ii]To facilitate the acquisition of energy assets abroad, Oil and Natural Gas Corporation-Videsh Limited (OVL) was established in 1996.
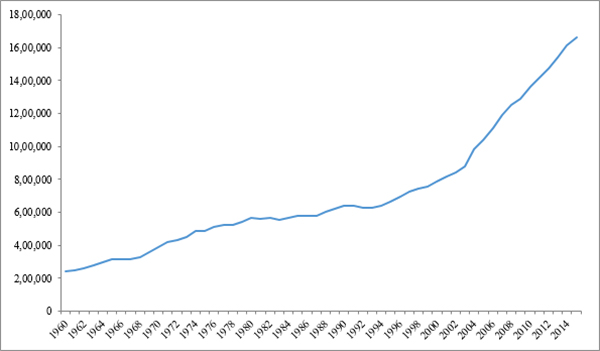
Significant changes took place within Africa as well. Once described as a ‘hopeless continent’, Africa entered a phase of high growth in the 2000s. Sub-Saharan Africa’s gross domestic product (GDP) in constant 2010 prices grew at six percent per annum from 2000 to 2010 as compared to two percent and one percent, respectively, in the two previous decades (Figure 1). Several African countries such as Ethiopia, Kenya, Rwanda, Democratic Republic of Congo, and Angola experienced an economic turnaround in the 2000s. The African continent emerged as an attractive investment destination on account of the high rate of growth experienced by many countries, the growth of a middle-class, as well as resource abundance, particularly energy resources. In 2016, Africa received FDI inflows worth US$ 54.1 billion.[iii]Its importance in the world energy market grew as instability in the Gulf region prompted many countries to turn towards Africa. Moreover, technological advances made it easier to extract Africa’s offshore oil reserves, and because African crude is lighter, sweeter, and lower in sulphur content, it was cheaper to refine than crude from the middle-east.[iv]
Figure 1: Sub-Saharan Africa’s GDP (in constant 2010 US$ million) from 1960 to 2015
According to theWorld Investment Report 2016, India was the eighth largest investor in Africa in 2014.[v]Both Indian public and private sector companies have made significant inroads in Africa. For instance, the Oil and Natural Gas Corporation’s overseas division, ONGC Videsh (OVL), is one of the most active Indian companies in Africa. On the other hand, private corporations like Reliance, Varun Beverages, Bharti Airtel, Essar Group, and the TATA Group have also made huge investments in many African countries. In addition, there are a multitude of small and medium Indian enterprises operating in Africa.
Public bus by Indian group Tata in Dakar | Source: Flickr userBobbiLe Ndiaye
The remarkable growth of Indian investments in Africa has caught widespread attention. It is quite common to come across news headlines such as ‘Africa is the next big frontier for Indian companies’, ‘A marriage made in heaven? Indian companies in Africa’, and ‘India’s investment in Africa: Feeding up an ambitious elephant’. But the subject of Indian investments in Africa has not been accorded enough scholarly scrutiny. There are only a few empirical studies on the subject, and these, at best, provide an overview. Some of these studies focus only on Indian investments in the energy sector. CII/WTO (2013) was one of the earliest studies on India-Africa trade and investment relations but it is outdated as it mainly relies on Indian overseas investment data from the Ministry of Finance up to 2008-09 although it lists ‘big ticket’ Indian investments up to 2012.[vi]Prahalathan et al (2014), on the other hand, provide a comprehensive analysis of Indian overseas direct investment to all regions and sectors.[vii]Meanwhile, Sinate et al (2013) provide a detailed account of Indian investments in West African countries,[viii]Alden and Verma (2015) focus on Indian investments in Africa’s resource and infrastructure sector,[ix]and Lucey et al (2015) underscore the importance of the private sector in furthering India-Africa relations using investment figures for only up to 2008-09.[x]
There are wide variations in the reported investment figures in many of these studies. For instance, the total value of Indian investments in Africa is unclear from the literature, with the International Monetary Fund (IMF) putting the total stock value at US$ 14.1 billion in 2011 and others at over US$ 35 billion.[xi]Thus, an up-to-date disaggregated study of Indian investments in Africa across all sectors is missing. The objective of this study is to fill this critical research gap by analysing firm-level data on Indian overseas investments to African countries across all sectors. Section II of the paper studies the relationship between Indian investments and India’s development cooperation initiatives in Africa and highlights the need for better coordination between India’s commercial interests and its development cooperation. Section III concludes. Appendix A and B give details of Indian FDI flows to major African countries.
I. Indian investments in Africa: Key Stylised Facts
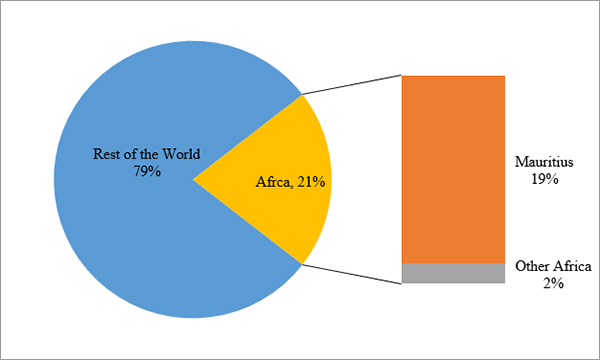
Figure 2: Share of Africa in total Indian FDI flows (2008-2016)
Source: Author’s estimates based on RBI data on Indian ODI
Mauritius: the Most Favoured Destination for Indian investments
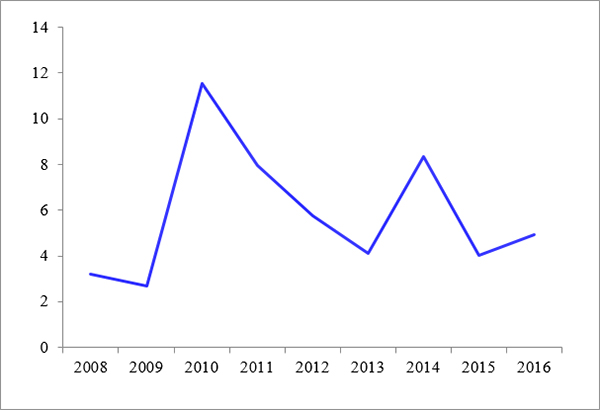
The total Indian foreign direct investment (FDI) outflows from India to the world from 2008 to 2016 are estimated at US$ 250.9 billion. Receiving investments of US$ 52.6 billion, the African continent accounts for about 21 percent of the total Indian investment outflows during that period (Figure 2). Indian FDI outflows to Africa grew from US$ 3.2 billion in 2008 to US$ 4.9 billion in 2016 (Figure 3). As is clear from the figure, there are two peaks in the graph—in 2010 and 2014. There was a fivefold increase in FDI outflows to Mauritius from US$ 2.7 billion in 2009 to US$ 11.6 billion in 2010. The peak in 2014 is due to OVL’s investment in Mozambique’s oil and gas sector (which will be discussed further in latter sections of this paper).
India’s FDI flows to Africa are concentrated in Mauritius, which accounts for about 19 percent of Indian FDI flows to the world (Figure 2). From 2008 to 2016, Indian FDI outflows to Mauritius totalled US$ 47.6 billion. Only US$ 5 billion went to the rest of Africa which represents only two percent of global Indian FDI and 9.6 percent of Indian FDI flows to Africa. A large share of Indian FDI to Mauritius is ‘round-tripped’ back to India due to its tax haven status facilitated by the double taxation avoidance agreement with India. Therefore, for an accurate picture of Indian investments in Africa, Mauritius has been excluded from the analysis in the rest of the paper.
Figure 3:Indian FDI outflows to Africa, 2008 to 2016 (in US$ billion)
Source: Author’s estimates from Reserve Bank of India Database
Dominance of a few large Indian firms in Africa
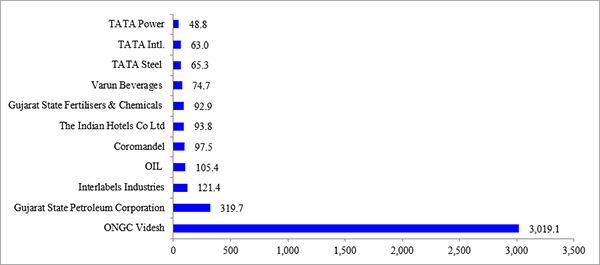
Although 597 Indian companies invested in Africa over 2008-2016, totalling US$ 5 billion, the top 11 companies account for about 80 percent of the total Indian investment flows to Africa. Indian outward investment to Africa is thus heavily concentrated within a few large firms. OVL occupies the top spot with investments worth US$ 3,019.1 million (59.8 percent) followed by Gujarat State Petroleum Corporation (6.3 percent), Interlabels Industries (2.4 percent), Oil India Limited (2.1 percent), and Coromandel (1.9 percent)—at US$ 319.7 million, US$ 121.4 million, US$ 105.4 million, and US$ 97.5 million, respectively (Figure 4). It is noteworthy that these figures exclude the investments of Indian companies in Mauritius. Further, it is interesting that these large Indian firms have not expanded across the continent and their investments are concentrated in a few countries. Table 1 shows that with the exception of OVL which has investments in six African countries—Congo, Egypt, Ivory Coast, Libya, Mozambique, and Sudan—all the major Indian companies have established their presence in only one or two African countries. This confirms Prahalathan’s assertion that overseas investment activities of Indian companies are motivated essentially by a set of firm-specific objectives.[xii]
Figure 4: Major Indian investors in Africa from 2008 to 2016 (figures in US$ million)
Source: Author’s estimates from Reserve Bank of India Data
Note: Figures for Indian investment in Mauritius not included here
Table 1: Geographical spread of major Indian companies in Africa
Company Name
African countries where it has presence
ONGC Videsh
Congo, Egypt, Ivory Coast, Libya, Mozambique and Sudan
Gujarat State Petroleum Corporation
Egypt
Interlabels Industries
Kenya
Oil India Limited
Gabon, Libya, Nigeria
Coromandel
Tunisia
Indian hotels Company
South Africa
Gujarat State Fertiliser Corporation
Tunisia
Varun Beverages
Morocco
Tata steel
South Africa
Tata International
South Africa
Tata Power
Zambia
High levels of geographic concentration of Indian investments in Africa
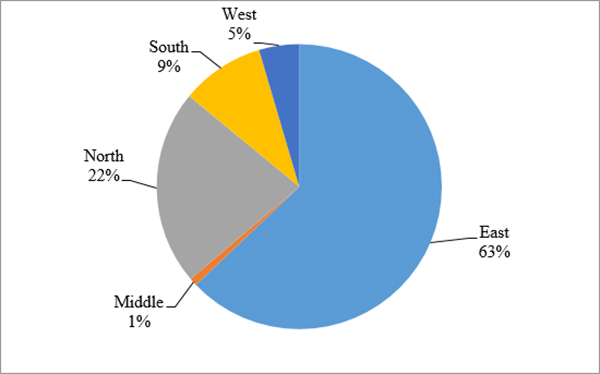
Figure 5: Geographical composition of Indian investment in Africa (2008-16)
Source: Author’s estimates from RBI Data
Note: The above figure does not include Mauritius
With a share of 63 percent and 22 percent, respectively, the East and North African regions attract most of the investments from India (Figure 5). The share of South and West Africa was nine percent and five percent, respectively. Middle African countries such as Central African Republic, Chad, Congo, and Gabon attracted little investment from India. Table 2 shows the top ten recipients from 2008 to 2016. Together, these countries account for over 90 percent of Indian outward investment flows to Africa. The following paragraphs provide a brief description of Indian investment flows in each of these countries.
Table 2: Top ten African destinations for Indian overseas direct investment (2008-16), in million US$
2008
2009
2010
2011
2012
2013
2014
2015
2016
Total
Share (%)
Main sectors in which India has invested
Mozambique
5.9
0.0
0.3
3.6
0.5
1.9
2,648.8
1.7
4.1
2,666.9
52.9
Oil and gas, coal
Egypt
423.8
7.5
13.5
24.0
62.7
40.8
14.4
9.3
6.8
602.9
12.0
Oil and gas, solar, pharmaceuticals
South Africa
29.0
84.7
29.5
23.6
137.0
18.9
27.6
63.9
28.3
442.5
8.8
Hotels, Steel, Information technology, and FMCG
Tunisia
108.2
82.3
190.4
3.8
Manufacturing
Kenya
124.4
0.8
0.6
1.3
5.9
4.6
6.2
1.7
9.0
154.6
3.1
Manufacturing
Zambia
0.1
0.6
0.9
2.0
4.1
6.7
13.6
88.1
29.4
145.3
2.9
Manufacturing
Libya
24.5
12.9
52.5
3.5
0.6
27.4
7.4
0.1
128.8
2.6
Oil and gas
Ethiopia
1.0
3.5
3.0
4.1
2.8
4.0
42.7
14.1
21.1
96.4
1.9
Manufacturing
Morocco
2.5
1.1
38.0
4.9
5.8
10.7
13.7
19.4
96.1
1.9
Manufacturing
Sudan
55.5
16.2
13.9
0.0
0.0
0.0
85.7
1.7
Oil and gas
Sub Total
666.6
127.4
114.2
100.1
218.3
218.3
2,853.8
192.7
118.1
4,609.5
–
–
All Africa*
731.5
198.7
165.7
145.6
259.3
266.8
2,828.7
224.1
220.1
5,040.5
–
–
Share (%)
91
64
69
69
84
82
98
86
91
91
–
–
Source:Author’s estimates from Reserve Bank of India’s Database
*Excluding Mauritius
Mozambique
As mentioned earlier, if Mauritius is disregarded, then Mozambique is the leading destination for Indian FDI in Africa with a share of about 52.9 percent. The total value of Indian FDI outflows to Mozambique from 2008 to 2016 was US$ 2.6 billion. But its top position is accounted for by one very large investment by Indian state-owned company, OVL, which represents nearly 99 percent of Indian FDI in Mozambique. In 2014, OVL purchased a 10-percent participating interest in Area 1 of the Rovuma gas field, which is estimated to hold about 70 trillion cubic feet of gas, for a price of US$ 2.6 billion. Area 1 is strategically located to supply LNG to the Indian market. A final investment decision on the Mozambique LNG project is expected between April and June 2018 and the project is likely to commence operations in 2022-23, after a four-year construction period.[xiii]Coal India Limited, an Indian public sector company, is another active Indian company in Mozambique. Most of the investments by Coal India in Mozambique are routed through Coal India Africana Limitada (CIAL), a wholly owned subsidiary of Coal India. Between 2008 and 2016, CIAL invested about US$ 5.1 million in Mozambique. Thus, almost all of Indian investment in Mozambique is concentrated in the energy sector. However, not all Indian investments in the energy sector have been equally successful. CIAL, for example, had to ultimately surrender its coal blocks after failing to find any commercially viable reserves in the blocks it was allocated in 2009.[xiv]Apart from OVL and CIAL, there are only about 26 other Indian companies which have invested in Mozambique. But the value of these investments is less than US$ 5 million each.
Egypt
With a share of 12 percent, Egypt is the second largest destination for Indian investments in Africa. Indian FDI outflows to Egypt from 2008 to 2016 were valued at US$ 602.9 million. Like Mozambique, most of the Indian investment in the country is concentrated in the energy sector. Gujarat State Petroleum Corporation (GSPC) and OVL are the two largest Indian companies in Egypt. The Gujarat government-supported company, GSPC, has invested about US$ 319.7 million in Egypt’s oil and gas sector. However, most of its investments in Egypt were not successful because the blocks were found to be commercially unviable and it surrendered five of its oil and gas blocks in Egypt.[xv]In 2008, OVL invested US$ 227.5 million in Egypt.
Indian investments in Egypt’s energy sector are not only limited to the oil and gas sector. Indian private sector company Shapoorji Pallonji Capital Company Ltd. invested US$ 6.8 million in a 50MW solar power plant in Egypt. There are other Indian companies which have invested small amounts in the manufacturing sector. For instance, Dhunseri Petrochem and Tea Ltd. has invested US$ 33.2 million in a downstream petrochemicals facility. Pharmaceuticals are another important sector for Indian private sector companies. Between 2008 and 2011, Glenmark Pharma invested about US$ 7.6 million in Egypt.
South Africa
About 119 Indian companies have invested US$ 442.5 million in the South African market between 2008 and 2016 which accounts for about 8.8 percent of Indian investments in Africa. Unlike Mozambique and Egypt, Indian investments in South Africa are neither led by state-owned enterprises nor concentrated in the energy sector alone. The TATA Group is one of the most active Indian companies in South Africa. TATA International and TATA Steel have invested US$ 63 million and US$ 65.3 million, respectively. The TATA Group’s hospitality arm, Indian Hotels, has invested a total of US$ 93.8 million in South Africa. Larsen and Toubro Infotech, the sixth largest Indian IT services player globally, invested US$ 36.5 million between 2008 and 2011. Marico Industries, a fast moving consumer goods (FMCG) company entered the South African market by acquiring South African brands like Caivil and Black Chic. Its total investment in South Africa between 2008 and 2011 were to the tune of US$ 34.3 million.
Tunisia
The total value of India’s FDI outflows to Tunisia between 2008 and 2016 is estimated at US$ 190.4 million (Table 2). The country accounts for about 3.8 percent of India’s total investments in Africa during the same period. Two Indian fertiliser companies, Coromandel International and Gujarat State Fertilizers and Chemicals (GSFC), account for over 99 percent of Indian investments in Tunisia. GSFC and Coromandel International formed a joint venture, Tunisian Indian Fertilizers (TIFERT), with Tunisian state-owned company, Groupe Chimique Tunisien (GCT) and Compagnie Des Phosphates De Gafsa (CPG). Together, Coromandel International and GSFC, have invested US$ 190.4 million in a phosphoric acid plant in order to secure an uninterrupted supply of phosphoric acid which is critical for their India operations. TIFERT’s plant which started its operations in 2013 will use around 1.4 million tonnes of Tunisian rock phosphate per year, producing 360,000 tonnes of phosphoric acid annually.[xvi]These investments have resulted in an uninterrupted supply of phosphoric acid to India which is key to the production of phosphates, an essential agricultural input in India. India currently accounts for over 50 percent of Tunisia’s global phosphoric acid exports.[xvii]
Kenya
Total investment by Indian companies in Kenya (the earliest home to Indian investments) from 2008 to 2016 is estimated at US$ 154.6 million and the country accounts for about 3.1 percent of Indian investments to Africa during the same period (Table 2). Indian private sector company Interlabels Industries, which manufactures self-adhesive labels and labelling solutions, is the largest investor in Kenya with a share of 79 percent in total Indian investments in Kenya. It is interesting to note that between 2008 and 2016 about 82 Indian companies invested in Kenya, and out of those, 80 companies invested less than US$ 10 million. Also, most of these investments were directed to the manufacturing sector. This can be explained largely by the fact that Kenyans of Indian origin are an important segment in Kenya and act as a strong pull factor for Indian investments to the country.
Zambia
Between 2008 and 2017, Indian companies invested a total of US$ 145.3 million in Zambia (Table 2). Although there are a few studies that have focused on Indian investments in Zambia’s agriculture sector, this study finds that Indian private sector’s presence in sectors such as manufacturing, construction, and finance, insurance and banking is much more important. Together, the top five Indian companies in Zambia—TATA Power (33.6%), Varun Beverages (18.7%), PLR Projects (8.6%), Chetak Enterprises (6.3%), and Manjeet Cotton Private Limited (5.6%)—account for about 73 percent of Indian investment in Zambia.
TATA Power owns 50 percent shares in the joint venture Itezhi Tezhi Power Corporation, with Zambian utility ZESCO. The 120 MW Itezhi Tezhi power plant, which is being built under the Build-Own-Operate-Transfer model, is expected to play a key role in addressing Zambia’s massive power shortage. Varun Beverages, the second largest bottler of PepsiCo. Beverages, invested US$ 27.2 million through its wholly owned subsidiary, Varun Beverages Zambia Limited. PLR Projects is another prominent Indian private sector company which has invested about US$ 12.5 million in Zambia’s construction sector. Another prominent player in the construction sector is Chetak Enterprises which has invested about US$ 9.2 million. Indian public sector banks have played an important role in Zambia’s banking sector. In 2015, three Indian public sector banks invested in Zambia—these were Bank of Baroda, Bank of India, and Central Bank of India.
Libya
Indian investment in Libya is entirely directed to the energy sector. Three Indian public sector enterprises–Oil India, ONGC Videsh, and Indian Oil Corporation—have invested US$ US$ 65.9 million, US$ 51.4 million, and US$ 10.3 million in Libya, respectively, and together account for about 99 percent of Indian investments in Libya.
Ethiopia
Between 2008 and 2016, about 64 Indian companies invested a total of US$ 96.4 million in Ethiopia. Unlike in other countries like Mozambique, Zambia, and Libya, about 92 percent of the Indian investment in Ethiopia is channelled to the manufacturing sector. Kanoria Africa Textiles, a wholly owned subsidiary of Kanoria Chemicals and Industries, has set up a denim unit near Addis Ababa with an investment of about US$ 36.1 million. Both India and Ethiopia have a lot to gain from this unit: The project will create about 500 direct jobs and 20,000 indirect jobs as well as further the mission of ‘Made in Africa’;[xviii]at the same time, the Indian company will get duty-free quota-free access to the US and EU markets through the African Growth and Opportunity Act (AGOA) and Everything But Arms (EBA).
Food processing companies such as Indagro Foods and Frigerio Conserva Allana Limited have also invested heavily in Ethiopia. The Allana Group, India’s largest exporter of buffalo meat, has built a meat processing plant in Zeway town near Addis Ababa. The meat plant will have a capacity to produce 75 tonnes of meat every day.[xix]
Morocco
Eight Indian companies have invested about US$ 96.1 million in Morocco (Table 2). Unlike in countries such as Ethiopia, Kenya, and South Africa, only eight Indian companies have invested in Morocco. Two Indian private companies, Varun Beverages (78%) and TATA Motors (15%), account for about 92 percent of Indian investments there, with the six other companies having invested less than US$ 3 million each.
Sudan
Indian investment flows to Sudan from 2008 to 2016 are estimated to be about US$ 85.7 million (Table 2). In Sudan, Indian investment is strictly limited to oil, with ONGC Videsh accounting for 99 percent of Indian investments (Table A10). The other six Indian companies present in Sudan are Bhola Shri Marketing Private Limited, BLS International Services Limited, RAMCO Systems, Shivalikview Steel Trading, Titanic Steel Trading, and Vintage Steel. These have invested less than half a million each.
II. Role of private sector in India’s development cooperation
The notion that the private sector could play an important role in development cooperation gained currency after the global financial crisis and the consequent decline in government budgets for official development assistance (ODA). The Fourth High Level Forum (HLF4) on Aid Effectiveness held in Busan in 2011 established the role of the private sector as an ‘actor and development partner’. One of the main proposals of the Busan Partnership was to build “stronger relationships between development cooperation and the private sector, by supporting the creation of a favourable environment for the different partners and fostering public-private partnerships”.[xx]This was also the first time when representatives of the private sector were signatories to the agreement. Subsequently, the role of the private sector was emphasised in the Rio+20 Conference, the Global Partnership for Effective Development Cooperation, and the G20 summits. The private sector is regarded crucial to overcoming development challenges in the developing world because it is an engine for economic growth. Given the private sector’s role in advancing innovation, transfer of technology, creating wealth, incomes, and jobs; the impacts of development cooperation will be more sustainable if development cooperation builds on synergies with the priorities of the private sector.
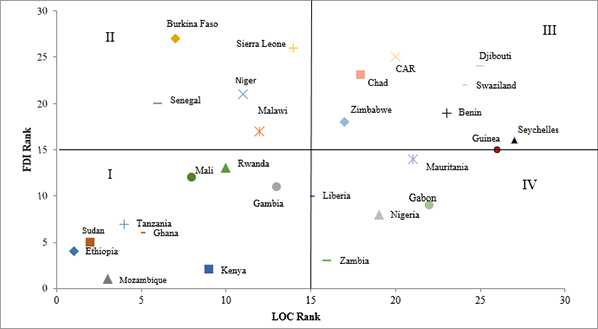
In order to determine whether India’s development cooperation is linked to India’s commercial interests, African countries have been ranked according to the total value of credit lines and the total FDI outflows from 2008 to 2016 in Figure 6. The figure suggests that there is a weak positive association between the total concessional credit received by a country and the FDI in that country. The spearman rank correlation[xxi]between Indian lines of credit and FDI flows is only 0.44. Countries in the first quadrant such as Mozambique, Kenya, Ethiopia, Tanzania, and Ghana are countries which have been the favoured destination for both Indian investments as well as credit lines. Countries in the third quadrant such as Djibouti, Swaziland, and Benin have not been major beneficiaries of either lines of credit or investments from India. Countries in the second and fourth quadrant represent a disassociation between development cooperation and FDI flows. Countries in the second quadrant such as Burkina Faso and Senegal have been major beneficiaries of Indian lines of credit but these countries have received scant FDI flows. This signifies the failure of Indian credit lines in stimulating private sector investments in these countries. On the other hand, countries such as Zambia, Nigeria, and Gabon have received high volumes of FDI but have not been major beneficiaries of Indian lines of credit. In this case, investments have not followed development cooperation. Private sector companies have found it profitable to invest in these countries. Zambia’s case is particularly interesting because as observed earlier, not only has it been the fifth largest recipient of Indian investments, Indian investment have also spread across various sectors of the economy. This is largely due to the Zambian government’s efforts in attracting Indian investments.[xxii]
Figure 6: Ranking of African countries based on total concessional credit and FDI received
Source: Author’s own based on data from EXIM Bank and RBI database
According to a report by CII,[xxiii]there are two ways in which development cooperation relates to the private sector:
Development cooperation can target private sector development in the partner country to foster economic growth, which then can translate into broader development gains.
Private sector can be engaged in various stages associated with the delivery of development cooperation
At the moment, however, the role of Indian businesses in the delivery of development cooperation is limited to that of a contractor. Indian lines of credit are the main instrument through which Indian companies participate in the implementation of development cooperation. Once a line of credit agreement is signed, the borrowing government or agency organises a bidding and procurement procedure, in which Indian firms can participate.[xxiv]India does not provide financial incentives for firms to invest in Africa or establish business relationships with African firms. Joint financing of projects through public-private partnerships is also rare.
Sweden’s development cooperation is in striking contrast to India. There was a seven-fold increase in Sweden’s aid to the private sector from € 5.5 million in 2006 to € 38 million in 2012.[xxv]Swedfund, the development finance institution of Sweden, funds small and medium-size Swedish businesses to start up business relations in developing countries. Between 2009 and 2016, Swedfund financed 196 new establishments and business collaborations.[xxvi]UK’s development finance institution, CDC, supports businesses in Africa and South Asia to create jobs and expand small businesses in these countries. China’s development cooperation also represents a close collaboration between the government, financial institutions, and state enterprises.[xxvii]However, its private firms have followed their own paths in Africa with the primary driving factor being African market opportunities.[xxviii]
Need for an institutional mechanism/vehicle to promote Indian overseas investments
India needs to synergise its development cooperation initiatives in order to create positive externalities for Indian companies in Africa. Better targeting of development projects in sectors and countries which are of interest for Indian businesses will foster trade and investment linkages between India and Africa. This is particularly important for countries in the fourth quadrant (see Figure 6). On the other hand, it is also important to investigate why credit lines are failing to be the stepping stones to more vigorous investment ties for countries in the second quadrant. Towards that end, it is imperative that India creates an institutional mechanism to promote Indian overseas investments in other developing countries. Prahalathan (2014) recommends the creation of a separate division within the Ministry of Finance – Overseas Investment Promotion Council (OPIC) to promote overseas investments by Indian enterprises.[xxix]The CII report recommends the creation of an institutional mechanism, India-Africa Development Cooperation, under the aegis of the India-Africa Summits, wherein the private sector can provide its inputs on the geographical and sectoral focus of development cooperation.[xxx]
However, it is important that the institutional vehicle which seeks to promote Indian overseas investments in Africa and other developing countries bears in mind the development priorities of the recipient countries as well because there may be instances where the interests of India’s private sector may not be in line with the larger development goals of poverty alleviation and sustainable development. Moreover, the expansion of private sector in Africa does not automatically benefit the poorest and marginalised people, particularly in Africa.[xxxi]Therefore, private sector engagement in India’s development cooperation should aim to result in mutual benefit for both India as well as its partner countries. Towards that end, the institutional vehicle to promote Indian overseas investments must try to promote development-friendly investments in Africa.
Conclusion
One of the main findings of this study is that Mauritius continues to account for the bulk of Indian investments in Africa. Given that it is a tax haven, most of the Indian investment to that country does not contribute to African development and is round-tripped back to India. This means that the actual volume of Indian investment in Africa is much less than reported by both existing academic studies and the media.
This study also finds that Indian investment in Africa is characterised by large-scale investment in oil, gas, and mining sectors by public sector enterprises. Thus, energy security is the critical pull factor behind the growth of Indian investments in Africa. However, Indian public sector companies have not fared very well in Africa’s energy market. In many instances they have had to relinquish the blocks they acquired due to poor commercial prospects, inability to meet contractual agreements or because the blocks were still in their exploratory phase.[xxxii]According to Alden and Verma (2015), lack of technical and operational skills led to the failure of Indian companies in Africa’s energy market. Between 2011 and 2015, GSPC surrendered ten of its 11 overseas blocks in Egypt, Yemen, Indonesia, and Australia. The Audit Report (PSUs) for the year ended 31 March 2015 made the following observation about GSPC:
“The Company went ahead acquiring overseas blocks during 2006-10 mainly as an operator with considerably high participating interests without any prior experience overseas as an operator. Further, the delayed execution of the work committed resulted in cost escalations in overseas blocks. As a result, the Company had incurred expenditure of Rs 1,757.46 crore for 10 surrendered overseas blocks, of which Rs 1,734.12 crore has been written off”.
Lastly, the Indian private sector’s footprint has also grown in the African continent, albeit not as much as often claimed by the media. Indian private sector investment in Africa can be divided into two categories. On the one hand are large private sector companies which have undertaken ‘big ticket’ investments in select African countries in the manufacturing sector, petrochemicals, fast moving consumer goods, and hotels. But their operations are limited to one or two African countries and have not been able to spread their presence across the continent. The driving force behind such investments is largely a set of firm-specific reasons such as market entry strategy or access to raw materials. On the other hand, there is also a multitude of small and medium enterprises which have invested much smaller sums in the manufacturing sector. These smaller firms are likely to have a stronger impact on African development by way of jobs as well as forward and backward linkages. However, making a decisive comment on the actual impact of such investments on a country’s development requires field-based research which is beyond the scope of this paper.
The relationship between India’s development cooperation and Indian FDI in Africa is weak at the moment. India’s development cooperation strategy should be more in tune with India’s commercial interests in Africa. Towards that end, this paper recommends the establishment of an institutional vehicle to promote Indian overseas investments in Africa as well as other developing countries in the neighbourhood. The institutional vehicle to promote Indian investments must also try to channel Indian investments into development-friendly projects for mutual benefit.
Appendix A: Details of Indian FDI outflows to top ten recipient countries
Table A1: Indian foreign direct investment flows to Mozambique from 2008 to 2016
Indian Party
2008
2009
2010
2011
2012
2013
2014
2015
2016
Total
Adhunik Alloys and Power Ltd.
0.04
0.04
Anil V Patel
0.045
0.045
Austral coke & projects ltd
0.032
0.013
0.045
Beekay universal impex pvt ltd
1
1
2
Bhavik parsottamdas patel
0.039
0.039
Coal india limited
0.2681
2.72
2
0.146
5.1341
Essar ports ltd
4.115
4.115
Gravita india ltd
0.22
0.0092
0.2292
Hemantbhai satishbhai patel
0.039
0.039
Jindal metal and mining limited
0.297
0.297
Jindal poly films ltd
0.225
0.225
Kwality pharmaceuticals pvt. Ltd.
0.108
0.108
Ongc videsh ltd.
2640
2.5475
2642.5475
Psi hydraulics
0.053
0.2525
0.02
0.3255
Rachana global excavation ltd
0.0051
0.0051
Railtech infraventure pvt. Ltd.
0.01
0.191
0.201
Rajarambapu agro private limited
0.1744
0.1744
Resources international
0.1884
0.7045
1.5
0.723
0.51
3.6259
Rites ltd
3.945
0.8282
4.7732
Rst mining and logistics private limited
0.0015
0.0015
Shapoorji pallonji energy (gujrat) private limited
0.0024
0.0024
Shapoorji pallonji infrastructure capital company limited
0.0024
0.0024
Standardbuild infrastructure ltd
0.025
0.025
Tata chemicals ltd
0.275
0.275
Teleminex india pvt ltd
0.025
0.025
Thriveni earth movers p ltd
1.379
1.379
Vandana vidhyut limited
0.3
0.3
Varun beverages limited
0.002
0.9
0.902
Total
5.889
0.013
0.3074
3.595
0.4774
1.9155
2648.846
1.704
4.1319
2666.8792
Table A2: Indian foreign direct investment flows to Egypt from 2008 to 2016
2008
2009
2010
2011
2012
2013
2014
2015
2016
Total
Aliasger k khorakiwala
0.0
0.0
Dhunseri petrochem & tea limited
11.7
10.1
4.3
7.0
33.2
Ebrahim z khorakiwala
0.0
0.0
Glenmark pharmaceuticals ltd.
0.4
0.6
1.3
0.7
1.4
4.5
Glenmark pharmaceuticals pvt. Ltd.
0.1
0.7
0.5
1.0
0.9
3.2
Gujarat state petroleum corporation
195.5
6.8
8.3
10.5
50.7
35.0
13.1
0.0
319.7
Hdfc investments ltd
0.6
0.6
Hetero drugs ltd
0.4
0.0
0.5
Hetero labs ltd
0.4
0.6
1.0
Kiran global chems ltd
0.4
0.1
0.5
Kumail h.khorakiwala
0.0
0.0
Murtaza q khorakiwala
0.0
0.0
Ongc videsh ltd.
227.5
227.5
Onmobile global ltd
0.0
0.0
Pidilite industries ltd
0.8
0.0
0.0
0.8
Qusai z khorakiwala
0.0
0.0
Rajesh nandkumar bathija
0.0
0.0
Roha dyechem pvt. Ltd.
0.1
0.1
Satyam computer services ltd.
0.8
0.6
1.4
Shapoorji pallonji infrastructure capital company limited
1.5
1.5
Shapoorji pallonji infrastructure capital company pvt. Ltd.
5.3
5.3
South asian petrochem limited
2.9
2.9
Sunil vasudeo kulkarni jt-1
0.0
0.0
Suresh dhawan jt1
0.0
0.0
Zoher h khorakiwala
0.0
0.0
Grand Total
423.8
7.5
13.5
24.0
62.7
40.8
14.4
9.3
6.8
602.9
Table A3: Indian foreign direct investment flows to South Africa from 2008 to 2016
2008
2009
2010
2011
2012
2013
2014
2015
2016
Total
Agni steels private limited
0.6
0.6
Alkem laboratories limited
1.0
1.0
Alkem laboratories ltd.,
0.0
0.0
0.0
Allengers medical systems limited
0.1
0.1
0.1
0.5
0.7
Alp overseas pvt ltd
0.0
0.0
0.7
1.1
1.8
Altura consulting pvt. Ltd.
0.0
0.0
Arva a challawala
0.0
0.0
Aspl ventures private limited
1.6
1.6
Bennett coleman and co. Ltd.
0.0
0.0
Bhavna tradelink p ltd
0.4
0.4
Brk commodity india limited
0.0
0.0
Chadha power
0.6
0.4
1.0
Chadha power llp
0.0
0.0
Cipla ltd.
10.0
10.0
Citron infraprojects ltd
0.1
0.1
0.2
Corpus software pvt.ltd
0.0
0.1
0.1
Cri pumps pvt. Ltd.,
1.5
1.5
Crystal crop protection pvt ltd
0.0
0.0
Cytespace research private limited
0.2
0.2
Dash petroleum & energy resources pvt ltd
0.2
0.2
Dr. Reddy’s laboratories ltd.
10.3
10.3
Eduspark international private limited
0.3
0.3
Emcure pharmaceuticals ltd
0.0
0.0
0.0
0.1
Enercon (India) power development private limited
0.1
0.1
0.1
Enercon [i] ltd
0.1
0.1
0.1
0.3
Essel media
1.0
1.0
Euro safety footwear india pvt ltd.
0.4
0.1
0.5
Expert global solutions pvt.ltd.
0.0
0.0
Financial technologies[i] ltd]
1.5
0.1
1.6
Forace polymers private limited
0.0
0.0
0.0
Fortune metaliks limited
0.4
0.1
0.5
Fortune metals limited
0.1
0.0
0.1
General insurance corporation
10.0
11.9
21.9
Genesis mining & minerals pvt ltd
0.6
0.6
Geospatial media and communications private limited
0.0
0.0
Gis development[p] ltd
0.0
0.0
Goodearth agrochem p ltd
1.7
1.7
Gpt infraprojects ltd
0.4
0.4
Gupta coal india ltd
1.5
1.5
I 2 i telesource pvt ltd
0.0
0.0
Icreate software india p ltd
0.0
0.0
Il&fs energy development company limited
0.1
0.1
Indiabulls technology solutions limited
0.0
0.0
Indian technomac company limited
0.0
0.0
Industrial filters and fabrics private limited
0.2
0.2
0.4
Ingen infotech corp private limited
0.0
0.0
Intas pharmaceuticals ltd
0.4
0.4
0.5
1.6
2.1
0.4
2.0
2.1
2.8
12.1
Integrated wireless solutions pvt ltd
0.0
0.3
0.2
0.4
Interglobe air transport limited
0.0
0.0
Ion exchange india ltd.
0.1
0.0
0.1
Ipca laboratories limited
0.1
0.1
John mayne
0.0
0.0
Jyoti structures ltd
0.0
2.3
0.5
2.8
Kalpataru power transmission ltd
0.1
0.1
Kiran global chems ltd
0.9
0.0
2.7
2.3
1.7
2.0
9.6
Klt automative and tubular products ltd
0.4
0.5
0.9
Krish compusoft services private limited
0.0
0.0
Larsen & toubro infotech limited
31.4
0.0
5.0
36.5
Legacy enterprises pvt. Ltd.
0.0
0.0
M/s cahead info technologies india pvt.ltd.
0.3
0.3
Macleods pharmaceuticals ltd
0.0
0.0
0.3
0.3
Mahendra brothers exports pvt ltd
0.0
0.0
0.0
Mahindra & mahindra ltd
2.1
2.1
Marico industries limited
15.0
12.5
0.5
6.4
34.3
Mbd worldwide pvt ltd
0.0
0.2
0.1
0.2
0.5
Mcnally bharat engineering co. Ltd.
0.0
0.1
0.0
0.1
Meril life sciences private limited
1.8
1.8
Metropolis health services (i) p ltd
0.7
0.1
0.9
Mouri tech pvt ltd.
0.0
0.0
Mphatek systems private ltd.
0.0
0.0
Multigraph machinery co.
0.0
0.0
Nmdc ltd
0.0
0.0
Nucleus software exports ltd
0.1
0.1
Numeric power systems ltd.
0.2
0.2
Onmobile global ltd
0.0
0.0
Orchid chemicals & pharmacueticals ltd.
0.0
0.0
Pankaj b koshti
0.1
0.1
Parle biscuits pvt ltd
2.6
2.6
Pierian services private limited
0.0
0.0
Praj industries ltd.
0.0
0.7
3.7
0.4
4.8
Precision bearing pvt. Ltd
0.1
0.1
0.1
Pride overseas private limited
0.0
0.0
Prodapt solutions private limited
0.0
0.0
R n laboratories private limited
0.0
0.0
Ramco systems ltd.
0.1
0.3
0.4
0.1
1.0
0.1
2.1
Rockland steel trading (p) ltd.
14.6
14.6
Sankhyaa learning private limited
0.0
0.0
0.0
Saumya textiles private limited
1.5
0.2
0.2
1.8
Seagull maritime agencies private limited
0.0
0.0
Second avenue consulting pvt ltd
0.0
0.0
Shalimar precision enterprises pvt ltd
0.0
0.0
Shankar packaging ltd
0.3
0.3
Silwin
0.0
0.0
Solid tech india computer services private limited
0.0
0.0
Span diagnostics ltd
0.0
0.0
0.0
Srg mining international private limited
0.1
0.1
Sun minerals
1.0
1.0
Tagros chemicals india ltd
0.8
0.2
0.1
1.0
Tata communications limited
0.5
0.3
4.3
5.1
Tata consultancy services ltd.
10.4
10.4
Tata intl. Ltd.
8.0
55.0
63.0
Tata motors ltd.
0.0
1.5
1.8
3.3
Tata projects ltd
0.0
0.0
Tata steel ltd
65.3
65.3
Tech mahindra ltd
0.5
0.5
The indian hotels co ltd
5.2
0.1
45.1
2.3
41.1
93.8
Ubora technologies private limited
0.0
0.0
Ve commercial vehicles limited
0.5
0.5
Vijay mining and infra corp private limited
3.4
0.0
3.4
Vulcan indl engg co ltd
0.1
0.1
0.2
Winjit technologies pvt ltd
0.0
0.0
Wone management systems private limited
0.0
0.0
Worlds window urja pvt ltd
4.4
4.4
Zensar technologies ltd
0.1
0.1
Total
29.0
84.7
29.5
23.6
137.0
18.9
27.6
63.9
28.3
442.5
Table A4: Indian foreign direct investment flows to Tunisia from 2008 to 2016
2013
2016
Total
Coromandel fertilizers ltd
56.4
56.4
Coromandel international limited
41.1
41.1
Gujarat state fertilisers & chemicals ltd
51.8
41.1
92.9
Kamal kishor swami
0.0
0.0
Raghav swami
0.0
0.0
Swapnil swami
0.0
0.0
Grand Total
108.2
82.3
190.4
Table A5: Indian foreign direct investment flows to Kenya from 2008 to 2016
2008
2009
2010
2011
2012
2013
2014
2015
2016
Total
Abakas advisors and investments
0.0
0.0
Adcc infocad private limited
0.3
0.1
0.4
Adcc infocad limited
0.1
0.1
Alkem laboratories ltd.,
0.0
0.0
Altura consulting pvt. Ltd.
0.0
0.0
Analytic solutions
0.0
0.0
Angira distributors private limited
1.2
1.2
Arrow webtex ltd
3.8
3.8
Ashish bhargava
0.0
0.0
Ashish vyas
0.1
0.1
Associated aluminium products pvt ltd
0.0
0.0
Astral poly trchnik ltd
0.0
0.1
0.3
0.0
1.4
0.3
0.4
0.6
3.1
Bharat arora
0.0
0.0
Bhola shri marketing private limited
0.0
0.0
Bliss gvs pharma limited
0.4
0.4
Bonsai network india p ltd
0.0
0.0
0.1
Capricorn logistics pvt ltd
0.0
0.0
Deval kanaiyalal modi
0.1
0.0
0.1
Devyani food industries limited
0.1
5.0
2.5
7.6
Doux dentistry pvt ltd.
0.0
0.0
Eastern software systems pvt. Ltd
0.1
0.1
Enovateur technologies
0.0
0.0
General insurance corporation
0.1
0.1
Gi tech gaming co india private limited
0.0
0.0
Glenmark pharmaceuticals ltd.
2.0
0.1
0.0
2.1
Gogreen power pvt ltd
0.1
0.1
Gujarat telelink private limited
0.1
0.1
Healthcare global enterprises limited
0.1
0.1
Hind aluminium industries limited
1.1
1.1
Infrastructure professional enterprise (p) ltd
0.1
0.1
0.2
Innovis telecom services pvt ltd
0.0
0.2
0.2
Interlabels industries pvt. Ltd.
120.2
0.1
1.1
121.4
Ipe global limited
0.1
0.2
0.3
K.g.n. Biofuels private limited
0.0
0.0
Karan ventures pvt limited
0.1
0.1
Lcl logistix india pvt ltd
0.1
0.2
0.2
Mahashakti energy limited
0.2
0.2
Manipal press ltd
0.3
0.5
0.8
Manipal technologies limited
0.2
2.2
2.4
Melimu edutech private limited
0.0
0.1
0.1
Mercury industries ltd
0.1
0.1
0.2
Metro telworks private limited
0.0
0.0
Metro wireless engineering i pvt ltd
0.0
0.0
Metropark infratech & realty developments pvt ltd
0.7
0.7
Mode finserver private limited
0.0
0.0
Nagarjuna construction co ltd
0.1
0.1
Nestor pharmaceuticals ltd.
0.0
0.0
0.1
New age international pvt ltd
0.0
0.1
0.1
0.1
0.3
Nupur goenka
0.0
0.0
Onmobile global ltd
0.8
0.8
Parthiv hareshkumar shah
0.1
0.1
Pawan rajesh patel
0.0
0.0
Prakash chemicals international pvt ltd
0.0
0.1
0.1
0.2
Preferred card marketing pvt ltd
0.0
0.0
Prince plastics infrnational pvt ltd
0.2
0.2
Quasar media pvt ltd
0.0
0.0
Quick heal technologies limited
0.4
0.4
Quick heal technologies private limited
0.2
0.0
0.5
0.7
Rajesh vithalbahi patel
0.0
0.0
Rj corp limited
0.0
0.0
0.0
Rmn infotech private limited
0.0
0.0
0.0
Rony darayas gandhi
0.0
0.0
Royal pen and plastics ltd
0.0
0.4
0.4
0.7
Sameep k desai
0.0
0.0
Sameer joshi
0.1
0.1
Samin tekmindz india pvt ltd
0.0
0.0
Satish kelath menon
0.0
0.0
0.0
Shalby limited
0.0
0.0
Shapoorji pallonji infrastructure capital company pvt. Ltd.
0.1
0.1
Skanem interlabels industries p ltd
0.9
0.9
Sls software pvt ltd
0.0
0.0
Smile multimedia pvt ltd
0.0
0.0
Softage information technology ltd.
0.1
0.3
0.1
0.4
Suguna holdings p ltd
0.1
0.1
Sujan luxury hosptality private limited
0.4
0.4
Sunrise buildhome private limited
0.1
0.3
0.5
Supreme and company pvt. Ltd.
0.1
0.1
0.1
0.3
Tally solutions pvt. Ltd.
0.1
0.2
0.2
0.5
Tejas goenka
0.0
0.0
Vaibhavi varun rupani
0.0
0.0
Vijai infrastructure limited
0.3
0.3
Vir rajesh patel
0.1
0.1
Grand Total
124.4
0.8
0.6
1.3
5.9
4.6
6.2
1.7
9.0
154.6
Table A6: Indian foreign direct investment flows to Zambia from 2008 to 2016
2008
2009
2010
2011
2012
2013
2014
2015
2016
Total
Adcc infocad limited
0.0
0.0
Arvee electricals and engineers private limited
0.0
0.0
Bank of baroda
7.9
7.9
Bank of India
7.8
7.8
Beena bapu bhosale
0.0
0.0
Bsbk private limited
0.0
0.0
Buniyad dwelling private pri
0.0
0.0
Capital corp
0.2
0.7
0.9
Central bank of india
7.9
7.9
Chetak enterprises limited
0.5
7.5
1.2
9.2
Chiteta mining company private limited
0.5
1.2
1.7
Dineshkumr modi
0.0
0.0
Eastland switchgears pvt ltd
1.8
0.3
0.3
2.4
Era hsg & developers (i) ltd
0.4
0.6
0.1
0.1
0.0
1.2
Eurasian minerals & enterprises p ltd
0.7
0.7
0.1
1.4
Gkc projects ltd.
0.0
0.6
0.0
0.6
Gravita exim ltd
0.1
0.1
0.1
Grn constructions pvt ltd
0.0
0.0
Hindustan dorr- oliver limited
0.0
0.0
Kohlenstoff resource developers private limited
0.2
0.2
Manjeet cotton private limited
3.4
4.7
0.2
8.2
Manji khimji hirani
0.1
0.1
Mcnally bharat engineering co. Ltd.
0.0
1.0
1.0
0.8
0.8
3.7
Omax minerals private limited
0.0
0.0
Onmobile global ltd
0.2
0.2
Orbit investments and trading pvt ltd
0.2
0.6
0.8
Paritoshbhai pravinchandra modi
0.0
0.0
Plr projects pvt ltd
1.2
0.4
10.6
0.3
12.5
Sm niryat pvt. Limited
0.3
0.3
Srr projects pvt ltd
0.8
0.8
Star orechem international pvt ltd.
0.2
0.1
0.0
0.1
0.4
Suyog chemicals pvt ltd
0.3
0.4
0.0
0.7
The tata power company limited
48.8
48.8
Tyre technocrats (india) pvt ltd
0.1
0.1
Varun beverages limited
27.2
27.2
Voice realtech pvt ltd
0.0
0.0
0.0
0.0
0.0
Zawar natural resources private limited
0.1
0.1
0.3
Total
0.1
0.6
0.9
2.0
4.1
6.7
13.6
88.1
29.4
145.3
Table A7: Indian foreign direct investment flows to Libya from 2008 to 2016
2008
2009
2010
2011
2012
2013
2014
2015
Total
Hydrpcarbon resources development co p ltd
0.0
0.0
Indian oil corporation ltd.
10.3
10.3
Navayuga engineering co ltd
0.2
0.2
Oil india limited
8.8
3.9
24.7
3.3
0.6
17.1
7.4
0.1
65.9
Ongc videsh ltd.
15.6
8.1
27.7
51.4
Shapoorji pallonji & co ltd
0.0
0.0
Simplex infrastructures ltd
0.8
0.8
Unitech infra limited
0.2
0.2
Total
24.5
12.9
52.5
3.5
0.6
27.4
7.4
0.1
128.8
Table A8: Indian foreign direct investment flows to Ethiopia from 2008 to 2016
[vii]S Prahalathan et al, “Outward Direct Investment from India: Trends, Objectives and Policy Perspectives”, Occasional Paper No. 165. Export-Import Bank of India, 2014.
[viii]Sinate et al, “West Africa: A Study of India’s Trade and Investment Potential”, Occasional Paper No. 158. Export-Import Bank of India, 2013.
[ix]Chris Alden and Raj Verma, “India’s Pursuit of Investment Opportunities in Africa” In India and Africa’s Partnership: A Vision for a New Future, Eds. Ajay Kumar Dubey and Aparajita Biswas (New Delhi: Springer, 2016)
[x]Lucey, Amanda et al, “India–Africa relations: The role of the private sector”, ISS Paper 285. Institute for Security Studies, 2015.
[xi]“India-Africa: South-South Trade Investment for Development”, CII/WTO, 2013.
[xii]S Prahalathan et al, Outward Direct Investment from India: Trends, Objectives and Policy Perspectives”, Occasional Paper No. 165. Export-Import Bank of India, 2014.
[xxi]Spearman rank correlation is a non-parametric measure of rank correlation (statistical dependence between the rankings of two variables). It assesses how well the relationship between two variables can be described using a monotonic function.
[xxvii]Confederation of Indian Industries (CII), “India’s Development Cooperation with Africa: What Role for the Private Sector”, (New Delhi: CII)
[xxviii]Jing Gu, “China’s Private Enterprises in Africa and the Implications for African Development”, European Journal of Development Research 21, no 4(2009), 570
[xxix]S Prahalathan et al, Outward Direct Investment from India: Trends, Objectives and Policy Perspectives”, Occasional Paper No. 165. Export-Import Bank of India, 2014.
[xxx]Confederation of Indian Industries (CII), “India’s Development Cooperation with Africa: What Role for the Private Sector”, (New Delhi: CII)
[xxxii]Chris Alden and Raj Verma, “India’s Pursuit of Investment Opportunities in Africa” In India and Africa’s Partnership: A Vision for a New Future, Eds. Ajay Kumar Dubey and Aparajita Biswas (New Delhi: Springer, 2016)
The views expressed above belong to the author(s). ORF research and analyses now available on Telegram! Click here to access our curated content — blogs, longforms and interviews.

 PDF Download