India pulled out of the planned Regional Comprehensive Economic Partnership (RCEP) in 2018 after entering negotiations in 2013. India has a trade deficit with 11 out of the 15 RCEP countries and some analysts have theorised that India decided to opt out of the agreement because of such adverse trade balance. Indeed, India has a trade deficit with most of its trade partners in past free trade agreements (FTAs). It is in this context that this brief examines India’s trade deficit with two of the top trading partners within RCEP with whom India has an existing trade agreement —i.e., Japan and South Korea, and points to what India must do to tilt the trade balance in its favour. It also explores India’s trade relations with Australia, with which the country is negotiating an FTA. It highlights what India must do in future FTA deals to reduce trade deficits and gain from such agreements.
Attribution:
Nandini Sarma, “Free Trade after RCEP: What Next for India?” ORF Issue Brief No. 353, April 2020, Observer Research Foundation.
Introduction
The Regional Comprehensive Economic Partnership (RCEP) is a proposed free trade agreement (FTA) between the member states of the Association of Southeast Asian Nations (ASEAN) and other trade partners. The groundwork for RCEP was laid down in August 2012, when the Economic Ministers of the participating countries adopted the “Guiding Principles and Objectives” for Negotiating the Regional Comprehensive Economic Partnership in Siem Reap, Cambodia.[1] Proponents touted RCEP as the world’s largest trade deal, which will account for a third of the global gross domestic product (GDP) and involve almost half the world’s population. The combined GDPs of India and China alone would have accounted for more than 50 percent of the combined GDP.
In October 2018, Indian Prime Minister Narendra Modi announced in the RCEP summit in Bangkok that India will not be a part of RCEP as it does not reflect the basic spirit and guiding principles of RCEP.[2] This announcement followed several years of vacillating over the question of whether or not to join the RCEP. In 2019, India’s position changed from actively defending why the country needed to be part of the group and how staying out would leave India “isolated”;[3] to later defending India’s decision to exit the negotiations in the name of “national interest”.[4] There are no publicly available documents that contain the precise details of the final discussions that led to the decision to keep out of RCEP. In a press briefing, the official spokesperson to the Ministry of External Affairs in the Government of India mentioned that the reasons have been conveyed to the participating nations and that the outcome was not “fair and balanced”; there was no further elaboration.[5]
To be sure, however, India has had reservations about RCEP from the beginning. These issues are related to tariff commitments, investments, electronic commerce, rules of origin, and auto trigger mechanisms. Further, given the current economic slowdown,[6] the government faced tremendous pressures from different sections of the industry and political organisations to not join the RCEP. Various ministries such as agriculture, steel, chemicals and MSME had also opposed the deal.[7]
Joining the RCEP would have made India part of the rule-making body of what is supposed to be the largest trade agreement in the world. The RCEP was also expected to push India to pursue much needed domestic reforms to make the manufacturing sector more competitive. To begin with, India already has bilateral FTAs with ASEAN, Korea and Japan, and negotiations are underway with Australia and New Zealand; India, therefore, had familiarity with these economies. However, the inclusion in the RCEP of China—with which India has a trade deficit of US$ 54.7 billion in 2018—half of the country’s total trade deficit—was a cause of concern for India’s negotiators. This trade gap has grown tremendously since China’s accession to the World Trade Organization (WTO) in 2001. It was, therefore, a matter of concern: how another wave of liberalisation under RCEP that would further reduce tariff lines across a higher number of products, would worsen this large trade deficit.
While it is not known to what extent the China factor played a role in India’s final decision, it does highlight the issue of trade deficit that India faces with majority of the countries that it has trade relations with. India’s experience from most of its existing trade agreements is that its trade deficits with its partners worsens, even as the overall trade relations improve. Following its exit, India plans to take steps to review its existing FTAs,[8] focusing on measures that will reduce its trade deficits.
India’s Current FTAs with RCEP Countries: Case Studies
Comprehensive Economic Partnership Agreement (CEPA) with Japan
India’s Comprehensive Economic Partnership Agreement (CEPA) with Japan came into effect in 2011. The agreement provided for a tariff reduction on 90 percent of goods traded between the two countries.
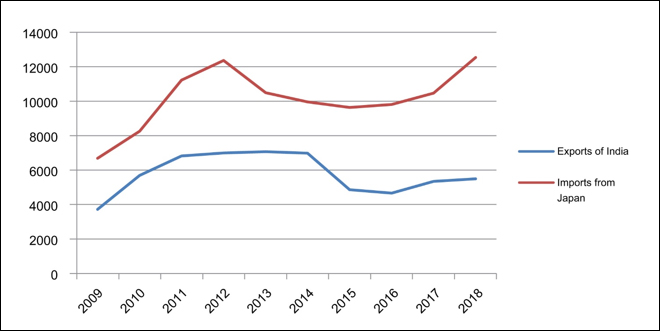
In the years following the signing of the trade agreement, imports from Japan have risen faster than exports of India. (See Figure 1.)
Fig. 1: India’s Trade Deficit with Japan (in US$ million)
Source: Author’s own, using data from UN Comtrade
Table 1 shows the decrease in value of exports of India to Japan between 2009 and 2018, in comparison to the rise for Japan’s exports to India. For the study, mirror data is used from the data source, UN Comtrade.[a] Indeed, after an initial increase, India’s exports to Japan contracted in the years 2014, 2015 and 2016.
Table 1. Exports of Japan and India (US$ billion)
2011
2012
2013
2014
2015
2016
2017
2018
Growth rate (2011-2018)
Exports of India
6.8
7.0
7.1
6.9
4.9
4.7
5.4
5.5
-19%
Exports of Japan
1.1
1.2
1.04
9.9
9.6
9.8
10.5
12.5
12%
Data Source: UN Comtrade
Out of India’s export basket to Japan, 12 items (at the 2-digit HS code level) have a value of more than US$ 100 million; for Japan’s exports to India, there are 18 such products. The main exports from India are petroleum products, chemicals, jewellery, marine products, and textiles. Meanwhile, the main exports from Japan to India are machinery, plastic, transport equipment like motor vehicles and ships, iron & steel products, electrical machinery, manufactures of metals, coal and briquettes, and optical instruments.
Table 2: Top exports of India with value greater than US$ 100 million
HS Code
Product Description
2018 (US$ million)
27
Mineral fuels, mineral oils and products of their distillation; bituminous substances; mineral waxes
843
29
Organic chemicals
720
71
Natural, cultured pearls; precious, semi-precious stones; precious metals, metals clad with precious metal, and articles thereof; imitation jewellery; coin
449
3
Fish and crustaceans, molluscs and other aquatic invertebrates
422
72
Iron and steel
275
84
Nuclear reactors, boilers, machinery and mechanical appliances; parts thereof
265
87
Vehicles; other than railway or tramway rolling stock, and parts and accessories thereof
210
76
Aluminium and articles thereof
210
26
Ores, slag and ash
209
62
Apparel and clothing accessories; not knitted or crocheted
208
39
Plastics and articles thereof
126
90
Optical, photographic, cinematographic, measuring, checking, medical or surgical instruments and apparatus; parts and accessories
107
Data Source: UN Comtrade
The following sections will analyse India and Japan’s trade in specific commodities.
Pharmaceutical products
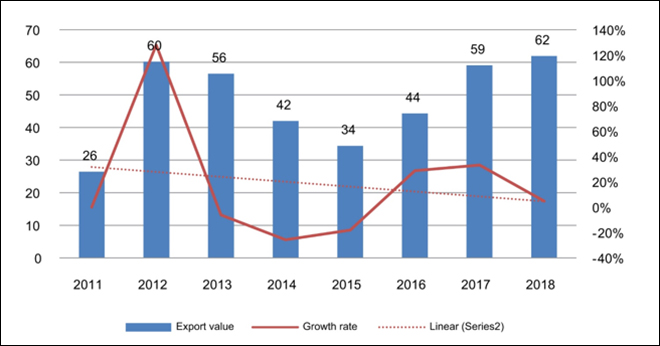
One important point of analysis would be to look at the sectors that comprise India’s strengths, but do not figure in its top exports to Japan. One such sector is pharmaceutical products (See Figure 2). Incidentally, this sector figures in the top ten imports of Japan.[9] India’s exports of pharmaceutical products to Japan was valued at US$ 61 million in 2018.
Fig. 2: India’s Exports to Japan (HS Code 30) in US$ million
Source: Author’s own, using data from UN Comtrade
Overall, pharmaceutical products have benefitted from India and Japan’s CEPA in terms of tariff reduction to zero from a level of 3.1 percent. Since 2011, when the CEPA came into effect, the bilateral trade in pharmaceuticals has grown at an average annual rate of 34 percent. However, the year-on-year growth has been more erratic. In this sector, there is great potential for trade in generic drugs as the Japanese government has set a target that by 2020, 80 percent of drugs in its market will comprise of generics.[10] Indian companies are attempting to make a foray into Japan’s generics market but they are facing hurdles: Japan’s domestic market is relatively self-sufficient, and the Japanese market prefers domestic brands to foreign ones.[11] India could gain more clarity in this aspect when Article 54 of CEPA—which deals with generic drugs and calls for national treatment amongst other conditions—is finalised.
Fish and crustaceans, molluscs and other aquatic invertebrates (HS Code 03)
Fig. 3:India’s Exports to Japan (HS Code 03) in US$ million
Source: Author’s own, using data from UN Comtrade
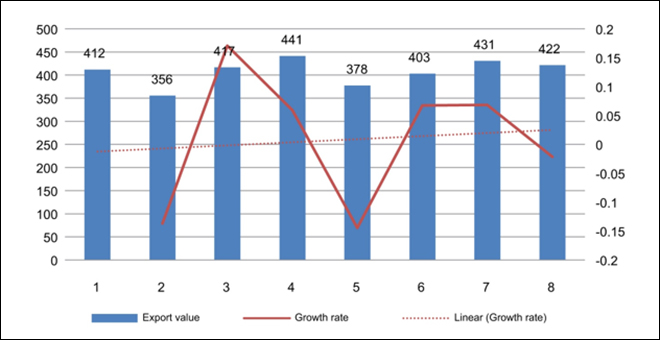
Figure 3 shows fish and crustaceans, molluscs and other aquatic invertebrates (HS product code 03) as one of India’s top exports to Japan that have similarly benefitted from lower tariff rates owing to CEPA. This set has an annual average growth rate of about one percent, and is also one of the product groups that have high utilisation rates within CEPA.[12] However, India has faced stringent Sanitary & Phytosanitary Measures (SPS) measures that have affected exports, as well as a possible ban such as on shrimp exports (which is one of the major export items under Product HS Code 03).[13] Such sectors should be treated on priority basis to ensure that India is able to benefit from their export potential. Indian exporters would need to adhere to more stringent quality measures (implemented by the Export Inspection Council and MPEDA) to ensure that Indian products are not rejected upon inspection.
Articles of apparel and clothing accessories, not knitted or crocheted (HS Code 62)
Fig 4: India’s Exports to Japan: Articles of apparel and clothing accessories etc (HS Code 62) in US$ million
Source: Author’s own, using data from UN Comtrade
Articles of apparel and clothing accessories, not knitted or crocheted (product HS code 62) features amongst India’s top 12 exports to Japan. While there was lowering of tariff rates for this product in CEPA, the absolute trade value has declined (See Fig. 4). Moreover, the annual average growth rate has been negative two percent. This may be due to competition from other countries, as similar benefits also accrue to Japan’s other trade partners like Bangladesh and Vietnam; these countries surpass India in terms of export share in textiles. Therefore, for India to remain competitive in textiles, it has to innovate in terms of product line and cost-reduction measures.
Another important task for India in order to address its rising deficit with Japan, is to identify domestic supply constraints that are affecting the export potential. For example, certain sectors had a zero MFN and thus the CEPA did not have a tariff reduction benefit. However, domestic factors played a role. This includes the iron ores exports (that features in the top 12 exports to Japan from India) that was affected by export limits imposed by the Supreme Court, and the other is soya bean meal export that could not compete with lower international prices.[14]
In view of its expanding trade deficit with Japan, India may also need to compensate in other areas such as investment. After all, India has been ranked as one of the top investment destinations for Japanese companies.[15] Overall, India’s current share in Japan’s total FDI remains small. The total investments from Japan from 2000 to June 2019 has been around US$ 32 billion (Japan ranks third among the major investors in India.[16]) Japanese FDI into India has mainly been in the automobile, electrical equipment, telecommunications, chemical, financial (insurance), and pharmaceutical sectors. In 2014, India initiated a Japan Plus programme under which Japan offered to invest 3.5 trillion yen (US$ 33.5 billion) in India by way of public and private investment and financing over the subsequent five years.[17] It is beyond the scope of this brief to scrutinise these investments, but it argues that India should address the key hurdles that are faced by Japanese investors.
Comprehensive Economic Partnership Agreement (CEPA) with South Korea
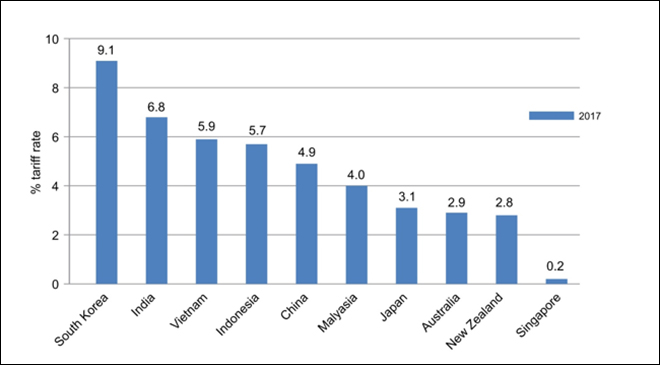
India’s Comprehensive Economic Partnership Agreement (CEPA) with the Republic of Korea (ROK, or South Korea) came into effect in 2010, covering trade in goods and services, investment, competition, and intellectual property rights (IPRs). The tariff reductions were divided into six different categories. The tariff reduction for ROK took place at the 8-digit HS Code level, and for India, at the 10-digit level. Further, it is noteworthy that tariff reductions were deeper for India as it has higher tariff rates as compared to South Korea, to begin with (See Fig. 5). India, however, has a number of items under the exclusion list.[18]
Fig 5: Weighted Average MFN Tariff rates
Source: Author’s own, using data from World Bank
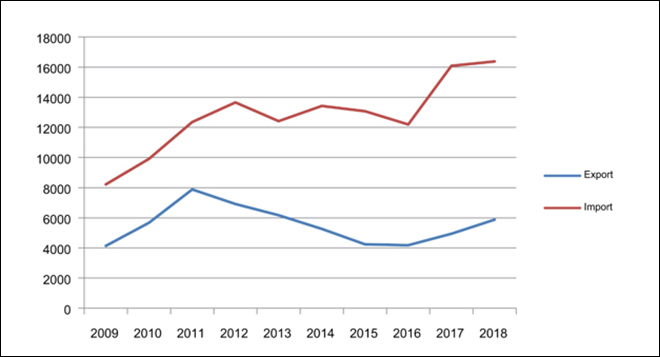
Fig. 6 shows the increasing trade deficit after 2010. The mirror data used has been taken from UN Comtrade. As seen in the graph, the trade deficit increased after the signing of the CEPA, reaching US$ 10.5 billion in 2018.
Fig 6: India’s Trade Deficit with South Korea (US$ million)
Source: Author’s own, using data from UN Comtrade
Further, the average annual growth rate of exports from South Korea between 2010 and 2018 has been at 39 percent, whereas that of exports from India has been at four percent. After the initial increase in exports from India, as seen from Figure 6 and Table 3, the value of exports declined continually, albeit slightly recovering in 2018. The export value increased to US$ 7.9 billion in 2011 but thereafter declined, dropping to US$ 4.2 billion in 2016. The trade deficit in favour of ROK reached US$ 10.5 billion in 2018.
Table 3: Exports of both countries in US$ billion
2010
2011
2012
2013
2014
2015
2016
2017
2018
Exports from India
5.7
7.9
6.9
6.2
5.3
4.2
4.2
4.9
5.9
Exports from South Korea
9.9
12.4
13.7
12.4
13.4
13.1
12.2
16.1
16.4
Trade Deficit
-4.2
-4.5
-6.8
-6.2
-8.2
-8.8
-8.0
-11.1
-10.5
Data Source: UN Comtrade
Table 4 shows the composition of exports from India that have a value greater than US$ 100 million, comprising mainly raw materials such as cotton, metals or intermediate goods. This implies that their demand is more elastic and global factors such as demand and supply will play a larger role than tariff concessions. This is in contrast to the higher valued exports from South Korea to India (See Table 5.)
Table 4: Top 12 exports from India of value more than US$ 100 million in 2018
27
Mineral fuels, mineral oils and products of their distillation; bituminous substances; mineral waxes
1282
76
Aluminum and articles thereof
904
29
Organic chemicals
594
72
Iron and steel
447
52
Cotton
269
84
Nuclear reactors, boilers, machinery and mechanical appliances; parts thereof
196
85
Electrical machinery and equipment and parts thereof; sound recorders and reproducers; television image and sound recorders and reproducers, parts and accessories of such articles
169
78
Lead and articles thereof
166
79
Zinc and articles thereof
166
23
Food industries, residues and wastes thereof; prepared animal fodder
164
26
Ores, slag and ash
144
32
Tanning or dyeing extracts; tannins and their derivatives; dyes, pigments and other colouring matter; paints, varnishes; putty, other mastics; inks
112
Data Source: UN Comtrade
Table 5 shows the top South Korean exports at more than US$ 100 million. They are 18 in number, as compared to 12 shown earlier for India. The export basket contains high-value goods such as electrical equipment, vehicles, optical instruments, and ships.
Table 5: Top 18 exports of South Korea of value more than US$100 million
85
Electrical machinery and equipment and parts thereof; sound recorders and reproducers; television image and sound recorders and reproducers, parts and accessories of such articles
2671
72
Iron and steel
2535
84
Nuclear reactors, boilers, machinery and mechanical appliances; parts thereof
2450
39
Plastics and articles thereof
1805
29
Organic chemicals
1140
27
Mineral fuels, mineral oils and products of their distillation; bituminous substances; mineral waxes
905
87
Vehicles; other than railway or tramway rolling stock, and parts and accessories thereof
711
79
Zinc and articles thereof
434
90
Optical, photographic, cinematographic, measuring, checking, medical or surgical instruments and apparatus; parts and accessories
423
89
Ships, boats and floating structures
380
40
Rubber and articles thereof
363
73
Iron or steel articles
340
48
Paper and paperboard; articles of paper pulp, of paper or paperboard
301
76
Aluminium and articles thereof
269
38
Chemical products n.e.c.
219
82
Tools, implements, cutlery, spoons and forks, of base metal; parts thereof, of base metal
191
78
Lead and articles thereof
184
28
Inorganic chemicals; organic and inorganic compounds of precious metals; of rare earth metals, of radio-active elements and of isotopes
169
Data Source: UN Comtrade
The growth rate of exports from India, and the composition on the export markets, have been a few factors that have led to the rising of the trade deficit. India would need to look into how this deficit can be reduced by focusing on a few specific sectors.
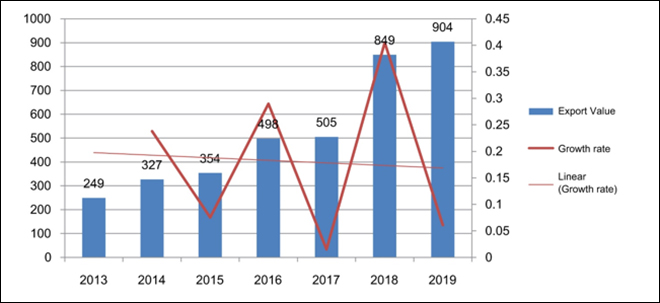
Aluminium and articles thereof (HS Code 76)
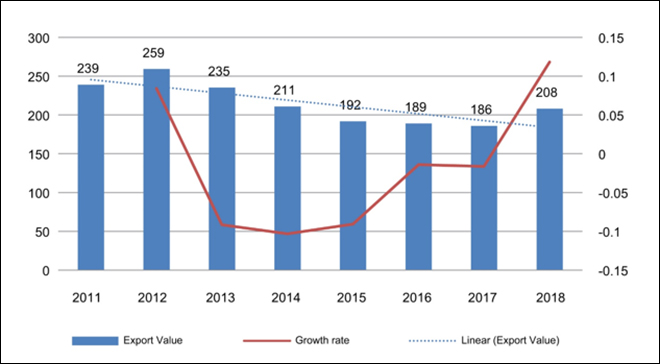
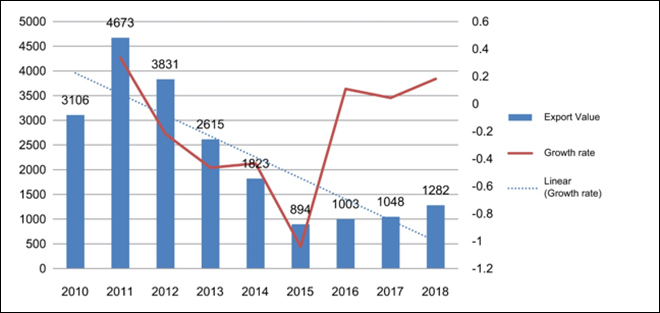
Aluminium has had an average annual growth rate of 30 percent, the highest amongst India’s exports to South Korea. Figure 7 shows the value of exports and the growth rate. Aluminium products have gained on account of tariff reduction but it is in the area of low value-added aluminium. How can India move up the value chain in this product?
Fig. 7. India’s exports to South Korea (HS Code 76) in US$ million
Source: Author’s own, using data from UN Comtrade
Mineral fuels, mineral oils and products of their distillation; bituminous substances; mineral waxes (HS code 27)
The sector which has amongst the highest negative average annual growth rate at 19 percent, is Product code HS 27 (Mineral fuels, mineral oils and products of their distillation; bituminous substances; mineral waxes). Within this category, Napha has been the largest beneficiary. But the trade value has almost halved over the years, even as tariffs have been reduced to zero. One reason could be that Korea is itself a major producer and exporter of Product 27.
Fig 8: India’s exports to South Korea (HS Code 27) in US$ million
Source: Author’s own, using data from UN Comtrade
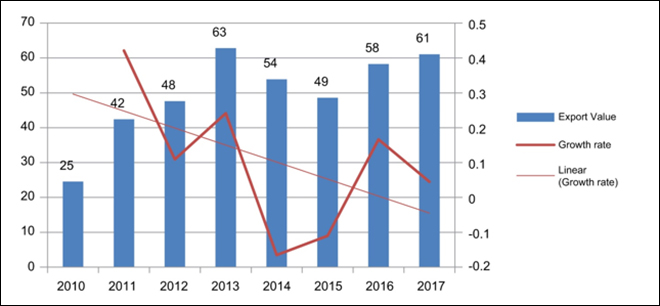
Pharmaceutical products (HS Code 30)
The other sector, pharmaceuticals, as in the case of Japan, is not amongst the top exports to South Korea, which is in contrast to the global export trends of India. As seen from Figure 9, the value of exports in 2018 was at US$ 61 million. The growth rate also shows a downward trend over the years. This would be a sector where the Indian government could hold talks with the ROK government to identify opportunities and plug any regulation or hurdles. India has been organising the India Pavilion at Korea Pharm for the past five years to promote pharmaceutical exports to South Korea.[19]
Fig 9: India’s exports to South Korea (HS Code 30) in US$ million
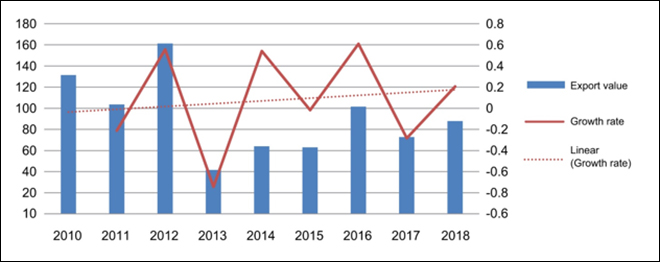
Another sector where India has strong exports globally is Product code HS 71 (precious stones and jewellery etc). This product does not come in the major exports to South Korea. Its total value stands at about USD 88 million and its value has declined from USD 222 million since 2009. For this particular sector, two reasons have been pointed out, one is that it has very high value added requirement (of greater than 35 percent) to qualify for tariff reduction in Korea. Further, the Korean government imposes high luxury tax on the product.[20]
Fig. 10: India’s exports to South Korea (HS Code 71) in US$ million
Source: Author’s own, using data from UN Comtrade
Overall, the utilisation rate for exporters,[b] as per ROK data, has been 67 percent in 2014. It is amongst the lowest utilisation rates amongst all the FTAs signed by Korea.[21] Unfortunately, as also in the case of Japan, India does not maintain any data on utilisation rates. Such a database would help identify the sector-specific reasons for low utilisation and more targeted action can be taken to improve the utilisation rates.
FTA Negotiations with Australia
In this section, the brief examines India’s trade relations with Australia, the non-FTA member of RCEP with which India has been negotiating an FTA for the past eight years. In 2018, Australia released a document titled “An India Economic Strategy to 2035” which identified the key sectors for the country to invest in. According to the document, Australia intends to make India its third largest export market by 2035.[22] In response, the Indian government has commissioned a similar report for Australia and the first draft is being crafted.[23]
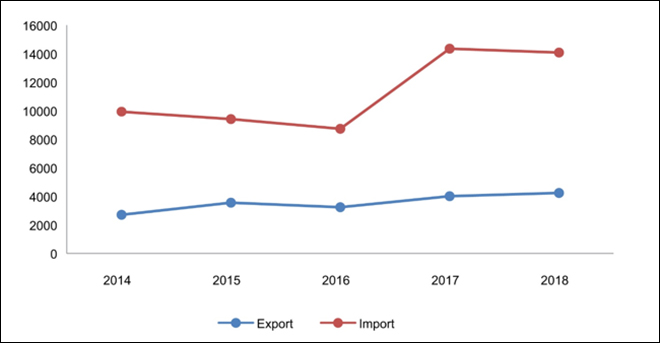
To be sure, India and Australia’s trade relations have grown without an FTA, reaching US$ 16.6 billion in 2018. That year, according to data from UN Comtrade, Indian exports to Australia were at US$ 4.2 billion, and Indian imports from Australia at US$ 14.1 billion. Figure 11 shows that India’s trade deficit with Australia has increased over the years: India’s exports to Australia have not grown at the same rate as its imports from Australia.
Fig. 11: Trade Balance with Australia (US$ million)
Source: Author’s own, using data from UN Comtrade
Australia ranks 34th amongst destination countries of India’s total exports. For Australia’s exports, meanwhile, India is the fourth largest destination. India’s top exports to Australia are pharmaceutical products, textiles, jewelry, vehicles, and mineral fuels; its main service exports to Australia are computer and information services, and tourism.[24]
Table 6: Exports of India to Australia (>US$ 100 million)
Product Description
2014
2015
2016
2017
2018
27
Mineral fuels, mineral oils and products of their distillation; bituminous substances; mineral waxes
308
1267
868
1221
943
71
Natural, cultured pearls; precious, semi-precious stones; precious metals, metals clad with precious metal, and articles thereof; imitation jewellery; coin
346
325
334
348
353
86
Railway, tramway locomotives, rolling-stock and parts thereof; railway or tramway track fixtures and fittings and parts thereof; mechanical (including electro-mechanical) traffic signalling equipment of all kinds
12
6
56
159
352
30
Pharmaceutical products
204
211
258
272
303
84
Nuclear reactors, boilers, machinery and mechanical appliances; parts thereof
136
138
136
195
222
85
Electrical machinery and equipment and parts thereof; sound recorders and reproducers; television image and sound recorders and reproducers, parts and accessories of such articles
129
99
96
141
190
63
Textiles, made up articles; sets; worn clothing and worn textile articles; rags
118
126
125
138
143
87
Vehicles; other than railway or tramway rolling stock, and parts and accessories thereof
228
149
111
101
135
73
Iron or steel articles
77
82
63
92
126
62
Apparel and clothing accessories; not knitted or crocheted
90
108
111
122
122
29
Organic chemicals
111
104
87
109
101
Data Source: UN Comtrade
The primary export from Australia to India is coking coal (HS code 2710) at 65 percent of all exports to India in 2018.[25] India does not produce high-quality coal, and therefore imports large quantities of the commodity. Indian companies have also invested in coal mining in Australia to cater to the domestic demand. The largest such strategic investment was made by Lanco Infratech Limited in 2010.[26] India’s other imports from Australia include gold, copper, aluminium and petroleum products, all of them used as inputs for the domestic industry. Some of these goods also feature in India’s exports: they are used as inputs for manufacturing, and the finished goods are then exported.
Table 7: Exports of Australia to India (>US$ 100 million)
ProductDescription
2014
2015
2016
2017
2018
27
Mineral fuels, mineral oils and products of their distillation; bituminous substances; mineral waxes
5487
5389
5339
9041
10299
26
Ores, slag and ash
1221
836
545
617
906
28
Inorganic chemicals; organic and inorganic compounds of precious metals; of rare earth metals, of radio-active elements and of isotopes
265
260
273
608
653
71
Natural, cultured pearls; precious, semi-precious stones; precious metals, metals clad with precious metal, and articles thereof; imitation jewellery; coin
1491
1155
394
751
617
51
Wool, fine or coarse animal hair; horsehair yarn and woven fabric
176
162
163
181
203
76
Aluminium and articles thereof
90
144
147
205
201
78
Lead and articles thereof
116
98
92
115
131
72
Iron and steel
147
132
84
103
116
8
Fruit and nuts, edible; peel of citrus fruit or melons
109
157
90
133
107
Data Source: UNComtrade
In the report discussed earlier, titled, “An Indian Economy Strategy to 2035”, Australia identified key sectors where the Australian investments and know-how could lead to mutual benefits; these include education and academic collaboration, tourism, natural resources, and agri-business.[27] Australia does see India as a potential large market for its products, given the growth rate and the size of the Indian economy. However, Australia may not be a large market for Indian products, given the size of the Australian economy.
What can help bridge the gap is encouraging investments on both sides. The Australian report mentions an ambitious investment target of more than US$ 100 billion; at present, Australia’s investments in India are valued at US$ 14 billion. Indian investments in Australia have faced opposition in recent times on account of environmental concerns. For example, for the past nine years, there have been sustained large-scale protests against the Carmicheal coal mines over concerns that it would cause severe damage to the Great Barrier Reef.[28] Moreover, the Australian government has reversed earlier decisions by placing more stringent conditions related to environmental concerns. For example, the approval for the investment in Carmicheal coal mines states that the plan has gone through a process of rigorous scientific inquiry and approvals.[29] However, the approval of Adani’s groundwater plan was criticised by environmental groups who are considering taking legal action.[30] A more formal agreement between the two governments regarding rationalising of environment standards would help ease investments in the future.
Australian investment can help in the development of the mining industry in India, which is one of the identified sectors in the Australian government’s report, “An India Economic Strategy to 2035” released in 2018.[31]Australia could also be a source of high-grade coal that would help India reduce its carbon footprint; there is also uranium, which could help in India’s transition to clean nuclear energy. Indeed, Australia could be a strategic energy partner for India.
One of the other sectors mentioned in the same report is agri-business. The issue of agricultural tariffs was at the forefront of India’s apprehensions for joining RCEP. For example, the dairy industry in India was concerned about the impact of opening up to competition from Australia and New Zealand.[32] For Australia, dairy exports are in the top 20 commodities in its export basket, with a value of US$ 2 billion in 2018.[33] Currently, India imports a negligible amount of dairy products from Australia. The RCEP would have allowed dairy imports at zero duty. Tariff on dairy products in India ranges from 40-60 percent at the Most Favoured Nation (MFN) rate.[34] India has high levels of tariff protection for agricultural products at an average of 38.8 percent, according to WTO.[35] However, investments from both countries could help in meeting the massive gaps in food security in India.
The Australian government’s report highlights the means by which the country can contribute in India’s agribusiness through agricultural science, towards increasing productivity and promoting sustainability. For example, although India ranks first in the world in terms of milk production, the per animal productivity is at 1,806 kilogram a year, whereas the world average is 2,310 kilogram.[36] The dairy industry in India employs more than 150 million people, more than 70 percent of whom are women. Further, Indian investors could lease out arable land in Australia to grow pulses which are in short supply in India.
It is clear that despite the large trade gap between India and Australia, there are potential areas of cooperation that the two countries can explore.
Conclusion
One of the major issues that India has faced with respect to its FTAs is the increase in trade deficit that have resulted after signing the FTA. (The exception to this pattern is its trade relations with Sri Lanka.) The rising trade deficit poses a serious issue for India as it implies a burden of payments that need to be made in foreign currency and reserves, failing which can lead to a balance of payment (BOP) crisis. The full costs and benefits for India of being a part of RCEP are not known. It is, however, a fact that the current levels of trade deficit are untenable. India would need to look into reducing its deficit with its various trade partners.
A slower and more sustainable integration into a trade deal such as RCEP would have suited India. Now that India is not a part of RCEP, the country needs to begin the long pending reforms of the domestic sector. This should be done meticulously and on a mission mode.
As shown in this analysis, India’s export basket is concentrated on the lower stages of manufacturing. It is important for India to move up the value chain to ensure that tariff reductions have their intended impact. Primary and intermediate goods are more affected by demand and supply factors rather than income factors. Therefore, high-value goods have greater buoyancy. One reason for India to not have benefitted from past FTAs is due to low utilisation between five to 25 percent, as argued in this brief.[37] India needs to take this opportunity to review its existing FTAs and identify sector-specific reasons for such low utilisation rates.
The pressure from various sections of the industry to not join the RCEP was clear and the government’s decision was to protect the economy from any further external shocks. India must undertake internal reforms to make the manufacturing sector more competitive. It should also review its existing FTAs in order to reap their intended benefits. For the long term, India must participate in the global value chain and trade structure and play a leadership role in setting up rules that would define trade relations and cooperation between nations. As India prepares to renegotiate its FTAs with Japan and ASEAN, it should examine the reasons for its trade deficit and explore the sector-specific measures that need to be taken to gain from future trade deals.
Endnotes
[a] Mirror data: For a given country, imports are usually recorded with more accuracy than exports because imports generally generate tariff revenues while exports don’t. Thus, in calculating the exports figure for the two countries, the mirror data is used. This means, India’s exports data is taken from data of Japan’s imports from India. Similarly, Japan’s export figures are taken from India’s imports from Japan.
[b] Utilisation rate: It is defined as the share of trade under FTA schemes out of total trade of products eligible for these schemes.
The views expressed above belong to the author(s). ORF research and analyses now available on Telegram! Click here to access our curated content — blogs, longforms and interviews.

 PDF Download