I. Introduction
The world is amidst unprecedented digitalisation, reimagining and recalibrating old notions of time, speed and distance. Innovations that were fodder for science-fiction have now become possibilities. A key chapter in this new era is the Fourth Industrial Revolution (4IR)—the metamorphosis of economic processes, such as production and management, which is an outcome of leveraging technology and digital innovation. The rates of progress and the levels of development that have entailed the 4IR have surpassed most of what the world has experienced before. It is anchored in collaboration and the interplay between technologies, implying limitless possibilities. Indeed, what this revolution does is “making impossible possible”, and not only in the economic domain, but in every aspect of human life.[1]
Consider the case of virtual or digital markets. These markets have made physical space constraints redundant and eliminated the need to visit shops on the ground. Given space constraints, traditional brick-and-mortar markets require identifying mainstream and popular commodities to optimise the use of available space in maximising profits. In the digital era, the seller can cater to even the narrowest and niche demands of consumers. The outcome is mutually beneficial; buyers find their niche demand satisfied and sellers make profits higher than what the traditional format allowed them.[2]
The very definition of “money” has also evolved in parallel with digitalisation. From salt, and beads, and cattle to gold, then to paper money, and now to electronic or plastic money, this medium of exchange has adapted to the dynamics of technology advancement and economic activity.[3] Today, it is the time for digital transactions.
Transactions are fundamental to economic activity and cannot be bypassed in addressing concerns of efficiency. Efficient transactions economise on the use of some tangible or intangible resource. Speed reduces consumption of time, convenience saves human energy, and cost-effectiveness prevents wastage of material resources. The adoption of a transactions system is incentivised by such efficiencies. Electronic payments are efficient in this sense. This efficiency is accompanied by increments in productivity and reduction in costs of financial institutions such as banks responsible for intermediating and managing transactions. Digital transactions not only facilitate, but also boost economic activity. Studies have found that higher use of electronic payments contributes positively to consumption, creation of employment opportunities, and, therefore, to economic growth.[4]
India is no exception to this ongoing drive for digitalisation. This paper examines India’s journey towards going cashless, beginning much before demonetisation which was imposed in November 2016. It explicates the fundamentals of the digitalisation process, arguing that these pillars are key to effective policy formulation. Section II presents a theoretical model that decodes the process of digitalisation of transactions according to global experience. The subsequent section surveys India’s performance on certain structural parameters that provide the bedrock for a cashless economy. Section IV is dedicated to understanding how digitalisation has unfolded in Sweden and China, and how their experience may provide inspiration to India’s own cashless journey. The paper devotes Section V to analysing data on digital payments in India before and after demonetisation, identifying the trends and the trajectory followed by cashless transactions in India. The concluding section articulates the way forward.
II. The Process of Digitalisation of Transactions: A Model
The theoretical exposition presented in this section is almost universal, accounting for the process of digitalisation as it has unfolded across various countries. Within this account, digitalisation of payment systems is conceived as one of the various interrelated outcomes of the structural evolution of an economy. The structural parameters correlating with and /or demarcating the pace and coverage of the digitalisation of transactions have been identified and classified into four categories as follows: Infrastructure; factors affecting the propensity of digital payments adoption; institutional factors; and innovation and change. These structural characteristics make the digital/non-cash payments ecosystem self-sustaining in nature.[5]
Infrastructure:
Access to high-speed internet and wide mobile network coverage are the pillars of the digitalisation infrastructure. The ability to cater to these infrastructural needs, in turn, relies on the level of electrification and geographical accessibility made possible by well-developed transport systems. A thriving network of financial institutions that reaches all corners of the nation—especially a high penetration of banks—increases the prospects of universal financial inclusion, providing an opportunity for many to engage in cashless transactions.[6]
Factors affecting the propensity of digital payments adoption:
The use of digital modes of transaction is positively correlated with the levels of education and consumer income. These parameters determine the ability rather than the willingness of a consumer to adopt digital transactions. The financial wherewithal and credit worthiness of merchants affect their ability to provide digital payment solutions and, in turn, the expansion and coverage of acceptance infrastructure for cashless payments.[7]
The size of the informal economy of a nation reflects the proclivity of cash use. The network effects, emerging from a dominant informal sector, lock in persistent cash use as the inevitable status quo.[8]
Institutional environment:
In the context of digital transactions, institutions are entrusted with the responsibility of building and maintaining trust. There are dimensions to the notion of “trust” required in a digital framework: trust that digital money will always be legal tender, underwritten by laws of contract enforcement and property rights; trust that follows from stringent privacy and data protection laws; and trust that inculcates a sense of security because the probability of fraud and theft has been minimised.[9]
Stories of digitalisation from across the globe underscore the importance of an enabling regulatory environment that makes the adoption of digital payments by consumers and acceptance of such payments by merchants convenient and economical. Various governments have been proactive in adding to the pace of digitalisation by introducing initiatives such as disbursing wages of their employees using digital channels and using the electronic gateway to make other G2P payments, for instance, subsidies.[10]
In the current scenario, the benchmarks for the parameters that determine ease of doing business are decided by the progress made in the digital paradigm. Digital technology can transform procedures involved in starting a business, including registration requirements, acquisition of licenses and permits, obtaining electricity and other utility connections, and payment of taxes. This elevates the transparency, and time- and cost-effectiveness of business regulations to a new level. The digitalisation of the business environment influences the uptake of digital methods in business transactions.[11]
Innovation and change:
Innovation is the bedrock of digitalisation. It makes available products for cashless transactions. Whether or not change will follow innovation depends on the affordability of products of such innovation. To move closer to the goal of a cashless society, innovators must be sensitive to the educational and income profiles of citizens that their innovation caters to.[12]
The process of evolution from being cash-based to cashless
There are four levels of cash use in the evolution of an economy’s transition from being cash-based to becoming nearly cashless:[13]
Stage I. Inception:
Countries in which cash accounts for more than 90 percent of the volume of consumer payments are in the first stage of the digitalisation process. These economies are remarkably distant from the benchmark vis-à-vis the structural parameters earlier described. Progress for these countries entails taking stock of these deficiencies and developing a comprehensive strategy to overcome them. Countries such as Kenya, Russia, Columbia and Saudi Arabia are in the inception stage. India belongs to this category as well, with 96 percent of all transactions being cash-based.[14]
Stage II. Transitioning:
Countries in this phase include those that have launched initiatives to overcome their structural deficiencies and have begun seeing improvements in this direction. These economies have managed to reduce the share of cash transactions to about 70-90 percent of the volume of consumer payments. Some examples are Brazil, China, Mexico, Malaysia, Spain and Poland.[15]
Stage III. Tipping point:
In this phase, countries that have matured into robust and well-developed economies are in the process of reaping the benefits of investing, over a long period, in the structural evolution of their economies. These countries have successfully reduced the use of cash to around 50-70 percent of the volume of consumer transactions. Some of the countries that are in this stage are the United States, Germany, Japan and Korea. [16]
Stage IV. Nearly cashless:
Nations which have reached this stage have leveraged almost all opportunities of going cashless. Less than 50 percent of the volume of consumer transactions use cash. Any further increment in cashless transactions would require disrupting the status quo through innovation. Countries that are nearly cashless include Sweden, Canada, France and Belgium. [17]
III. Cashless Structure: Where India Stands
The Digital Divide in India
The Networked Readiness Index (NRI), an initiative of the World Economic Forum, and the Information and Communication (ICT) Development Index, published by the UN’s International Telecommunication Union (ITU), attempt to quantify a nation’s progress in the digital paradigm and its ability to translate this progress into social and economic well-being. India’s performance in relation to these indices reflects the breadth of the digital divide prevailing in the country. In the 2016 NRI, India ranked 91st among 139 countries, while occupying the 134th position among 171 countries assessed in computing the ICT Development Index 2017. This poor performance is primarily attributed to lack of coverage and penetration of basic digital infrastructure, as well as educational and skill deficit.[18]
Even after 70 years of independence, around 24 percent of the Indian population continue to have no access to electricity; among those who do, a significant proportion suffer frequent power outages.[19] As of December 2017, internet penetration in the country was about 35 percent of the total population: 64.84 percent in urban India, and 20.26 percent for rural.[20] As far as mobile broadband is concerned, there are 5.5 subscriptions for every 100 people.[21] There is also a stark disparity in connectivity across states, explained by differing levels of affluence. Since affluence also determines access to superior quality of connections, many users in India have to contend with low-speed internet connectivity.[22] Affluence also explains why only 18 percent of Indians owned smartphones as of March 2016.[23]
| The income , wealth, educational and skill profile of India in numbers: |
| 58.4 percent of the nation’s wealth owned by the richest 1 percent[24] |
| 80.7 percent of wealth owned by the richest 10 percent[25] |
| 96.2 percent of adults own wealth under 10,000 USD[26] |
| 84 percent of the employed and 67 percent of households earn up to INR 10,000 a month[27] |
| 77 percent households do not have a single regular wage/regular salaried person.[28] |
| 72.5 percent of the population belongs to the poor and vulnerable category of expenditure class[29] |
| 31.7 percent of the workforce are illiterate[30] |
| 56 percent with education only up to primary level, six percent with educational level up to higher secondary and 1.9 percent are postgraduates or above[31] |
| 75.8 percent with no skill training[32] |
| 3.05 percent with formal training, while 12.46 percent with informal training[33] |
|
The degree of financial inclusion in India
Financial inclusion not only catalyses economic prosperity, but also enables participation in the process of economic growth and sharing in the gains that follow from an efficient and seamless mobilisation and allocation of economic resources. In its most rudimentary form, financial inclusion means easy and affordable access to formal means of saving and investment as well as credit facilities. Even in this form, financial inclusion continues to elude huge swathes of the Indian population, especially in the rural areas. There are three primary sources of financial exclusion in India: Poor physical access (low penetration of bank branches and ATMs); lack of financial access (high interest rates on credit, low savings that make bank accounts unviable); and low rates of financial literacy.[34]
Various initiatives have been launched by the Reserve Bank of India (RBI) and the government to mitigate financial exclusion. Unfortunately, these measures have met with limited success. For example, the RBI has been encouraging banks to offer what is known as ‘Basic Savings Bank Deposit Account’ which requires simplified Know Your Customer (KYC) norms, next to nil minimum balances, and nearly no charges. These accounts have hardly been used for transactions. The fate of bank accounts of the workforce under the Mahatma Gandhi National Rural Employment Guarantee (MNREGA), for example, and those opened under the Pradhan Mantri Jan Dhan Yojana scheme, has also been the same. The wages deposited by government agencies into the bank accounts of MNREGA workers are withdrawn immediately, leaving a balance of nearly-zero in these accounts. Similarly, as much as 80 percent of the bank accounts opened under the Pradhan Mantri Jan Dhan Yojana scheme have been dormant.[35]
What are the ramifications of low financial inclusion for adoption of non-cash payments? First, all electronic payment instruments presume the existence and use of bank accounts with appreciable levels of balance maintained in these accounts. After all, electronic transactions are essentially transfers of funds from the payer’s bank account to the payee’s account. Second, financial illiteracy acts as a handicap in grasping the technicalities involved in using electronic payment instruments and in appreciating the merits and gains that follow from such use.
The Micro, Small and Medium Enterprises (MSME) in India find their credit needs inadequately met. In 2013, a meagre 5.18 percent of both registered and unregistered MSMEs borrowed from institutional sources, while as little as 2.05 percent borrowed from non-institutional entities, leaving a significant 92.77 percent to rely on self-finance.
Moreover, there is paucity of alternative channels of finance such as risk or venture capital, making it inevitable to look to informal sources of finance that usually charge exploitative rates of interest. Those who borrow from banks also pay high rates of interest. First-generation entrepreneurs in this sector also find it difficult to access equity capital required for start-ups. Financial constraints compel these MSMEs to transact predominantly using cash as most of their financing comes from informal sources.[36]
Lack of a widespread merchant acceptance network in India
In India, a bulk of all transactions involves purchases of essential commodities such as food, groceries, and personal care and hygiene products. The poorest 20 percent dedicate nearly 60 percent of their income, while the top quintile, as much as 44 percent of monthly expenditure, on food.[37]The demand for necessities is catered to by the retail industry. The cost structure of firms operating in the organised retail sector compels them to cater to the richest class of consumers (top 20 percent) in order to ensure profits. Consequently, a large proportion of the consumer market relies on the unorganised sector. Players in organised retail provide digital alternatives of payment while those in the unorganised sector do not.[38]
Unorganised retail, accounting for more than 90 percent of the retail industry, includes traditional formats of retail such as local kirana shops, convenience stores, paan-beedi shops, street vendors, hawkers, chemists, footwear stores, apparel stores, among many others.[39] This sector is the second largest employer in India. It is one of the easier modes of self-employment as it requires low investments in terms of capital, land and labour.[40] In the face of unemployment, lack of skill and education, and poverty, a large number of people are compelled to enter this sector. Those operating in the unorganised retail are not profiteers; rather their businesses are survivalist or marginal activities.[41] Going digital adds significantly to their business costs and affects the viability of their business. Costs incurred in establishing and operating digital payments systems include buying devices such as smartphones, data charges, rentals on Point of Sale (POS) devices, and Merchant Discount Rates. Such costs render dealing with cash more economical and dissuade retailers from going cashless.[42]
Size of the informal economy in India
Ninety-two percent of the Indian workforce is employed in the informal economy.[43]In 2011-12, among those engaged in informal employment, 57 percent were self-employed, 33 percent were casual workers, while a small percentage of 11 percent were regular wage/salaried employees.[44] Among the self-employed, about 95 percent were own-account workers while the remaining five percent were employers.[45]
The People Research on India’s Consumer Economy (PRICE) conducted a cash survey in 2014 to identify reasons for and attitude of cash usage in India.[46] The survey was administered to 1,005 respondents who belonged to a diverse cross-section of the population from both rural and urban segments. This survey found that the primary source of cash was employment and business. It also found that a meagre seven percent of respondents owned a credit card, while 55 percent relied on both cash and debit cards for transactions. However, debit cards were mostly used for withdrawing cash. The remaining 38 percent relied on cash alone. Therefore, about 92 percent of the respondents were dependent on cash-based transactions. Among those who owned credit cards, 57 percent were regular salaried individuals and about 33percent were self-employed. The category of credit card owners did not include a single casual labourer. On the other hand, about 55 percent of those who relied exclusively on cash were unpaid household women workers and casual labourers.
Ease of doing business in India
India has made significant advances in improving ease of doing business; these strides include leveraging digital technologies. For instance, online systems have been introduced to ease procedures for starting a business and obtaining construction permits. Electronic modes are now being used for making payments to the Employees Provident Fund. Furthermore, the use of electronic and mobile platforms has made trading across borders more convenient. The government also plans to set up a single window that can process online applications for permission to acquire land, register property, among other requirements. These steps, however, are only the beginning of a long journey towards completely digitalising the business environment in India.[47]
Data protection and privacy laws in India
As India seeks to realise its ambitions of going cashless, the need to safeguard privacy and protect data becomes more of an imperative. This requires a comprehensive and stringent regime of data protection and privacy laws. Cybercrime, fraud and identity theft can erode trust, in turn derailing any country’s journey to becoming cashless. Laws that currently exist in India have limitations. For instance, these laws are confined to regulating the processing of sensitive personal data while poorly regulating issues related to personal data which may be categorized as “non-sensitive”. The issue of obtaining approval of individuals in matters relating to their personal information is currently dealt with a high degree of ambiguity. Nor is there clarity on matters of extra-territorial jurisdiction in relation to data protection and privacy.[48]
In August 2017, the Supreme Court upheld the right to privacy as a fundamental right and instructed the government to put in place a stringent and broad-based regime of data protection laws. Accordingly, the government has appointed a committee under the chairmanship of former Supreme Court judge, Justice B N Srikrishna, which is currently in the process of drafting the new laws.[49]
The ‘Digital India’ campaign
The launch of the ‘Digital India’ campaign in July 2015 reflects the government’s commitment to the principles of efficiency and transparency in governance. The following are some of the initiatives introduced under this campaign. The National e-Governance Plan aspires seamless electronic access to government services for all citizens.[50] Recognising the value of increased citizen participation in the governance of the nation, the MyGov initiative provides a common platform that brings people together to deliberate upon important issues and ideating solutions to problems.[51] A common Biometric Attendance System (BAS) has been introduced across several union government offices in Delhi and in several state and civic governments to maintain digital records of employee attendance.[52] The e-hospital application, meanwhile, digitises services in the domain of health care—for instance, online appointments and online payment of fees.[53]For its part, the National Scholarship Portal seeks to completely transform the process of disbursing scholarships with all of the stages from applying for scholarships to the final payment being digital.[54] The Pradhan Mantri Gramin Digital Saksharta Abhiyan aims at improving the level of digital literacy in rural areas.[55]
Innovation in the digital payments landscape in Ind.
The report, ‘Flavors of Fast’, published by the US-based financial services technology giant Fidelity National Information Services (FIS) used the Faster Payments Innovation Index (FPII) to evaluate the digital transactions systems across 25 countries. The parameters include 24×7 availability, the ability to accelerate adoption of digital payments, and time-effectiveness of payments settlement. The index recognised India as having the “most evolved” digital payments system among the 25 countries under evaluation. India was the only country that earned the highest possible score while competing with countries such as the UK, Sweden, Switzerland, Japan and China as well.[56]
The FPII ranks nations across five levels. The minimum criterion that nations need to satisfy to be considered for ranking is that of a fast payments system. Nations that satisfy only this criterion are ranked as level one. For instance, Taiwan was placed at level one. Nations that are assigned a level higher than one are ranked in terms of features adding to the quotient of customer value. The more the number of value added features, the higher is the rank. Nations that provide interbank, account-to-account services in less than a minute end-to-end and irrevocable payment commitments are ranked at level two—for example, China, Korea, Mexico, Brazil, Ghana, Nigeria and Iceland. Apart from having level two features, payments systems of South Africa, Bahrain, Sweden and Japan allow universal access and 24X7availability, and have ISO standard, and thus were assessed at level three. Features that are deemed as maximising customer value provide remittance information with payment, speedy settlement, push and pull payment facilities, allow assigning aliases to bank accounts, and facilitate both individual and batch payments. Spain, Kenya, Poland, Finland, UK, Singapore, Denmark and Switzerland possess some of these features and, therefore, are ranked at level four. India’s Immediate/ Interbank Mobile Payment service (IMPS) is the only payments system in the world which enjoys all of the above mentioned features, placing the country at level five.
The Immediate/ Interbank Mobile Payment service (IMPS) and the Unified Payments Interface (UPI) were launched by the National Payments Council of India (NPCI). The IMPS allows transactions 24×7 and settles payments in real time. IMPS can be used via mobile phones, internet banking, and ATMs. The UPI builds on the architecture of IMPS and has additional features compared to IMPS. UPI allows immediate transfer of funds from one bank account to another through smartphones without requiring information such as card/bank account details, the net banking password, and even the CVV number. Transactions using UPI require a two factor authentication – virtual ID and an M-PIN – making them safe. Another important feature of UPI is its interoperability: a single virtual ID can be linked to several bank accounts. Transactions using different payment systems are allowed on the UPI platform. The UPI can both make as well as request payments.
IV. Lessons from Other Countries:
Sweden
Sweden is one of the most prominent examples of a nearly cashless society. According to the Riksbank, Sweden’s central bank, cash transactions accounted for two percent of the value of all payments made in Sweden in 2015. So ubiquitous is the use of non-cash transactions that even street vendors and churches prefer card or mobile payments. Cash accounted for only 20 percent of transactions in shops in 2015. Public transport in Sweden has stopped accepting cash a long time ago. Even most of Sweden’s bank branches no longer deal in cash.[57]
Sweden’s journey to becoming cashless began in the second half of the 20th century. The digitalisation process has essentially been a laissez-faire phenomenon. The interaction between stakeholders such as banks, card operators, payment service providers, telecom operators, has been deciding the fate of the cashless payments system in Sweden.[58]
The foundation was laid in the 1960s when employers across Sweden began making wage and salary payments electronically. This meant that most Swedes would now have a bank account.[59]In order to leverage the existing electronic banking infrastructure, banks and merchants invested heavily in the card payments systems in the beginning of the 1990s.[60]The banks began charging heavily on cheque transactions as a way of discouraging them.[61]Today, about 97 percent of Swedes have access to cards.[62] Currently, use of cards represents the main form of payment mechanism in Sweden.[63]
During the mid-2000s, a steep rise in instances of armed robbery in Sweden especially targeting bus drivers prompted banks, merchants and public transport workers’ unions to mobilise against the use of cash.[64]During this period, many banks, telecommunication operators and other players gauged the prospects in developing new payment solutions and decided to invest in this vision. Firms such as Apple, Google, Paypal, and Izettle capitalised on the surging demand for cashless transaction instruments which followed the growth of e-commerce in Sweden.[65] In December 2012, Sweden saw the launch of a new mobile payment service called Swish.[66] Within four years of its launch, this service became popular with nearly half of the Swedish population adopting it. Since October 2013, street sellers have started using a Swedish local payment system known as Izettle which was primarily intended to enable small and single traders to accept card payments via an app and mini card-reader plugged into their phones.[67]
Sweden’s digitalisation process has been gradual. The Swedish model of going cashless broadly relies on consistent efforts made over time to put in place the infrastructure that is fundamental to and other structural developments that support and catalyse the process of digitalisation. Some other countries that have followed this model of progress include Australia, UK and Canada. Consider the infrastructural profile of Sweden in 2017: 84 percent of the population owned smartphones, 87 percent of the population used Internet on mobile devices, and 95 percent of all households had a broadband connection.[68] Further, a widespread network of card acceptance infrastructure provided by merchants, nearly universal bank account ownership and access to cards, the immense trust that Swedes have in their financial institutions and being home to a tech-savvy people have enabled Sweden to make ‘cashless society’ a reality.
China
In China, the share of non-cash transactions in total retail transactions has increased from 39 percent in 2010 to more than 60 percent in 2016.[69] China managed this leap in only five years with the aid of the smartphone. The smartphone penetration has gone up to 68 percent as of 2016, from 37 percent in 2013. (In contrast, smartphone penetration in India was 12 percent in 2013, increasing to 18 percent in 2016.[70]) More than half of the Chinese population had access to the internet in 2016 and more than 90 percent connected to the internet using smartphones.[71]
China’s digital payments landscape is dominated by Alipay and WeChat, with sellers and even beggars on the streets of China depending on these apps as a payment option.[72] From supporting e-commerce payments, making doctors’ appointments, booking taxi rides and movie tickets, purchasing railway tickets, utility bill payments, renting an apartment to managing investments, these mobile payments apps are rapidly emerging as the default way of life in China.[73] The significant increase in smartphone ownership can be attributed to two important facts about the Chinese economy: (1) the Chinese middle class is rapidly expanding to allow improved standard of living,[74] a trend which is reflected in the increased smartphone penetration; and (2) smartphones produced by local Chinese brands are cheap and affordable.[75]More needs to be said on the second. Most smartphones that are sold across the globe are produced in China. Top global brands such as Apple and Samsung also rely on Chinese manufacturing for the production of their handsets. The large market for smartphones in China incentivised several local brands to enter the market, and the sophisticated manufacturing and design ecosystem that was developed to cater to foreign brands was leveraged by indigenous producers. This led to a stiffly competitive market, resulting in the low prices of smartphones. Foreign brands, which invest heavily in global promotion of sales through marketing and advertisements end up selling their phones at a higher cost in China, further contributing to the popularity of local brands.[76]
Both rising incomes and affordable smartphones are outcomes of China’s rapid and robust industrialisation.[77] China has been able to translate its success in being the global manufacturing hub into the momentum needed to become less cash-reliant.
About 12 percent of the global unbanked population resides in China.[78] Of the total retail transactions, credit cards account for 13.8 percent while debit cards account for 17.3 percent. Less than half of bank account owners have debit cards.[79] Despite being faced with such low levels of financial inclusion, China has managed to make significant gains in terms of digital transactions. This is what distinguishes China’s model of digitalisation from that of countries such as Sweden. China’s model showcases how technology and digital innovation can allow faster ways of disrupting the use of cash. Until now, global experience has demonstrated that countries that have become nearly cashless fare well vis-à-vis all of the structural parameters enumerated in section two.
V. India’s Digitalisation Story
This section examines data to discern how the digital payments landscape of India has evolved over time. The data used are from April 2013 to October 2016 (pre-demonetisation) and are related to cashless transactions via Real Time Gross Settlement (RTGS), National Electronic Funds Transfer (NEFT), IMPS, National Automated Clearing House (NACH), Cheque Truncation System (CTS), mobile wallets, prepaid instruments, and debit and credit cards.
The first observation that needs to be made is about the growth in the volume of cashless transactions between April 2013 and October 2016. The total volume of such transactions stood at 175.01 million at the end of April 2013 (See table 1).[80] Given that around 30 billion transactions are estimated to be conducted in a month in India,[81] the percentage of cashless transactions was a negligible 0.6 percent. As of October 2016, shortly before demonetisation was announced, the total number of cashless transactions rose to 792.05 million,[82]or a measly 2.6 percent of total transactions – implying that India was at stage I in the cashless journey.
The next part of this analysis views the data on total cashless transactions as a time-series process. The process is decomposed to isolate the long-term trend of cashless transactions by eliminating seasonal components and random influences. The trend for individual components is also determined to assess their contribution to the movement of the aggregate figure. Since the methodology used in this exercise does not estimate the trend for the first six and the last six observations, the trend is calculated from October 2013 to April 2016 (See table 2).
The data series on total cashless transactions exhibit an upward linear trend, implying that cashless transactions have been increasing at a constant rate on a month-on-month basis (See figure 1).[83] No systematic shift or break has occurred to disrupt the trajectory of this linear growth path. The Compound Monthly Growth Rate (CMGR) is calculated to find that digital transactions, on average, have been growing at 3.5 percent per month between 2013 and 2016.
Payment instruments that have large contributions to increments in cashless transactions are NACH (30 percent), NEFT (15 percent), debit card transactions at POS terminals (15 percent), and M-Wallets (12 percent).
NACH system has been developed to facilitate high volume, recurrent transactions in a manner that is both more efficient and convenient for the stakeholders. This system is being used by banks, government agencies, business entities and financial institutions to make payments such as salaries, interests, pensions, dividends and subsidies. The system is also being used for payments for utilities such as water, telephone, electricity, as well as for payments such as taxes, investments in mutual funds, insurance premiums, and loan repayment installments.[84]
NEFT, meanwhile, is a popular mode for making one-to-one fund remittances. Given that these transfers are the routed through the banking system, they can be traced easily in the event of some error or anomaly during the transfer. This feature makes such transfers safe. Also, the consumer is not required to have a bank account to initiate such transfers. It is also an economical transfer option. For their part, M-wallets have been increasingly used for mobile recharges and making utility bill payments. Apart from these primary use-cases, m-wallets have integrated with e-commerce websites and taxi aggregators to facilitate easy and convenient payment experience. These wallets are also being used to make online bookings for movie as well as railway and flight tickets. A significant share of the success enjoyed by these wallets owes to the cashbacks, discounts and deals being offered by them to lure customers; to the extent that it is questioned whether this usage will continue without such incentives being offered.[85] The offering of Value Added Services (VAS) mentioned earlier has also played a compelling role in the uptake of mobile wallets in India.
The demonetisation shock
In a move that stunned the nation, Prime Minister Narendra Modi demonetised the INR 500 and INR 1,000 notes that formed the bulk of the cash circulating in the economy. This move, initially projected as an offensive against black money and corruption, came to be viewed as the government nudging cash-reliant Indians to go digital. In this sense, demonetisation gave an unexpected fillip to the ‘Cashless India’ campaign. The strategy pursued under the aegis of this campaign was three-pronged: (i) measures that incentivise cashless payments; (ii) measures that subsidise cashless payments and (iii) measures aimed at – moral suasion and awareness creation. These three aspects will be discussed in turn.
Measures that incentivise cashless payments include discounts and cashback schemes. Some such discount schemes were as follows: 0.75 percent discount of the sale price on purchases of petrol and diesel; 0.5 percent discount on purchase of railway monthly or seasonal tickets; five percent discount on payments of services such as catering, accommodation, retiring rooms offered by the railways; and 10 percent discount on the payment of toll at Toll Plazas on National Highways.[86]
The following are some of the measures that were launched to subsidise the costs associated with cashless transactions: Public sector undertakings were instructed to bear the transaction fee or Merchant Discount Rate (MDR) associated with digital means that would otherwise be borne by consumers. In order to reduce the costs of POS devices, such devices and all components needed to manufacture these devices were exempted from central excise duty. The central government, through National Bank of Agriculture and Rural Development (NABARD) provided financial assistance to banks for installing POS devices in rural areas. Digital transactions up to INR 2,000 were exempted from service tax. Banks were asked to waive off any charges on transactions up to INR 1,000 through IMPS, Unstructured Supplementary Service Data (USSD) – used for GSM-enabled mobile phones, and UPI. Upper limits on the MDR on card transactions were also announced to encourage acceptance of cards at merchant outlets.[87]
The narrative built around the adoption of digital payment mechanisms was anchored in nationalist sentiments and projected such adoption as an “honest man’s duty” to fight corruption. Banks were requested to initiate efforts to boost digital transactions and make them cheaper than cash transactions. They were also requested to not levy charges on merchants and consumers for debit card, USSD and UPI transactions. The government also launched lottery schemes such as the Lucky Grahak Yojana and the Digi-Dhan Yojana to encourage the uptake of digital payments. The Digi-Dhan Mela, a first of its kind consumer fair, was organised to create awareness about the merits of cashless transactions and to educate the masses on how to use non-cash instruments such as plastic money and mobile payments to conduct daily transactions.[88]
The data on total cashless transactions for the period from April 2013 to December 2017 exhibits a decisive upward shift in December 2016, the month immediately after demonetisation was announced (See figure 2). This upward shift represents the disruption that occurred post-demonetisation in the trajectory followed by cashless transactions pre-demonetisation. With about 86 percent of cash in circulation no longer regarded as legal tender, citizens were compelled to search for alternatives. However, the uptake of digital means that occurred in these circumstances could well be a temporary reaction to a temporary phenomenon. If the upward spike is purely due to demonetisation, its reversal may have been expected after March 2017, when all restrictions on cash withdrawals and transactions were lifted. Figure 2 indicates a partial reversal, while the trajectory of cashless transactions absorbed a part of the upward shift observed in December 2016.
The following are the payment mechanisms that have absorbed the shift in their behaviour. The major sources of the spike in cashless transactions in December 2016 were NEFT (10 percent), NACH (11 percent), M-Wallets (17 percent), and debit card transactions at POS terminals (40 percent). Figures 3and 4 reveal that the behaviour of transactions made using NACH and NEFT immediately recovered from the disruption in December 2016 to revert to the trajectory followed before demonetisation. It is evident from figures 5 and 6 that trajectories followed by transactions using debit card at POS terminals and M-Wallets have retained the impact of the upward shift. These findings are consistent with the fact that incentives and subsidies to boost digital transactions under the ‘Cashless India’ campaign were mostly directed at mobile wallets and debit card transactions at POS terminals.
Launched in April 2016, the UPI has become popular for its convenience and speed of transactions. UPI transactions have registered an increase in every month post-demonetisation. However, since September 2017, the rate of increase has been phenomenal and UPI has been one of the largest contributors to increases in cashless transactions (See figure 7 and table 3).
Despite such disruptive measures, India continues to remain at stage I in its journey to being cashless. The total number of cashless transactions in December 2017 was 1.2 billion—i.e., four percent of total retail transactions, registering a marginal increase from 2.6 percent in October 2016. Even post-demonetisation, 96 percent of the total volume of transactions uses cash as the sole instrument of exchange.
VI. The Way Forward
This paper has thrown light on where India stands in its journey towards becoming “cashless”. This section identifies specific strategies that will lead the country closer to being a cashless economy.
Measures in the short run
Cash has been the traditional instrument of transaction in India since Independence and any move towards going cashless will entail a paradigm shift. A host of measures have been launched in the short run to deal with this barrier. For example, service providers operating in the digital payments landscape have relied significantly on discounts, cashbacks and other such offers to get around the proclivity of cash use. This is particularly true of mobile wallets and UPI in India.[89] Initiatives under the ‘Cashless India’ campaign are also doing well in this direction. Also, the campaign involves several measures that have subsidised the cost of using digital payments instruments, making them affordable. Although the above mentioned initiatives have yielded positive results, there is doubt whether the momentum of use of digital payments will remain once these cashbacks, discounts and subsidies are rolled back.
In this scenario, the option of intelligent and powerful advertising for promoting cashless payments and awareness campaigns about the costs and inconvenience of operating a cash-based payments system appear as effective alternatives.
As previously mentioned, the adoption of mobile wallets has gained significantly from the offering of VAS such as mobile recharges, utility bill payments, ticket booking, obtaining loans, and purchasing gold.[90]Studies have also recorded the positive impact of VAS such as: electronic receipts, pre-ordering products, and access to deals. An example of VAS which not only allows convenience and speed, but also allows managing money is to digitise loyalty and gift cards, and discount coupons, and manage them on a single platform so that consumers can choose their preferred payment mix of credit points, coupons and money.[91]
Long-term strategies
Short-run measures, however successful, can only bring small increments to the process of digitalisation. This is India’s experience. Becoming cashless represents a paradigmatic shift andrequires certain structural parameters in place. These structural parameters are the object of long-term policy-making.
India is emerging as a large potential market for digital transactions. To unlock this potential, India has to address its structural deficiencies. For example, NACH is currently catering to the demand of a very small formal sector in India. The formalisation of India’s informal economy will make NACH ubiquitous. Financial inclusion, increased smartphone ownership supported by rising incomes, and improved digital infrastructure will boost usage of UPI, M-Wallets, and debit and credit card transactions in India.
Digitalising India’s Industrialisation:
India’s story of industrialisation has been disappointing and explains the impediments to job creation, rising incomes and urbanisation. As an attempt to correct this situation, the ‘Make in India’ campaign was launched to transform India into a global manufacturing hub, while creating gainful employment opportunities in the country.
As of 2016-17, after three years since the launch of this campaign, the contribution of the manufacturing sector to the country’s GDP has remained at 16 percent, which has been the same for two and a half decades.[92] The fact that about one million enter the labour market every month, the creation of only 6,41,000 jobs between 2014 and December 2016 leaves much to be desired.[93]
Yet, it must be acknowledged that much has been done under the aegis of the ‘Make in India’ campaign to create a favourable business environment in the country. Increased investments in public transportation systems, labour and power sector reforms, the GST reform are some examples. The impact of these measures is reflected in India’s improved score on the Logistics Performance Index 2016 and the Ease of Doing Business Index 2018, both published by the World Bank.[94] It is expected that these improvements will translate into more jobs and more industrial output in the near future.
This paper proposes complete digitalisation of the business environment and enterprise in the country. The idea is to create a digital infrastructural framework that supports all business activities such as borrowing credit, creating a digital market, digital promotion of products, purchase raw materials online, and making factor payments such as salaries and wages online.[95]This strategy can be expected to give such direction to India’s fourth Industrial Revolution as to not only yield higher economic growth and development, but also correct structural weakness viz. financial exclusion, a predominant informal sector and unproductive, loss making MSMEs, in a manner and at a pace that is going to be unprecedented. This strategy can be bifurcated into the following measures:
- The lack of formal credit sources for MSMEs can be attributed to the disparity between what banks offer and what MSMEs need. Banks fail to cater to this section because they are rigid about their requirement for collateral. Also, banks perceive MSMEs as high-risk, costly and poor-quality credit assets. The long-drawn, complex process of applying for loans and the time taken to process this application and finally approve it as well as high interest rates discourage MSMEs to approach banks.[96]The contemporary fin-tech revolution, a global phenomenon, is unequivocally being seen as having the potential to create financial solutions that can cater to the needs of the unbanked and under-served population and thereby bring the country closer to the reality of universal financial inclusion. Fin-tech companies can do well in filling the void that has long existed in the MSME credit landscape by providing digital loans. The process of determining credit worthiness adopted by these companies diverges significantly from its conventional counterpart. This process uses information extracted from analysing the activity on social networking and e-commerce sites, call records and transaction records, regularity of paying utility bills, among others, to estimate the size of income and professional network, and the willingness to pay of the potential borrower. Administering of questionnaires to collect psychometric data that allows reliable prediction of repayment behaviour is another innovation introduced in appraising credit worthiness. This process is also flexible in that the inability to provide formal account statements or some other document required conventionally does not always entail rejection. Alternate sources of information are perused to compensate for unavailability of such documents. Nevertheless, the risk assessments are sound and well-calculated ruling out threats to survival in the market.[97]These companies have also used technology to introduce an easy and time-effective credit disbursal process. These firms are also willing to offer collateral free loans.[98]Yet, prospective lenders to MSMEs face challenges inherent to the characteristics of the sector. One such characteristic is the heterogeneity of operational and business frameworks adopted by players in this sector. Financial products that work well in the case of retail stores might fail in the case of small restaurants. Lending to SMEs will more likely involve disbursing small-ticket loans making viability and profitability difficult propositions.[99]Introducing regulatory sandboxes in the fin-tech domain in India can create the space in which players can innovate to derive solutions to the above mentioned challenges without compromising on consumer protection and risk mitigation. This initiative will also help generate insights into effective regulation that does not obstruct innovation and is justifiably necessary.[100]It must be mentioned in this context, that the recent regulations announced by the RBI on peer-to-peer (P2P) lending impose barriers to innovation, thereby eroding the ability of fin-tech firms to improve financial inclusion.[101]In the initial phase of starting a business, the inability to produce certain documents must not vitiate the chances of a talented entrepreneur being financed. However, the financial regulators must insist that, once established, the process for accessing credit must necessitate the need to maintain digital books of account, digital records of various transactions, purchases and sales, and payments made towards operating costs and logistics.It is incumbent on the government to leverage this fin-tech revolution and help these companies achieve broader coverage of the rural and remote areas of the nation. It must strengthen the network of basic as well as digital infrastructure in the country.
- O2Onow is an offline store aggregator which seeks to provide mutually beneficial solutions for consumers and kirana stores by leveraging internet connectivity and digital innovation. Driven by the objective of building a digital ecosystem for small-scale retailers, the O2O platform engages in digital promotions and advertising for its clients and helps them reach a wider base of customers, which would not be possible offline, resulting in greater sales and more profits. Consumers can compare offers and deals across local stores in their immediate geography and choose that which best suits their needs. They can also shop online avoiding the inconvenience of visiting the physical store.[102] The government needs to support such ventures in order to replicate this model across the nation. It must use this platform for encouraging the adoption of digital modes of transactions.
- The government must also draw its attention to the gains that can follow from providing financial and logistical assistance to businesses required to operate on existing e-commerce websites and launching an e-commerce website for entrepreneurs in cases where none exists. This recommendation is motivated by the findings of the 2017 report titled ‘Impact of internet and digitisation on SMBs in India’, published by KPMG and Google – MSMEs that operate online increase their revenue and profit twice as fast as those operating offline. Online players serve a wider base of customers located beyond their city than offline players. Online businesses generate many more jobs than their offline counterparts.[103]The fee structure adopted by the proposed e-commerce website must be progressive in nature. Businesses incurring losses and finding it difficult to break even can be financially relieved by waiving their dues. Once businesses enter the phase of making profits, they must begin paying for services enjoyed on the e-commerce platform. All of the business units that register on this site must be required to completely digitise their business operations.
Addressing skill deficit and illiteracy in India:
Lack of skills and a mismatch between skills acquired and those required are responsible for unemployment and informal employment in India. According to the Report on the Fifth Employment-Unemployment Survey (2015-16),[104] 58.3 percent of unemployed graduates and 62.4 percent of unemployed postgraduates attributed their unemployment to the lack of jobs matching their education and skill. The ‘Skill India’ campaign was launched to address this challenge. The flagship skill development programme has been motivated by the twin goals of providing employment and meeting the demand of the industry. The rationale underlying this programme emphasises on mapping the skill requirements of the industry and assessing the mismatch between skills demanded and those supplied in order to prepare the roadmap for implementation. This roadmap is to guide decision making on several pertinent issues, for example, who will train, how to train the trainer, issues relating to assessment and certification, and affiliation of training institutions.[105]
Since huge physical targets translate into larger financial disbursements, focus has been skewed in the direction of meeting targets in quantitative terms accompanied by a serious compromise on quality. As a result, the skill development programme is churning out a large number of trained youth who do not have the competence required to be employed. Hence, the rate of placement of those trained under this programme has been as low as 8.5 percent. Rather than resolve the problem it was meant to, the skill development campaign has only worsened it.[106]
Introducing financial and digital literacy into the curriculum of primary school education can bolster the pace of digitalisation in the long run. Such initiatives as well as the ‘Skill India’ campaign bring individuals closer to digital payments. However, the country must think of bringing digital payments to the doorstep of the citizens. One way of doing this is to make digital payments instruments available in regional languages as well. In fact, India must aspire to make the UPI, the most popular and interoperable payment option, available in all regional languages.
VII. Conclusion
This paper makes the case that any form of progress and development in a given system that aspires to reach its pinnacle cannot bypass core structural deficiencies of that system. This holds true in the context of digitalisation of transactions. There are no shortcuts to becoming cashless. This is even true of China which has been able to make considerable progress in its cashless journey despite high rates of financial exclusion. The rate at which cash is becoming irrelevant in this economy, banks and other financial institutions will have to consider reconfiguring their business processes and functioning with the smartphone being the point of reference. This will allow digitalisation of transactions involved in financial intermediation. Even the recommendations made by this paper presume a strong presence and broad coverage of basic and digital infrastructure. The strategy directed towards “Cashless India”, to be successful, must prioritise investing in correcting structural anomalies over other measures.
ANNEXURE:
Table 1: The total volume of cashless transactions from April 2013 to December 2017
| MONTH /YEAR |
RTGS |
CTS |
NEFT |
IMPS |
NACH |
CCPOS |
DCPOS |
MWALLET |
PPICARDS |
TOTAL |
| APR 2013 |
6.46 |
35.82 |
40.66 |
0.27 |
0.14 |
37.74 |
45.29 |
6.63 |
2 |
175.01 |
| MAY 2013 |
6.69 |
36.15 |
45.06 |
0.38 |
0.46 |
40.28 |
47.49 |
7.01 |
2.13 |
185.65 |
| JUN 2013 |
6.14 |
34.31 |
43.19 |
0.47 |
1.04 |
36.8 |
47.64 |
7.01 |
1.99 |
178.6 |
| JUL 2013 |
6.58 |
40.34 |
50.42 |
0.65 |
2.78 |
44.19 |
52.16 |
7.94 |
2.1 |
207.16 |
| AUG 2013 |
6.21 |
38.89 |
47.62 |
0.79 |
2.62 |
43.15 |
55.2 |
8.68 |
2.18 |
205.32 |
| SEPT 2013 |
6.26 |
40.98 |
51.25 |
1.02 |
4.63 |
41.81 |
53.15 |
8.74 |
2.03 |
209.86 |
| OCT 2013 |
6.95 |
51.26 |
56.91 |
1.22 |
7.48 |
45.13 |
54.52 |
8.14 |
2.17 |
233.79 |
| NOV 2013 |
6.38 |
49.82 |
52.65 |
1.38 |
9.73 |
41.84 |
51.62 |
7.46 |
2.15 |
223.02 |
| DEC 2013 |
7.02 |
58.81 |
60.36 |
1.93 |
11.49 |
45.64 |
52.3 |
8.58 |
2.16 |
248.28 |
| JAN 2014 |
7.13 |
66.76 |
65.91 |
2.03 |
17.18 |
45.58 |
53.83 |
11.27 |
2.15 |
271.84 |
| FEB 2014 |
6.65 |
65.28 |
64.15 |
2.23 |
20.77 |
40.81 |
48.9 |
11.99 |
2.08 |
262.85 |
| MAR 2014 |
8.64 |
72.97 |
82.83 |
3 |
8.18 |
46.11 |
56.98 |
14.07 |
2.45 |
295.23 |
| APR 2014 |
7.27 |
73.54 |
70.62 |
3.11 |
4.75 |
46.44 |
56.27 |
13.07 |
2.61 |
277.68 |
| MAY 2014 |
7.8 |
78.26 |
69.11 |
3.3 |
5.24 |
47.24 |
59.22 |
13.57 |
2.64 |
286.37 |
| JUN 2014 |
7.47 |
75.64 |
67.86 |
3.71 |
6.38 |
48.26 |
59.56 |
13.71 |
2.82 |
285.41 |
| JUL 2014 |
7.55 |
84.69 |
71.67 |
4.26 |
9.11 |
50.92 |
64.64 |
15.52 |
3.15 |
311.51 |
| AUG 2014 |
6.97 |
79.42 |
66.98 |
4.8 |
10.11 |
50.53 |
67.62 |
16.58 |
3.38 |
306.38 |
| SEPT 2014 |
7.72 |
85.63 |
88 |
5.8 |
15.04 |
50.17 |
64.9 |
18.77 |
4.02 |
340.03 |
| OCT 2014 |
7.21 |
79.63 |
73.29 |
6.51 |
8.01 |
54.58 |
73.69 |
21.39 |
9.65 |
333.96 |
| NOV 2014 |
7.36 |
77.96 |
69.12 |
7.09 |
7.82 |
48.27 |
70.1 |
21.38 |
4.95 |
314.05 |
| DEC 2014 |
8.19 |
84.4 |
83.49 |
8.38 |
14.35 |
56.09 |
73.62 |
23.19 |
5.74 |
357.45 |
| JAN 2015 |
7.89 |
80.51 |
80.22 |
9.33 |
73.87 |
56.17 |
74.46 |
27.62 |
5.82 |
415.91 |
| FEB 2015 |
7.69 |
76.65 |
81.19 |
10.08 |
90.27 |
49.55 |
67.9 |
24.08 |
6.19 |
413.6 |
| MAR 2015 |
9.67 |
88.54 |
106 |
12.02 |
95.21 |
56.91 |
76.11 |
46.11 |
7.94 |
498.5 |
| APR 2015 |
7.9 |
80.91 |
83.53 |
12.37 |
90.96 |
57.31 |
80.35 |
67.05 |
7.26 |
487.64 |
| MAY 2015 |
8.06 |
77.84 |
88.13 |
13.32 |
94.52 |
60.13 |
88.97 |
39.95 |
6.93 |
477.84 |
| JUN 2015 |
8.26 |
79.35 |
91.22 |
13.82 |
100.44 |
62.2 |
86.63 |
47.31 |
8.06 |
497.29 |
| JUL 2015 |
8.25 |
83.89 |
103.11 |
15.6 |
103.43 |
64.79 |
94.97 |
53.6 |
10.89 |
538.52 |
| AUG 2015 |
7.82 |
78.85 |
95.94 |
16.65 |
111.49 |
65.52 |
96.74 |
42.84 |
10.07 |
525.93 |
| SEPT 2015 |
7.77 |
77.88 |
98.54 |
17.72 |
105.81 |
62.42 |
90.02 |
48.94 |
9.01 |
518.11 |
| OCT 2015 |
8.34 |
82.97 |
114.6 |
19.42 |
110.7 |
68.92 |
100.43 |
49.58 |
12.2 |
567.16 |
| NOV 2015 |
7.6 |
70.81 |
99.82 |
19.08 |
116.59 |
66.04 |
99.57 |
49.83 |
12.78 |
542.13 |
| DEC 2015 |
8.03 |
82.07 |
119.61 |
20.52 |
125.56 |
69.37 |
108.12 |
53.7 |
14.93 |
601.9 |
| JAN 2016 |
8.22 |
77.58 |
118.97 |
22.48 |
132.5 |
69.68 |
109.88 |
48.74 |
16.46 |
604.5 |
| FEB 2016 |
8.23 |
78.01 |
110.17 |
23.86 |
151.82 |
67.07 |
105.07 |
49.02 |
16.31 |
609.55 |
| MAR 2016 |
9.87 |
88.24 |
129.24 |
25.98 |
160.26 |
72.22 |
112.87 |
53.44 |
18.56 |
670.66 |
| MONTH /YEAR |
RTGS |
CTS |
NEFT |
IMPS |
NACH |
CCPOS |
DCPOS |
MWALLET |
PPICARDS |
TOTAL |
| APR 2016 |
8.33 |
78.95 |
111.84 |
26.78 |
174.85 |
72.83 |
118.28 |
48.76 |
20.49 |
661.11 |
| MAY 2016 |
8.71 |
77.24 |
117.5 |
27.66 |
160.59 |
78.48 |
133.97 |
50.31 |
20.6 |
675.06 |
| JUN 2016 |
8.83 |
78.64 |
118.91 |
29.68 |
166.5 |
76.31 |
118.2 |
58.63 |
18.29 |
673.99 |
| JUL 2016 |
8.26 |
79.24 |
113.48 |
32.18 |
189.6 |
79.44 |
129.07 |
59.45 |
18.35 |
709.07 |
| AUG 2016 |
8.56 |
81.62 |
118.55 |
33.89 |
153.33 |
83.95 |
130.53 |
70.68 |
25.56 |
706.67 |
| SEPT20 16 |
8.47 |
78.94 |
120.15 |
35.93 |
157.29 |
77.93 |
125.19 |
75.3 |
21.72 |
700.92 |
| OCT 2016 |
9.01 |
82.04 |
133.21 |
42.09 |
169.39 |
88.86 |
140.59 |
99.57 |
27.29 |
792.05 |
| NOV 2016 |
7.88 |
87.08 |
123.05 |
36.17 |
161.11 |
97.91 |
236.47 |
138.09 |
31.19 |
918.94 |
| DEC 2016 |
8.84 |
130.01 |
166.31 |
52.78 |
208.05 |
116.08 |
415.46 |
213.11 |
47.93 |
1358.58 |
| JAN 2017 |
9.33 |
118.45 |
164.19 |
62.42 |
166.82 |
112.8 |
328.62 |
261.67 |
34.08 |
1258.39 |
| FEB 2017 |
9.11 |
100.44 |
148.21 |
59.75 |
158.71 |
94.93 |
251.75 |
246.95 |
33.03 |
1102.86 |
| MAR 2017 |
12.54 |
119.21 |
186.7 |
67.41 |
191.01 |
107.61 |
271.17 |
307.45 |
34.58 |
1297.69 |
| APR 2017 |
9.54 |
95.26 |
143.17 |
65.08 |
222.17 |
106.58 |
268 |
320.87 |
31.32 |
1261.99 |
| MAY 2017 |
10.43 |
97.08 |
155.82 |
66.72 |
204.03 |
115.33 |
264.72 |
241.72 |
36.32 |
1192.17 |
| JUN 2017 |
9.83 |
91.85 |
152.34 |
65.84 |
207.79 |
109.47 |
254.66 |
221.63 |
33.97 |
1147.4 |
| JUL 2017 |
9.38 |
92.2 |
148.14 |
69.07 |
214.42 |
110.76 |
255.62 |
235.46 |
34.74 |
1169.8 |
| AUG 2017 |
9.46 |
92.05 |
151.61 |
75.66 |
214.77 |
115.33 |
265.45 |
225.43 |
35.67 |
1185.42 |
| SEPT 2017 |
9.61 |
92.16 |
157.67 |
82.85 |
186.58 |
112.63 |
265.3 |
199.48 |
40.76 |
1147.04 |
| OCT 2017 |
10 |
94.44 |
158.78 |
88.12 |
197.09 |
123.36 |
278.4 |
201.23 |
43.91 |
1195.33 |
| NOV 2017 |
10.83 |
96.3 |
161.97 |
89.49 |
207.97 |
115.9 |
270.96 |
186.67 |
49.45 |
1189.54 |
| DEC2017 |
10.9 |
94.57 |
169.05 |
98.01 |
202.26 |
123.71 |
290.35 |
288.37 |
31.44 |
1086.94 |
Source: RBI (DATA BASE ON INDIAN ECONOMY)
| TOTAL: |
Total number of digital transactions |
| RTGS: |
Real time gross settlement |
| NEFT: |
National electronic funds transfer |
| CTS: |
Cheque truncation system |
| IMPS: |
Immediate payment service |
| NACH: |
National automated clearing house |
| CC POS: |
Credit card transactions at Point of sale |
| DC POS: |
Debit card transactions at Point of sale |
| PPI: |
Debit card transactions at Point of sale |
| M WALLETS: |
Mobile Wallets |
Table 2: The trend characterising total volume of cashless transactions as well as individual payment instruments from October 2013 to April 2016
MONTH/
YEAR |
RTGS |
CTS |
NEFT |
IMPS |
NACH |
DCPOS |
CCPOS |
MWALLETS |
PPI |
TOTAL |
| OCT 2013 |
6.792917 |
50.85417 |
56.3325 |
1.399167 |
7.400417 |
52.0475 |
42.78583 |
9.228333 |
2.157917 |
228.9954 |
| NOV 2013 |
6.872917 |
54.18042 |
58.58292 |
1.639167 |
7.791667 |
52.99375 |
43.43833 |
9.77 |
2.204583 |
237.47 |
| DEC 2013 |
6.974583 |
57.65708 |
60.61292 |
1.895833 |
8.213333 |
53.97917 |
44.20583 |
10.3225 |
2.260417 |
246.1171 |
| JAN 2014 |
7.070417 |
61.22708 |
62.52625 |
2.18125 |
8.699583 |
54.99583 |
44.96375 |
10.9175 |
2.33875 |
254.9154 |
| FEB 2014 |
7.1425 |
64.76375 |
64.21833 |
2.49875 |
9.275417 |
56.03333 |
45.55167 |
11.5625 |
2.4325 |
263.4742 |
| MAR 2014 |
7.235 |
68.31292 |
66.55625 |
2.865 |
10.02125 |
57.04042 |
46.2075 |
12.30958 |
2.565417 |
273.1087 |
| APR 2014 |
7.306667 |
71.35542 |
68.77 |
3.284583 |
10.47708 |
58.32875 |
46.94958 |
13.27958 |
2.96 |
282.7062 |
| MAY 2014 |
7.358333 |
73.71 |
70.13875 |
3.742917 |
10.41958 |
59.8975 |
47.61125 |
14.41167 |
3.388333 |
290.6729 |
| JUN 2014 |
7.447917 |
75.94875 |
71.78875 |
4.249583 |
10.45917 |
61.55583 |
48.31458 |
15.60042 |
3.654167 |
299.0146 |
| JUL 2014 |
7.528333 |
77.58792 |
73.34875 |
4.8225 |
12.94042 |
63.30375 |
49.19125 |
16.89042 |
3.95625 |
309.5663 |
| AUG 2014 |
7.603333 |
78.63458 |
74.655 |
5.45375 |
18.19833 |
64.955 |
49.99667 |
18.07542 |
4.280417 |
321.8504 |
| SEPT 2014 |
7.689583 |
79.75708 |
76.33042 |
6.156667 |
24.72042 |
66.54375 |
50.81083 |
19.91417 |
4.680417 |
336.6012 |
| OCT 2014 |
7.75875 |
80.71292 |
77.83375 |
6.918333 |
31.93875 |
68.34417 |
51.71375 |
23.49833 |
5.102917 |
353.8192 |
| NOV 2014 |
7.795833 |
81.0025 |
79.16417 |
7.721667 |
39.25083 |
70.58708 |
52.70375 |
26.84667 |
5.475417 |
370.5454 |
| DEC 2014 |
7.839583 |
81.13958 |
80.93 |
8.560417 |
46.89 |
72.95458 |
53.82167 |
29.34583 |
5.8725 |
387.3517 |
| JAN 2015 |
7.901667 |
81.26083 |
83.21333 |
9.454167 |
54.73917 |
75.34625 |
54.98042 |
32.3325 |
6.413333 |
405.6387 |
| FEB 2015 |
7.96625 |
81.20375 |
85.73 |
10.42042 |
62.89333 |
77.82333 |
56.18292 |
35.01333 |
7.014583 |
424.2454 |
| MAR 2015 |
8.00375 |
80.85708 |
87.37583 |
11.41083 |
70.89958 |
80.08333 |
57.31792 |
37.36458 |
7.50125 |
440.8133 |
| APR 2015 |
8.052917 |
80.67333 |
89.53625 |
12.44542 |
78.96042 |
82.24417 |
58.42583 |
39.79625 |
7.815417 |
457.95 |
| MAY 2015 |
8.11 |
80.51458 |
92.53667 |
13.48292 |
87.77125 |
84.58625 |
59.76375 |
42.15625 |
8.247917 |
477.17 |
| JUN 2015 |
8.113333 |
80.11958 |
95.32083 |
14.48833 |
96.93708 |
87.25167 |
61.0575 |
44.61292 |
8.957083 |
496.8588 |
| JUL 2015 |
8.120417 |
79.90042 |
98.44042 |
15.54208 |
104.0138 |
90.165 |
62.17375 |
46.76417 |
9.783333 |
514.9021 |
| AUG 2015 |
8.156667 |
79.835 |
101.2625 |
16.66417 |
109.0213 |
93.18958 |
63.46667 |
48.68333 |
10.64833 |
530.9246 |
| SEPT 2015 |
8.1875 |
79.87917 |
103.4383 |
17.82 |
114.2963 |
96.27 |
64.83458 |
50.02792 |
11.5125 |
546.2625 |
| OCT 2015 |
8.21375 |
79.785 |
105.5863 |
19.00208 |
120.5021 |
99.38208 |
66.11917 |
49.57125 |
12.50625 |
560.6637 |
| NOV 2015 |
8.25875 |
79.67833 |
107.9896 |
20.2 |
126.7504 |
102.8375 |
67.53042 |
49.24083 |
13.62708 |
576.1092 |
| DEC 2015 |
8.309583 |
79.62375 |
110.3671 |
21.45833 |
132.2558 |
106.0279 |
68.88292 |
50.14417 |
14.62292 |
591.6892 |
| JAN 2016 |
8.33375 |
79.40042 |
111.9529 |
22.81 |
138.5988 |
108.7642 |
70.08125 |
50.85958 |
15.36 |
606.1579 |
| FEB 2016 |
8.365 |
79.32208 |
113.3271 |
24.21917 |
143.9325 |
111.5929 |
71.45958 |
52.26333 |
16.31625 |
620.795 |
| MAR 2016 |
8.425 |
79.48167 |
115.1696 |
25.69625 |
147.8208 |
114.4663 |
72.87375 |
54.52167 |
17.49125 |
635.9429 |
| APR 2016 |
8.482083 |
79.48708 |
116.8454 |
27.39958 |
152.4113 |
117.605 |
74.35083 |
57.70292 |
18.64958 |
652.9304 |
Source: Compiled by the author from by applying the technique of time-series decomposition to the data series of RTGC,NEFT, NACH, IMPS,CTS, M-Wallets, prepaid instruments, debit and credit card transactions at POS.
Table 3: The trend characterising total volume of cashless transactions using UPI from December 2016 to February 2018
| YEAR/MONTH |
VOLUME
OF TRANSACTIONS
(IN MILLIONS)
|
| DEC 2016 |
2 |
| JAN 2017 |
4.2 |
| FEB 2017 |
4.2 |
| MAR 2017 |
6.2 |
| APR 2017 |
6.9 |
| MAY 2017 |
9.2 |
| JUN 2017 |
10.2 |
| JUL 2017 |
11.4 |
| AUG 2017 |
16.6 |
| SEPT 2017 |
30.8 |
| OCT 2017 |
76.8 |
| NOV 2017 |
104.8 |
| DEC2017 |
145.5 |
| JAN2018 |
151.7 |
| FEB2018 |
171.2 |
Source: RBI
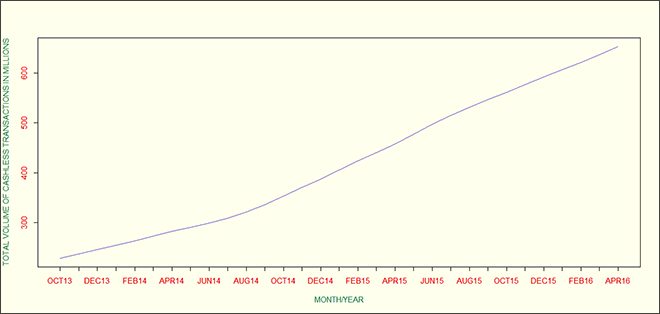
Figure 1: The trend followed by cashless transactions in India before demonetisation from October 2013 to April 2016
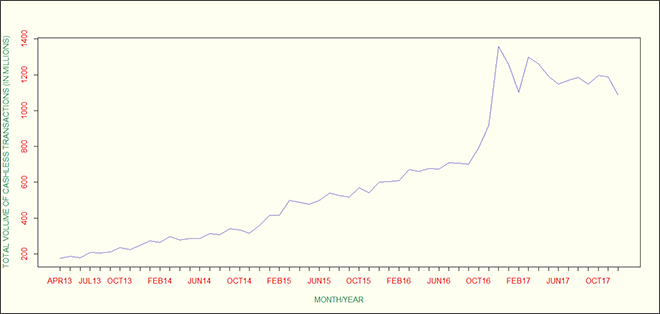
Figure 2: The total volume of cashless transactions from April 2013 to December 2017
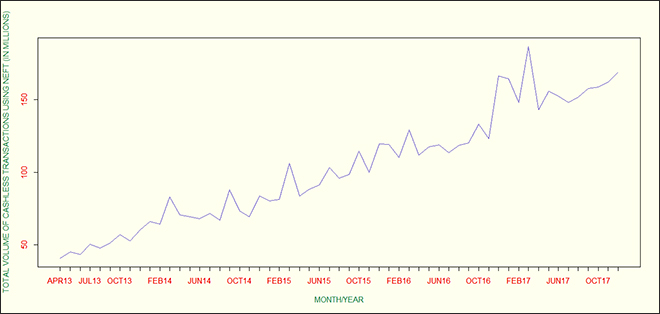
Figure 3: The total volume of cashless transactions using NEFT from April 2013 to December 2017
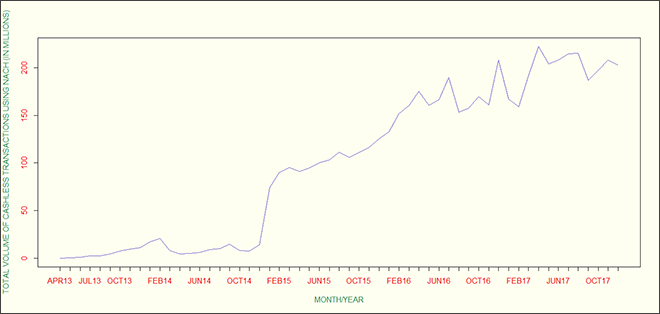
Figure 4: The total volume of cashless transactions using NACH from April 2013 to December 2017
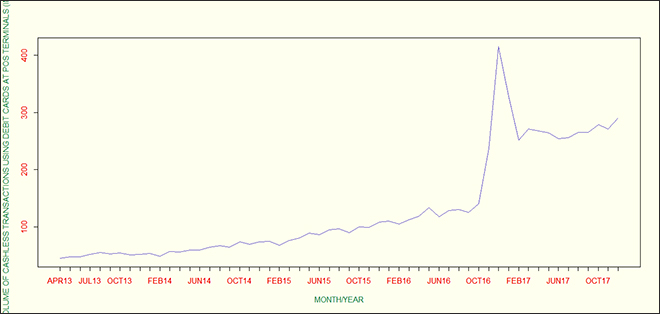
Figure 5: The total volume of cashless transactions using debit cards at POS terminals from April 2013 to December 2017
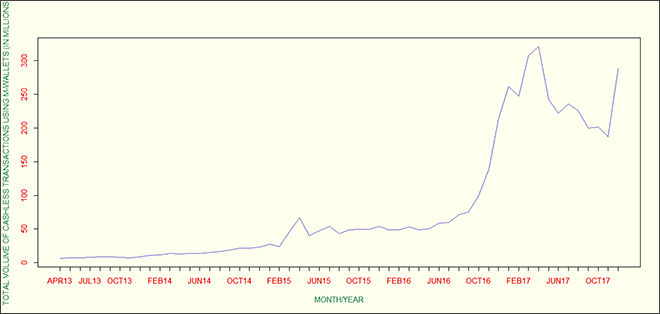
Figure 6: The total volume of cashless transactions using M-WALLETS from April 2013 to December 2017
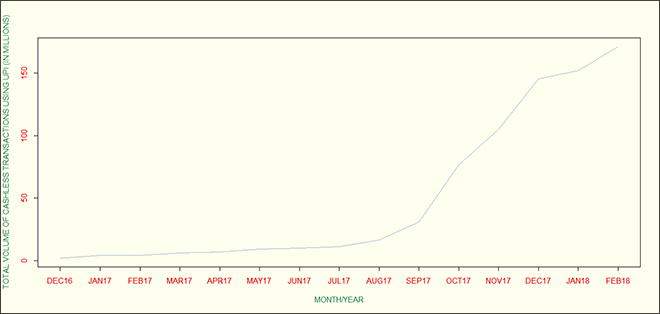
Figure 7: The total volume of cashless transactions using UPI from December 2016 to February 2018
Endnotes:
The views expressed above belong to the author(s). ORF research and analyses now available on Telegram! Click here to access our curated content — blogs, longforms and interviews.

 PDF Download