Introduction
By 2100, global temperature rise (compared to pre-industrial levels) is expected to breach the 1.5°C limit goal determined in the 2015 Paris Agreement. According to the Intergovernmental Panel on Climate Change, global emissions need to be halved over the next decade, with net-zero emissions achieved by the middle of the century, to successfully bend the temperature curve towards 1.5°C and below (see Figure 1 for a scenario analysis).[1]
Figure 1: 2100 Global Warming Projections
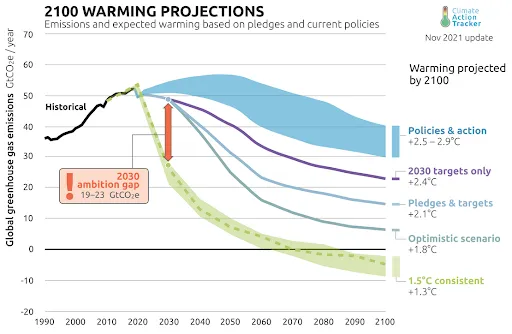
Source: Climate Action Tracker[2]
Policy regimes currently being implemented around the world are expected to result in global warming of about 2.7°C above pre-industrial levels. The impact of nationally determined contributions (NDCs) alone will hold global warming to 2.4°C. Pledges and targets by various governments, which include the NDCs and long-term net-zero targets, are expected to limit warming to 2.1°C. Under the optimistic scenario that the 140 countries that have already committed to net-zero targets, and others who are considering the goal, deliver on the commitment, global warming is estimated to fall to 1.8°C. However, the significant disparity between what is promised by governments (pledges and targets) and what is delivered is worrisome.[3] This disparity—governments unable to deliver on the promised pledges and targets—casts doubt on the realisation of the optimistic projections.
The BRICS grouping—comprising Brazil, Russia, India, China, and South Africa—has prioritised climate action as one of its fundamental areas of focus and has strived to support the United Nations (UN) and G20 on climate change mitigation and biodiversity protection. For instance, the BRICS has emphasised the need for cooperation in adopting the post-2020 Global Biodiversity Framework drafted by the UN Convention on Biological Diversity,[4] and the BRICS countries have regularly used their position within the G20 to nudge the bloc to consider deep-rooted reforms on climate change, energy efficiency, environmental assessment benchmarking and energy security. Additionally, the BRICS summits have made several futuristic commitments on climate action since the group’s inception.[5] At the seventh iteration of the BRICS Environment Ministerial in August 2021, held ahead of the fifteenth meeting of the Conference of the Parties (COP) to the Convention on Biological Diversity in October and the Glasgow Climate Change Conference (COP26) in November, the BRICS reaffirmed its collective cooperation in the fight against climate change, anchored in equity, national priorities and circumstances, and the principles of ‘common but differentiated responsibilities and respective capabilities’.[6]
The Climate Action Tracker (CAT), an independent analysis platform, assesses a country’s performance in meeting the goal of limiting global warming to 1.5°C in terms of its current policies, pledges and targets. It provides insight into the existence and extent of deviation from the desired global warming goal, giving countries direction on whether they need to do more in relation to their climate action. However, the CAT evaluates projected performance involving several assumptions, allowing room for uncertainty in such evaluations.
This report aims to conduct an analysis of progress made by the BRICS grouping compared to the OECD and G20, based on indicators that reflect the current state and outcomes of climate efforts. This eliminates the type of uncertainty that limits the CAT analysis. This report supplements the guidance provided by the CAT to BRICS nations in understanding their contribution to global climate action efforts.
The OECD and G20 have been chosen for comparison with the BRICS to assess the effectiveness of three different formats of multilateralism in terms of climate action. The BRICS is comprised of emerging economies, while the OECD typically consists of developed nations and the G20 is composed of both developed and emerging economies.
Climate Action Performance: BRICS vs OECD and G20
This report compares the performance of the BRICS grouping with that of the G20 and OECD, and identifies which countries within the BRICS make a positive contribution to the bloc’s climate action performance. The five indicators used to analyse the BRICS grouping’s climate action efforts have been selected based on their importance as critical input and outcome variables to tackle climate change.
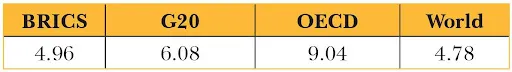
1. Average annual mean surface temperature change (2016-2019)
Climate action aims to hold global warming below a desirable limit. Hence, it is important to recognise a country’s success in achieving low temperature increases in the context of its geography. This indicator represents the role of a country’s temperature increase in overall global warming. (See the Appendix for details on how this indicator is calculated).
BRICS performs below the G20, OECD and the world on this indicator. The G20 and OECD perform better than the world, while the BRICS’s performance is below that of the world by a mere 1.07 percent (see Table 1).
Table 1: Average values of annual mean surface temperature change (2016-19; in degrees Celsius)
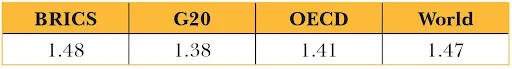
Sources: UN Food and Agriculture Organization Corporate Statistical Database[7] and author’s calculation
India and Brazil contribute positively to the BRICS’ climate action performance. Brazil’s average annual mean surface temperature change for 2016-19 was 1.38 degree Celsius, while India’s was 0.91 degrees Celsius. Both countries perform better than the world and the G20, which registered the best performance on this indicator (see Table 6).
2. Per capita greenhouse gas emissions (2018)
Greenhouse gas (GHG) emissions are the primary cause of global warming and climate change. This indicator explains the need to appraise a country’s performance in reducing GHG emissions. While carbon dioxide (CO2) is the most dominant GHG produced, other GHGs, including methane, nitrous oxide, and trace gases (such as fluorinated gases, which are human-made for industrial purposes), also contribute significantly to global warming. These GHGs are produced by fossil fuel combustion (supporting electricity generation, industry, and transport, among other sectors), industrial production processes and product use, agriculture and land-use change, and poor waste management. In other words, GHG emissions are an outcome of producing goods and services to satisfy human needs and wants. Hence, it is important to adjust GHG emissions with each country’s population for a fair comparison. Instead of considering historical emissions since the industrial revolution, the latest level of emissions (for 2018) are considered to capture the impact of climate change mitigation policies undertaken by countries on their emissions profile.
The BRICS’s performance exceeds that of the G20 and OECD on GHG emissions but falls below the world average (see Table 2).
Table 2: Values of per capita greenhouse gas emissions (2018; in tonnes)
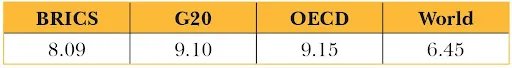
Sources: Climate Watch[8] and author’s calculations
Amongst the BRICS countries, India outperforms the bloc and the world on this indicator, with a per capita GHG emission of 2.47 tonnes. At 6.78 tonnes, Brazil also performs better than the BRICS’s grouping (see Table 6).
3. Per capita CO2 emissions from fuel consumption as part of production (2019)
A crucial focus of climate action has been to reduce the reliance of economic activity on fossil fuel consumption. To evaluate the reliance on fossil fuels, this report considers a country’s per capita production-based CO2 emissions from fuel combustion. This measure reflects a nation’s contribution to global warming due to its reliance on fossil fuels. It is also indicative of the progress made in green transitions (for instance, migrating to renewable sources of energy, and adopting energy efficiency and clean technology) in reducing the dependence on fossil fuels. Again, emissions are adjusted against the population of a country.
While the BRICS performs better than the G20 and OECD, it falls below world performance by a mere 3.65 percent (see Table 3).
Table 3: Values of per capita CO2 emissions from fuel consumption as part of production (2019; in tonnes)
Sources: Our World in Data,[9] World Bank data,[10] and author’s calculation
Brazil and India exceed the BRICS grouping and world performance, at 2.3 tonnes and 1.92 tonnes respectively (see Table 6).
4. Effective expenditure incurred on carbon savings (2019)
This indicator is based on an increase in CO2 emissions because of economic growth, defined as the percentage increase in CO2 emissions over the previous year divided by the economic growth rate over the previous year. It represents the cost of economic growth in terms of carbon emissions. This cost is essentially the GDP elasticity of carbon emissions. The lower this elasticity, the lower is the carbon cost of growth. The carbon cost of growth as a proportion of total growth is then deducted from unity (total growth as a whole). What results is the proportion of growth that can be interpreted as a proxy indicative of the extent of expenditure incurred on reducing the carbon intensity of economic growth or reducing carbon emissions by spending on energy efficiency, renewable energy, and other such modes of carbon savings. This proxy expenditure is then adjusted in relation to the per capita GDP of a nation (See the Appendix for details on how this indicator is calculated).
A country’s per capita GDP is reflective of the urgency of economic growth. The lower the GDP per capita, the higher is the urgency of growth, and the greater is the energy needed to increase growth and development. Also, there are difficulties in the adoption and implementation of renewable energy, energy efficiency and other initiatives for reducing carbon emissions in developing countries, such as high initial acquisition and installation costs; limited stakeholder interest in the promotion or implementation of such technologies; lack of awareness of the benefits; lack of requisite research; and inadequate data mapping of GHG saving potential. These difficulties are pronounced for a developing nation with a low per capita GDP. Furthermore, the low per capita GDP causes a conflict between investing in enhancing development versus investing in energy efficiency. In other words, the urgency of economic growth compounds the difficulty of adopting carbon-saving initiatives.
The expenditure incurred on carbon savings is then adjusted with a correction factor based on per capita GDP to result in what is referred to as the proxy indicative of the ‘effective expenditure on carbon savings’. This effective expenditure is incurred despite the constraints posed by a lower per capita GDP. This is an indicative measure developed for comparative purposes only and should not be interpreted as an actual proportion of GDP (See the Appendix for details on how this indicator is calculated).
The BRICS outperforms the G20, OECD and the world on this indicator (see Table 4).
Table 4: Values of the proxy indicative of the effective expenditure incurred on carbon savings (2019; unit free)
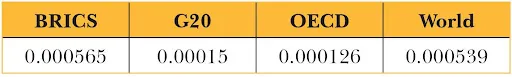
Sources: Our World in Data,[11] World Bank data,[12] and author’s calculation
Brazil, India, and Russia perform better than the BRICS and the world, with values of 0.000609, 0.014 and 0.000785, respectively. India registers the best performance among the BRICS countries on this indicator (see Table 6).
Notably, Russia registered a decline of around 0.72 percent in CO2 emissions from fossil fuel combustion despite growing at 2.03 percent in terms of GDP in 2019. This means that Russia achieved an absolute decoupling of economic growth and carbon emissions, which explains its superior performance compared to the BRICS grouping and the world.
5. Effective proportion of coal-powered energy (2019)
The 2000-watt society concept[13] was developed by scientists at the Swiss Federal Institute of Technology[14] in response to the question, “how much energy is needed for ensuring prosperity and high quality of life while satisfying the constraints of sustainability?”. The answer is 2000 watts of continuous consumption of primary energy for every person on the planet. Furthermore, according to Brazilian scientist José Goldenberg, people can be better off by increasing energy consumption up to 1000 watts per capita and not beyond that.[15] Currently, the average per capita primary energy consumption fluctuates widely across nations. For instance, it may be as low as a few hundred watts in developing countries and six times higher than the 2000 watts level in developed countries.[16] This report refers to 2000 watts per capita as the critical energy threshold that directs countries to alter their energy consumption. Countries that exceed this threshold can lower energy consumption without compromising on their quality of life. Countries that fall below the threshold must close this gap and be provided with the commensurate carbon space to achieve this. Consequently, this indicator measures the proportion of per capita coal consumption in terms of a country’s per capita primary consumption. This proportion is adjusted for surplus or deficit energy relative to the 2000-watts threshold. Excess energy use that can be reduced without sacrificing the Sustainable Development Goals (SDGs) should be treated in the same way as energy generated from coal. Unnecessary energy consumption is likened to the energy consumed from dirty sources like coal, such that the excessive consumption of energy that also has adverse consequences for climate change should be penalised just like energy use from dirty sources.
For countries that run a deficit on critical energy needs, coal-powered energy should be discounted since a subtraction from coal power will adversely affect its SDG prospects. This concession is anchored in the difficulties involved in adopting and implementing renewable energy confronting developing countries and the relative practicality of coal as a large-scale energy option. Adjusting per capita coal consumption as a proportion of per capita primary consumption by surplus/deficit energy consumption yields the ‘effective proportion of coal-powered energy’. In this measure, unnecessary energy consumption is subsumed as energy from coal. This is done to penalise the two kinds of energy consumption similarly (see the Appendix for details on how this indicator is calculated).
While the BRICS outperforms the G20 and OECD, its performance is below that of the world (see Table 5).
Table 5: Values of the effective proportion of coal-powered energy (2019; in percentage)
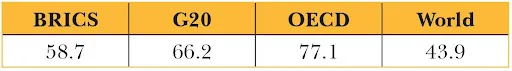
Sources: BP Statistical Review of World Energy 2021,[17] World Bank data,[18] and author’s calculation
Among the BRICS nations, Brazil and India’s effective proportion of coal-powered energy in 2019 was negative, at -1.95 percent and -99.4 percent, respectively. The deficit in energy consumption relative to the 2000-watts threshold has resulted in this negative effective proportion of coal-powered energy, indicating that a significant share of carbon space be allocated to Brazil and India, which is fair given the wide deficit consumption experienced by both nations in critical energy needs.
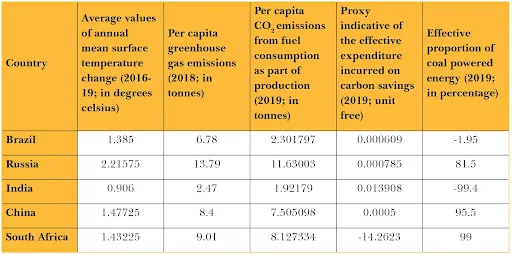
Table 6: Performance of BRICS nations on the five indicators
Key takeaways
- The BRICS aggregate performance is better than G20 and OECD: The BRICS fares better than the G20 and OECD in all but one indicator (average annual mean surface temperature change for the 2016-19 period). As such, the BRICS outperforms the G20 and OECD in climate action performance in aggregate terms, given its better performance across the remaining indicators analysed. As far as the proxy indicative of the effective expenditure incurred on carbon savings is concerned, the BRICS performs better than the world. In the indicators where the world performs better than the three blocs, the deviation of the BRICS from the world performance is the least compared to that of the G20 and OECD.
- Brazil and India support the BRICS’s better performance: Brazil and India have outperformed the BRICS on all five indicators. While India has outperformed the world on all indicators, Brazil has done so on all but one—per capita GHG emissions (2018). As such, both Brazil and India have positively contributed to the BRICS’s aggregate climate action performance. Other BRICS nations have performed below the grouping average and, as such, below the world average as well.
- India is a frontrunner in climate action in the BRICS: India has outperformed the BRICS and the world on all indicators and is the ace performer among the BRICS nations.
Assessing India and Brazil’s Climate Policies
Given that Brazil and India have positively influenced the BRICS’s overall climate action performance, it is important to survey the two countries’ key climate action policies.
Brazil
Land-use change (primarily deforestation) accounts for 46 percent of GHG emissions in Brazil, followed by agriculture (24 percent) and the energy sector (21 percent).[19] Key government initiatives aimed at climate change mitigation include the National Policy on Climate Change, the National Plan for Adaptation to Climate Change, and the Sectoral Plan for Mitigation and Adaptation to Climate Change for the Consolidation of a Low Carbon Economy in Agriculture (ABC plan).[20]
The National Policy on Climate Change is a four-pronged instrument for environmental protection and climate action, with climate change mitigation as a dimension. Within the dimension of mitigation, sectors such as forests, agricultural systems, energy, waste, construction, industry, and transport are key areas of focus. Mitigation also focuses on reducing GHG emissions, improving resource efficiency, reducing resource and emissions intensity of production, and expanding carbon sinks. This policy has leveraged the prevention and control of deforestation and burning in the Amazon and Cerrado regions. This action plan against deforestation and burning, implemented in three phases between 2004 and 2015, resulted in a significant reduction in GHG emissions.[21] A key feature of this action plan is deploying a novel monitoring and law enforcement regime that leveraged satellite-based forest monitoring for targeted enforcement action. Between 2007 and 2016, the plan saved an average of 27,000 sq. km of the Amazon forest per year from deforestation (see Figure 2), translating to avoided emissions of about one billion tonnes of CO2 per year.[22]
Figure 2: Annual deforestation rates of the legal Amazon
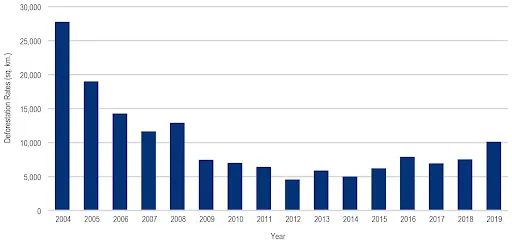
Source: National Institute for Space Research (Instituto Nacional de Pesquisas Espaciais)[23]
The ABC plan was launched in 2012 and is composed of several mechanisms to deliver a low carbon agricultural sector in the country. Mechanisms directed at climate change mitigation include the recovery of degraded pastures; the adoption of the crop-livestock-forest integration system and agroforestry systems; the expansion of the no-tillage system; the expansion of the use of biological nitrogen fixation; an increased area of planted forests; and animal waste treatment. The outcomes sought from these mechanisms include promoting sustainable agricultural practices that prevent deforestation and reduce GHG emissions, and increasing carbon sequestration to build resilient production systems. The ABC plan succeeded in mitigating GHG emissions between 100.21 and 154.38 million tonnes of CO2 equivalent between 2010 and 2018.
While 84.87 percent of Brazil’s electricity was generated from non-fossil fuels such as hydropower, nuclear power and other renewables, a whopping 63.53 percent came from hydropower alone in 2019. This implies that a meagre 15.13 percent of electricity was generated from fossil fuels (oil, natural gas, and coal) in 2019.[24]
India
A substantial portion of India’s total GHG emissions is generated by the energy sector (about 75 percent), followed by agriculture (14 percent), industrial processes and product use (8 percent), and waste (3 percent). Indeed, CO2 emissions from electricity generation accounts for around 40 percent of the total national emissions, while CO2 emissions from road transport contribute 8.57 percent of the total national emissions.[25]
Improving resource use and energy efficiency, expanding the use of renewable energy, improving energy security, universal and affordable access to modern energy, and diversifying energy resources are the key focus areas of the Indian power sector in terms of climate change mitigation.[26] By end-2019, India’s total renewable energy installed capacity (including large hydropower and nuclear power) had reached more than 136 GW, and the proportion of renewable energy in electricity installed capacity was 37.18 percent.[a],[27] The uptake of energy efficiency schemes accrued aggregate energy savings to the tune of 23.73 million tonnes of oil equivalent (Mtoe) for 2018-19. The Perform, Achieve and Trade (PAT) scheme accrued emissions savings of 31 MtCO2 in PAT-I (2012-2015) and 61.34 MtCO2 in PAT-II (2016-2019).[28]
Launched in January 2015, Unnat Jyoti by Affordable LEDs for All (UJALA) and LED Street Lighting National Programme (SLNP) are the world’s largest domestic lighting projects and streetlight replacement programmes, respectively. Under the UJALA scheme, over 36.13 crore LED bulbs have been distributed nationally to yield an estimated energy savings of 46.92 billion kWh per year, avoided peak demand of 9,394 MW, and an estimated GHG emission reduction of 38 million tonnes of CO2 yearly.[29] Under the SLNP initiative, over 1.03 crore smart LED streetlights were installed by the end of 2019, with an estimated 6.97 billion kWh per year in saved energy, an avoided peak demand of 1,161 MW, and mitigated GHG emission of about 4.80 million tonnes of CO2 on an annual basis.[30]
The Buildings Energy Efficiency Programme has covered 10,344 buildings, including railway stations and airports, contributing to energy savings of 224 million kWh per year, with an avoided peak demand of 75.64 MW, and emission reduction of 0.18 MtCO2 per year.[31]
As part of the National Electric Mobility Mission Plan 2020, the Department of Heavy Industry formulated the Faster Adoption and Manufacturing of (Hybrid &) Electric Vehicles in India (FAME India) Scheme in 2015. The first phase of the FAME India scheme, which commenced in April 2015 and continued till March 2019, supported the deployment of 0.28 million hybrid and electric vehicles.[32]
The Pradhan Mantri Krishi Sinchayee Yojana aims to expand irrigation coverage and promote water-use efficiency. This scheme achieved an emissions reduction of 11.979 MtCO2 during 2017-18 and 2018-19. Emissions mitigation has also followed from agricultural schemes related to crop production, including crop diversification from rice, direct seeding of rice and the rice intensification system, and projects in other agricultural sectors, such as livestock, horticulture and fisheries.[33]
India’s waste sector has based its emissions mitigation strategy on expanding the waste management sector in general and on the modernisation of sanitation infrastructure and provisions.[34]
Conclusion
This report has evaluated the climate action performance of the BRICS, G20 and OECD groupings in relation to average annual mean surface temperature change, per capita GHG emissions, per capita CO2 emissions from fuel consumption as part of production, proxy indicative of effective expenditure incurred on carbon savings, and effective proportion of coal-powered energy. These indicators capture the progress made in climate change mitigation while considering national priorities and circumstances, and the principles of equity, common but differentiated responsibilities, and respective capabilities. India and the BRICS grouping emerge as the better performers on climate action among those assessed.
At the same time, it is important to identify indicators where the BRICS, OECD and G20 groupings’ performance are below the global levels and for countries within these groups that are struggling to perform on par with the global average. These countries must be assisted to overcome constraints through climate cooperation. To further improve its performance, it is incumbent that the BRICS grouping does not only depend on Brazil and India but also encourages and supports the other three countries to enhance their climate action efforts. Countries within the BRICS, OECD and G20 blocs that fall below global performance levels across multiple indicators should consider increasing their climate action ambitions while submitting their new climate action targets at the upcoming COP27 (to be held in Egypt in November 2022) by leveraging on the assistance provided through international climate cooperation. Countries can explore cooperation opportunities in energy efficiency, renewable energy, circular economy and ecosystem, and biodiversity protection. The three blocs must consider collaboration in innovation, technology transfer and information and knowledge sharing, and develop best practices in energy efficiency, renewable energy, circular economy and ecosystem, and biodiversity protection. The countries in these groupings that perform below par should consider signing climate action related conventions and frameworks (for instance, the Convention on Biological Diversity and the UN Convention to Combat Desertification) and joining coalitions and partnerships (such as the High Ambition Coalition for Nature and People, and the International Partnership for Blue Carbon). Climate cooperation should also leverage avenues to boost the flow of climate finance to the countries most in need of it within these blocs.
APPENDIX: DETAILED METHODOLOGY
Calculating the average of annual mean surface temperature changes for the 2016-2019 period: The annual mean surface temperature change for each year from 2016 to 2019 is calculated with respect to the 1951-1980 baseline. The mean of the temperature changes for each year from 2016 to 2019 is used to calculate the average for the BRICS nations. Then, the average of the mean values across the four years is calculated. The same method is used for the G20 nations. The annual mean surface temperature change for each year from 2016 to 2019 is available for OECD nations as a collective. A simple average of these is enough for the purpose of the current analysis.
Estimating the effective expenditure incurred on carbon savings (2019): The percentage increase in CO2 emissions in 2019 over the previous year is divided by the growth rate in 2019. This gives the cost of one percent increase in growth in terms of CO2 emissions. Subtracting this cost from unity (the total growth rate, as a whole), yields the proxy indicative of the extent of the expenditure incurred on carbon savings. This expenditure is adjusted using a correction factor based on GDP per capita.
The correction factor is the square of the ratio of the minimum per capita GDP in 2018 to the nation’s per capita GDP (2018). The correction factor intends to capture the constraints imposed by a lower per capita GDP on reducing the carbon cost of growth or alternatively on increasing the expenditure incurred on carbon savings. The author has identified two such constraints—the urgency of economic growth and the difficulty in adopting carbon saving technologies, with the former compounding the latter. As such, the difficulty of reducing the carbon cost of growth given a low per capita GDP is not a linear function of per capita GDP. It is appropriate to model it as a non-linear function. Hence, the ratio of the minimum per capita GDP to the nation’s per capita GDP is squared to capture the compounding effect. As the actual per capita GDP moves away from the minimum per capita GDP, the correction moves away from unity to become smaller in magnitude. The larger the per capita GDP, the lower the correction factor.
When the correction factor is multiplied to a country’s expenditure incurred on carbon savings, it gives the effective expenditure incurred on carbon savings. The smaller the correction factor, the smaller is the fraction that can be regarded as effective expenditure incurred on carbon savings. The magnitude of the correction factor measures the relative difficulty involved in incurring such expenditure. Hence, a smaller correction factor is reflective of relative ease of incurring such expenditure and subtracts a greater proportion away from the expenditure incurred on carbon savings to acknowledge the difficulty experienced by poorer nations to achieve such clean growth. On similar lines of reasoning, a larger correction factor subtracts a smaller proportion away from expenditure incurred on carbon savings to display fairness in appraising poorer nations by respecting their constraints.
When the percentage increase in carbon emissions exceeds the growth rate, the nation is said to be in ‘carbon debt relative to economic growth.’ This carbon debt must be penalised, and greater the per capita GDP, larger should be the penalty. In such cases, the above correction factor will give wrong estimates. Hence, in cases of carbon debt relative to economic growth, the correction factor is simply the squared value of one minus the ratio of the minimum per capita GDP to the nation’s per capita GDP.
Estimating the effective proportion of coal powered energy n (2019): The proportion of per capita coal consumption in terms of per capita primary energy consumption in obtained. The surplus or deficit energy consumption is obtained by subtracting the critical energy threshold (2000 watts) from the actual per capita energy consumption. The surplus (deficit) is expressed as a proportion of the actual per capita primary consumption, and then added to (subtracted from) the per capita coal consumption as a proportion to actual per capita primary consumption. This step of adding (subtracting) the surplus (deficit) as a proportion of the actual per capita primary consumption to the ratio of per capita coal consumption to actual per capita primary consumption is done to penalise unnecessary energy consumption in the same way as energy use from coal. This puts a penalty on the surplus-consuming nation and gives concession to the deficit-running nation. The resultant figure gives the effective proportion of coal powered energy.
Endnotes
[a] Although more recent data on India’s total renewable energy installed capacity is available, this report uses the 2019 data because the five indicators are calculated for this year.
[1]“COP26 EXPLAINED,” UN Climate Change Conference UK 2021, Masson-Delmotte, V., P. Zhai, H.-O. Pörtner, D. Roberts, J. Skea, P.R. Shukla, A. Pirani, W. Moufouma-Okia, C. Péan, R. Pidcock, S. Connors, J.B.R. Matthews, Y. Chen, X. Zhou, M.I. Gomis, E. Lonnoy, T. Maycock, M. Tignor, and T. Waterfield (eds.), Summary for Policymakers, in Global Warming of 1.5°C: An IPCC Special Report on the impacts of global warming of 1.5°C above pre-industrial levels and related global greenhouse gas emission pathways, in the context of strengthening the global response to the threat of climate change, sustainable development, and efforts to eradicate poverty, IPCC, 2018.
[2] Addressing Global Warming (2100 Global Warming Projections).
[3] Addressing Global Warming (2100 Global Warming Projections).
[4] “BRICS nations stress on improving environment, promoting circular economy to recover from COVID-19 effects,” The Economic Times, July 31, 2020; Prachi Ugle Pimpalkhute, How are BRICS Nations Nudging with G20 Nations for framing Climate and Energy Synergies? Towards Low Carbon Economy and Resilience, Report for the Eco Endeavourers Network, August 2020.
[5] John Kirton, “BRICS Climate Governance in 2020”( Paper presented at the “BRICS at Ten: Challenges, Achievements and Prospects,” Gaidar Forum, RANEPA, Moscow, January 15, 2020).
[6] “BRICS countries pledge to work together to tackle climate change,” The Indian Express, August 28, 2021.
[7] UN Food and Agriculture Organization Corporate Statistical Database.
[8] Climate Watch, Data on Historical GHG Emissions.
[9] Our World in Data, Data on CO2 Emissions (Global CO2 emissions from fossil fuels).
[10] World Bank data website, Data on population by country.
[11] Our World in Data, Data on CO2 Emissions (Global CO2 emissions from fossil fuels).
[12] World Bank data website, Data on GDP Per Capita by country; World Bank data website, Data on GDP Growth Rate by country.
[13] “2000-Watt society and 2000-Watt Site,” The website of 2000 Watt Area; Samir Saran and Vivan Sharan, “The false debate on India’s energy consumption,” in What does India think?, ed. François Godement, (London, The European Council on Foreign Relations, 2015),; Smarter living: Generating a new understanding for natural resources as the key to sustainable development – the 2000-watt society.
[14] Kalle Huebner, “2,000 Watt Society,” The web magazine of Our World, United Nations University, 2009.
[15] The 2000-Watt Society, Fighting Climate Change as a 2000-Watt Society. One Target. Our Community. Stepping Up Now: Minneapolis, Minnesota | Carbon Framework Plan, 2018.
[16] Jeremy Williams, “The 2000 Watts Society,” The website of The Earthbound Report, November 2020.
[17] BP Statistical Review of World Energy 2021.
[18] World Bank data website, Data on population by country.
[19] [19] Anny K de Souza Mendonça, Silvio A.d. Silva, Luísa Z. Pereira, Antonio C. Bornia, and Dalton F.d. Andrade, “An Overview of Environmental Policies for Mitigation and Adaptation to Climate Change and Application of Multilevel Regression Analysis to Investigate the CO2 Emissions over the Years of 1970 to 2018 in All Brazilian States,” Sustainability 12, no. 21 (2020).
[20]de Souza Mendonça et al., “An Overview of Environmental Policies for Mitigation and Adaptation to Climate Change and Application of Multilevel Regression Analysis to Investigate the CO2 Emissions over the Years of 1970 to 2018 in All Brazilian States”
[21] de Souza Mendonça et al., “An Overview of Environmental Policies for Mitigation and Adaptation to Climate Change and Application of Multilevel Regression Analysis to Investigate the CO2 Emissions over the Years of 1970 to 2018 in All Brazilian States”
[22] Juliano Assunção and Clarissa Gandour, “Brazil knows how to fight Amazon deforestation: Monitoring and law enforcement must be strengthened,” the website of Mongabay, December 30, 2019.
[23] Deforestation dashboard, Terra Brasilis, PRODES, National Institute for Space Research (Instituto Nacional de Pesquisas Espaciais).
[24] BP Statistical Review of World Energy 2021.
[25] Ministry of Environment, Forest and Climate Change, India Third Biennial Update Report to The United Nations Framework Convention on Climate Change, Ministry of Environment, Forest and Climate Change, Government of India, 2021.
[26] Ministry of Environment, Forest and Climate Change, India Third Biennial Update Report to The United Nations Framework Convention on Climate Change
[27] Dashboard of the Central Electricity Authority, Data on Composition of Installed Capacity, Ministry of Power, Government of India.
[28] Ministry of Environment, Forest and Climate Change, India Third Biennial Update Report to The United Nations Framework Convention on Climate Change
[29] Press Information Bureau, Government of India’s UJALA & Street Lighting National Programme Complete Five Successful years of Illuminating India, Ministry of Power, Government of India, January 5, 2020.
[30] Press Information Bureau, Government of India’s UJALA & Street Lighting National Programme Complete Five Successful years of Illuminating India
[31] Ministry of Environment, Forest and Climate Change, India Third Biennial Update Report to The United Nations Framework Convention on Climate Change
[32] Press Information Bureau, FAME India Scheme, Ministry of Heavy Industries, Government of India, July 9, 2019; Ministry of Environment, Forest and Climate Change, India Third Biennial Update Report to The United Nations Framework Convention on Climate Change
[33] Ministry of Environment, Forest and Climate Change, India Third Biennial Update Report to The United Nations Framework Convention on Climate Change
[34] Ministry of Environment, Forest and Climate Change, India Third Biennial Update Report to The United Nations Framework Convention on Climate Change
The views expressed above belong to the author(s). ORF research and analyses now available on Telegram! Click here to access our curated content — blogs, longforms and interviews.

 PDF Download