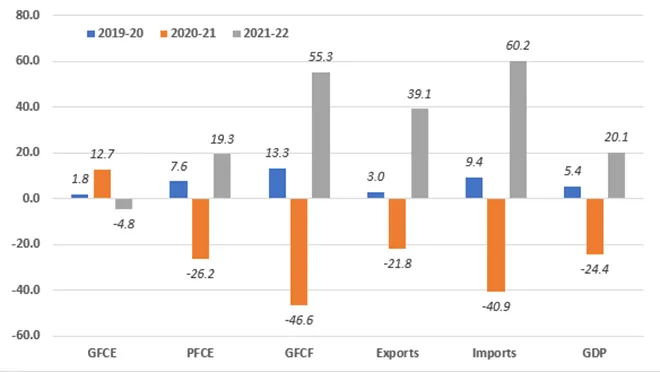
Gross Domestic Product (GDP) estimates for the first quarter Q1 (April-June) of the financial year 2021-22 (FY22) have been published. GDP at constant (2011-12) prices in Q1 has been estimated at INR 32.38 lakh crore. This is a growth of 20.1 percent in 2021-22, compared to the 24.4 percent contraction in the same quarter a year back. Except for government expenditure (GFCE), all other components of GDP have increased. The good news is that both consumption demand (PFCE) and investment (GFCF) are now showing signs of revival, though private consumption has increased by a relatively modest 19.3 percent. Exports have increased 39.1 percent, but imports increased by 60.2 percent. These are definitely positive economic signals for the beleaguered economy (
Figure 1).
| FIGURE 1: Trend in year-on-year Q1 growth rates of GDP components at constant (2011-12) prices (in %) |
 |
|
* GFCE = Government Final Consumption Expenditure, PFCE = Private Final Consumption Expenditure, GFCF = Gross Fixed Capital Formation, GDP = Gross Domestic Product
Data Source: Ministry of Statistics and Programme Implementation (MoSPI) |
However, Q1 estimates have also initiated unnecessary posturing amongst a certain set of the commentariat. This 20.1 percent in Q1 of FY22 is now hailed as the definitive sign of a full economic recovery from the pandemic-induced recession. Can the Q1 results be interpreted as a sign of full recovery?
Is the Indian economy already out of the woods?
Suppose in Q1 of 2019-20 (FY20), the Indian economy had a GDP of INR 100. Last year’s pandemic-induced Q1 contraction was 24.4 percent. So, the Q1 GDP would have come down to INR (100 – 24.40) = INR 75.60 in FY21.
A quarter-wise “full recovery of economy” in FY22 would then require the GDP to go back to INR 100. That implies an INR 24.40 increase in GDP this year. But the important point here is that the statistical base of measuring growth now would be a much lower INR 75.60 (not INR 100).
So, INR 24.40 increase in Q1 GDP (or full restoration of Q1 GDP at FY20 level) would require a growth rate of {(24.40/75.60) x 100} = 32.3 percent approximately.
Both consumption demand (PFCE) and investment (GFCF) are now showing signs of revival, though private consumption has increased by a relatively modest 19.3 percent.
But the Q1 GDP growth rate in FY 22 is 20.1 percent. Given the lower base of INR 75.60 in our hypothetical example, the increase amounts to INR {75.60 x (20.1/100)} = INR 15.20 approximately. So, the hypothetical economy has now reached a GDP level of INR (75.60 + 15.20) = INR 90.80. This is still INR 9.20 (or 9.2 percent) short of the hypothetical FY20 Q1 GDP level of INR 100.
Therefore, Q1 GDP growth rate of FY22 does not represent or signal “full recovery” of the economy, by any statistical yardstick.
In actual estimates, the difference between Q1 GDP of FY22 and FY20 is a negative INR 3.29 lakh crore. The difference between Q1 GDP of FY22 with FY19 (2018-19) is a negative INR 1.46 lakh crore approximately (
Table 1).
The GDP of Q1 in FY22 is not even at the level of Q1 GDP of FY19. The economy is already stuttering with more than a two-year lag. The so-called debate on a full recovery of the economy is premature.
| TABLE 1: Components of GDP of Q1 from 2018-19 to 2021-22, at constant (2011-12) prices (in INR crore) |
|
Q1 |
|
|
2018-19 |
2019-20 |
2020-21 |
2021-22 |
Q1FY22 - Q1FY20 |
Q1FY22 - Q1FY19 |
| GFCE |
385751 |
392585 |
442618 |
421471 |
28886 |
35720 |
| PFCE |
1882275 |
2024421 |
1494524 |
1783611 |
-240810 |
-98664 |
| GFCF |
1088766 |
1233178 |
658465 |
1022335 |
-210843 |
-66431 |
| Exports |
686676 |
706991 |
552524 |
768589 |
61598 |
81913 |
| Imports |
802316 |
877506 |
518453 |
830673 |
-46833 |
28357 |
| GDP |
3384141 |
3566708 |
2695421 |
3238020 |
-328688 |
-146121 |
|
* GFCE = Government Final Consumption Expenditure, PFCE = Private Final Consumption Expenditure, GFCF = Gross Fixed Capital Formation, GDP = Gross Domestic Product
* Last two columns are derived by subtracting 2019-20 and 2018-19 values from 2021-22 figures.
Data Source: Ministry of Statistics and Programme Implementation (MoSPI) |
The
Ministry of Finance has stated that Q1 data “reaffirms
government’s last year prediction of an imminent V-shaped recovery”. This claim also needs a closer scrutiny.
Is the Indian economy undergoing a V-shaped recovery?
In simple words, a V-shaped recovery takes place when key macroeconomic indicators, including GDP, leaps back quickly and comprehensively to the pre-pandemic levels.
As mentioned, the GDP is yet to reach 2018-19 level if Q1 estimates over the years are considered. More importantly, two largest drivers of GDP—private consumption (PFCE) and investment (GFCF) are lagging behind FY20 and FY19 figures.
By definition, the economy is certainly not following a path of V-shaped recovery.
Is the economy then following a K-shaped recovery path?
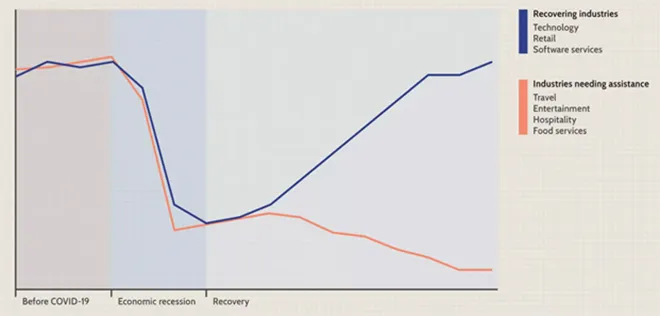
Following a recession, a K-shaped recovery occurs when different sectors of the economy recover at different rates. Due to structural imbalances, some recover faster and some sectors stagnate or nosedive further down—unable to cope with recessionary conditions. This is in contrast to the uniform overall V-shaped recovery across sectors and industries (Figure 2).
Different components of GDP in Table 1 hint at the possibility of a K-shaped recovery. However, sectoral figures need to be analysed to ascertain about the exact path of recovery the economy is currently undergoing.
| FIGURE 2: An illustrative example of a K-shaped recovery |
 |
|
* This is an illustrative example and does not represent any real economy including Indian economy.
Source: Investopedia |
Sectoral GVA figures at basic prices confirm that economy is not at “full recovery” level. Beyond that, these also indicate some alarming sectoral trends. Out of total eight broad sectoral activities, only two have bypassed Q1 figures of FY20. These are (a) agriculture, forestry, and fishing, and (b) electricity, gas, water supply, and other utility services. The other six sectors are still lagging behind (Table 2).
Trade, hotels, transport, communication, and services related to broadcasting were expected to suffer the most, and these have suffered losses. But a greater worrying element is that manufacturing and mining are still lagging. These sectors are not only behind the Q1 figures of FY20, but also behind the Q1 figures of FY19. Construction is also yet to reach the levels of FY20 and FY19.
| TABLE 2: Sectoral GVA at basic prices for Q1 from 2018-19 to 2021-22, at constant (2011-12) prices (in INR crore) |
|
Q1 |
|
|
2018-19 |
2019-20 |
2020-21 |
2021-22 |
Q1FY22 - Q1FY20 |
Q1FY22 - Q1FY19 |
| Agriculture, forestry & fishing |
434854 |
449390 |
465280 |
486292 |
36902 |
51438 |
| Mining & quarrying |
84022 |
82914 |
68680 |
81444 |
-1470 |
-2578 |
| Manufacturing |
564361 |
567516 |
363448 |
543821 |
-23695 |
-20540 |
| Electricity, gas, water supply & other utility services |
74511 |
79654 |
71800 |
82042 |
2388 |
7531 |
| Construction |
250892 |
260099 |
131439 |
221256 |
-38843 |
-29636 |
| Trade, hotels, transport, communication, & services related to broadcasting |
625513 |
664311 |
345099 |
463525 |
-200786 |
-161988 |
| Financial, real estate & professional services |
737031 |
802241 |
761791 |
789929 |
-12312 |
52898 |
| Public administration, defence, & Other Services |
377924 |
399148 |
358373 |
379205 |
-19943 |
1281 |
| GVA at basic prices |
3149109 |
3305273 |
2565909 |
3047516 |
-257757 |
-101593 |
|
* Last two columns are derived by subtracting 2019-20 and 2018-19 values from 2021-22 figures.
Data Source: Ministry of Statistics and Programme Implementation (MoSPI) |
It is a bit too early to predict the nature of the recovery path, but definitely the recovery will be uneven across sectors and industries. Statistical trends are distinctly pointing towards that possibility.
There are early signs indicate a K-shaped recovery, but future performance of the economy need to be closely monitored as the situation across different sectors and industries may turn out to be more complex and nuanced.
The Q1 estimates of FY22 demonstrated that the human and economic losses of the second wave of COVID-19 this year have been significant. It is now more prudent for the government to bolster efforts to effectively deal with such possible future waves. That will serve the purpose of economic recovery better than any other.
The views expressed above belong to the author(s). ORF research and analyses now available on Telegram! Click here to access our curated content — blogs, longforms and interviews.