In a period of 204 days, the virus has infected 3,970,908 people and killed nearly 143,190 across the US. While many countries imposed travel bans and lockdown measures to contain the spread of the virus, the same measures were not exercised by the US. There were restrictions placed on the influx of travelers from some destinations, including China (suspended on 2 February) and Europe (13 March), but, there were no restrictions on interstate travel, movement within cities, retail and recreational activities, and workplaces for much of this period and beyond. Despite several early warnings of the outbreak by health officials in late February, the President urged Americans to “go on with their normal lives”. When the US finally reached a point where it was difficult to trace, quarantine and treat COVID-19 patients, President Trump, on 16 May, requested citizens to limit travel, avoid social gatherings, and work from home. However, by then, many individual states had already issued state-wide stay-at-home orders and suspended non-essential businesses to contain the spread.
During the last week of May, after reporting an average of 20,000 cases per day, experts believed that the COVID-19 curve had peaked and levelled. Subsequently, federal guidelines advised states to reopen if they had registered a downward trajectory in cases or in the percentage of positive tests, for a period of 14 days. However, premature lifting of stay at home orders, reopening of businesses, and relaxation of social distancing norms in order to kick start the economy have led to the resurgence in cases in certain states since mid-June. During the last seven days, Florida alone has recorded 77,455 cases while Texas, California and Arizona have recorded 66,681; 64,261; and 20,586 respectively.
The Google Community Mobility Reports (GCMR) are important catalogues for mapping human activity. They capture the change in mobilty patterns (positive/negative percentage) compared to the baseline days (baseline day = median value from the five weeks, from 3 January — 6 February 2020). This study analyzes the variations in mobility with respect to Parks and Retail and Recreation areas, both of which can be termed as discretionary visits. The mobility levels have seen a consistent rise over the weeks. At the same time, the mobility levels pertaining to workplaces and transit stations has remained consistent (and muted) overtime.
Daily New Cases per 100k people

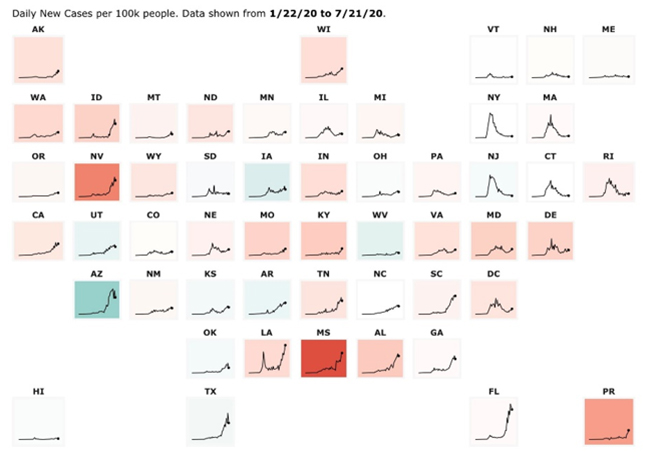 Source: https://coronavirus.jhu.edu/data/new-cases-50-states
Reasons Behind California’s Upward Growth Trajectory
By recording 64,261 new infected cases in a period of one week (15-22 July), California’s tally reached 400,769 – making it the most affected state in America. Within California, Los Angeles (LA) contributes to approximately 40% (162,025) out of the total confirmed cases. California was one of the first states to impose a statewide stay-at-home order (16 March). The mobility data from GCMR suggest that the average mobility in LA during the first week of April declined to -47.1% in Retail and Recreational, -48.6% in Parks, -53.9% in Transit stations, and -49.6% in Workplaces. Since the gradual reopening of the economy, there has been an increase in mobility. On Memorial Day, mobility in parks increased to 16%, compared to -11.14% between 01 – 07 July.
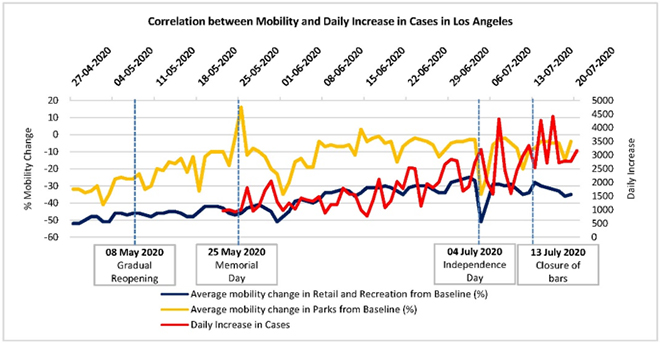 Source: Google Community Mobility Reports
Houston at Level-1 High Alert
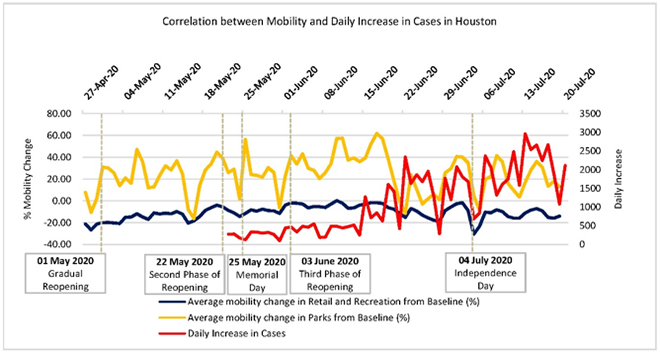
Across Houston, a decline in mobility was observed even before the statewide stay-at-home order (April 02) was enforced. In the last week of March, Retail and Recreation had dropped to -40.85% while Parks, Transit stations, and Workplaces saw a decline of -20.14%, -41.71%, and -42.14% respectively. Since officials believed Houston had successfully flattened the curve by April; stay-at-home orders were lifted on 1 May. When the state had about 29,000 cases, bars and bowling alleys with limited capacity and restrictions were allowed to reopen on 22 May. Correspondingly, in the week between 15-22 June, the mobility relating to Retail and Recreation increased across Houston to -6.2% while parks and workplace mobility was at 16% and -27.83% respectively. This increased mobility may have had a bearing on the subsequent surge seen in COVID-19 cases.
 Source: Google Community Mobility Reports
Houston’s healthcare systems have seen a 2.8-fold increase in hospitalization since 28 May with intensive-care units at 97% capacity. Looking at the severity and its uncontrollable spread, several steps were taken to contain the virus on 26 June. For instance, Covid-19 threat level was bumped up to “Level 1 – Severe” in Houston and other counties. Bars were closed, and restaurants reduced their capacity from 75% to 50%.
Is COVID-19 driving South Florida further “South”?
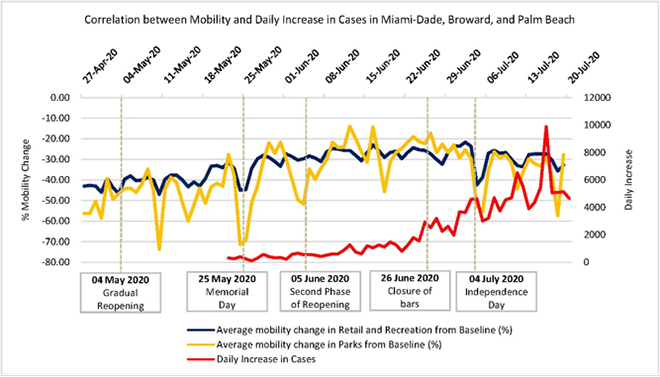
After recording 77,455 cases in the week from July 15 –22, Florida’s total tally reached 365,244 on 23 July. South Florida (Miami-Dade, Palm Beach, and Broward) has contributed to ~44% of all cases.
 Source: Google Community Mobility Reports
A decline in Florida’s mobility was observed after the statewide stay-at-home order was enforced (2 April). Recreational trails in state-parks and selected beaches with certain limitations were allowed to reopen from 1 May. Florida’s recovery plan permitted the reopening of retail stores and restaurants at 25% indoor capacity from 4 May throughout the state except Miami-Dade, Broward, and Palm Beach counties to avoid a larger outbreak. From May 18, these three counties were allowed to reopen with similar restrictions. The second phase permitted the reopening of bars, theme parks, and bowling alleys across all counties except these three. Despite these restrictions, Retail and Recreational activities and Parks’ footfall have primarily led to a spike in cases in June in Miami-Dade, Broward, and Palm Beach counties.
The spike has turned into a burden for the healthcare system. As of 21 July, out of the 2200 patients admitted in Miami-Dade, 513 are in intensive care units (ICU) while 300 are on ventilators. Efforts are now being made to convert normal beds into ICUs.
What is behind Arizona’s spike?
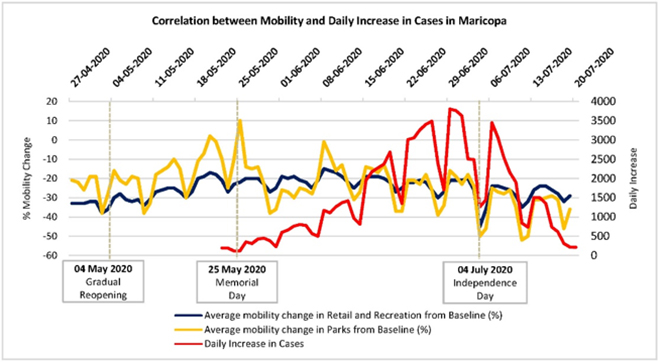
Between 25 and 31 March, a mobility decline of -35.5% was seen in Retail and Recreation, -13.1% in parks, -36.7% in transit stations, and -38.9% in workplaces. Although stay-at-home orders were extended till 15 May, retail stores with restrictions were permitted to reopen from 4 May. With restaurants and coffee shops resuming dine-in with limited capacity from 8 May, a substantial increase in mobility, especially in Retail and Recreation (-26.9%) was seen during the second week of May (8 – 14 May).
 Source: Google Community Mobility Reports
The GCMR shows that since the beginning of June, there has been a gradual increase in mobility for Retail and Recreation across Maricopa with a fluctuating movement in parks. This resulted in reinstating restrictions on parks, bars, and gyms across Arizona to contain the spread.
What went wrong?
Increase in testing has reflected in an increase in cases but the spike cannot be attributed to this factor alone. Premature re-opening and policy measures (or lack thereof) have foreshadowed the surge in cases. Nine states including Michigan, Arizona, Florida, Texas, California, and Colorado - are facing a renewed sense of urgency as governors have backtracked their re-opening plans and are reinstating restrictions on parts of the economy that were reopened earlier. The recent spike has seen a shift in the age demography of those affected by COVID-19 as younger people are now getting infected. This could be because of the re-opening of bars. To this end, as a first step to contain the spread, governors of certain states have announced the closure of state-wide bars.
Twelve states including Idaho, Nevada, Alabama, and Mississippi have put a pause on their reopening plans. At the national level, the rhetoric does not reflect the sense of urgency that would have been expected in this scenario. States that have seen a rise in cases in June have observed a tangible increase in mobility in Parks, and Retail and Recreation, especially over weekends and federal holidays like Memorial Day and the 4 July weekend. Another potential reason contributing to the mobility change, during the last week of May and early June, is the #BlackLivesMatter protests across the country. States like LA, Texas, and Florida became the stage for mass gatherings to protest against police brutality in the aftermath of George Floyd’s death.
While GCMR gives a real-time sense of how people are moving, it does not give a legitimate snapshot of people’s behavior - social distancing measures or if they were wearing masks. It is also observed that Americans are not taking these measures seriously. It was only fairly recently that states have started mandating masks in public spaces. Thirty two states including New York, Texas, Illinois, California, Arizona have mandated face coverings after observing a rise in cases.
What lies next for America?
The situation in America is no longer defined by the concentration of the pandemic in New York. New York reported less than 5,000 cases in the week ending 22 July. Gradual re-opening and enforcing orders on social distancing measures and masks have resulted into a downward trajectory of cases in NYC. It is important for other states to adopt the established best practices to contain the spread. Although governors had enforced restrictions on certain parts of the economy for the 4 July weekend, there was a massive increase in the mobility in parks across America. The coming week will determine if America has been able to circumvent another spike (considering the incubation period for the virus).
In a country where the President himself does not believe in enforcing social distancing measures or mandating masks—as observed in his speeches as well as seen during his rally in Tulsa, Oklahoma on June 20—the message from the bully pulpit is careless. After Oklahoma reported 673 cases on 8 July, the Director of the State’s Health Department in Tulsa believed it to be an aftermath of the rally. This is just the beginning. The upcoming presidential elections slated for 3 November will most probably be followed by a rise in COVID-19 cases. The rallies will drive the severity of the virus – we will either see a second wave or maybe a continued first wave that won’t plateau. Or, perhaps, the Americans will eventually succeed in developing herd immunity.
*Analysis has been done based on Mobility Data from 27 April to June-July 19 and Daily Increase in Cases from 22 May to 20 July.
The views expressed above belong to the author(s). ORF research and analyses now available on Telegram! Click here to access our curated content — blogs, longforms and interviews.