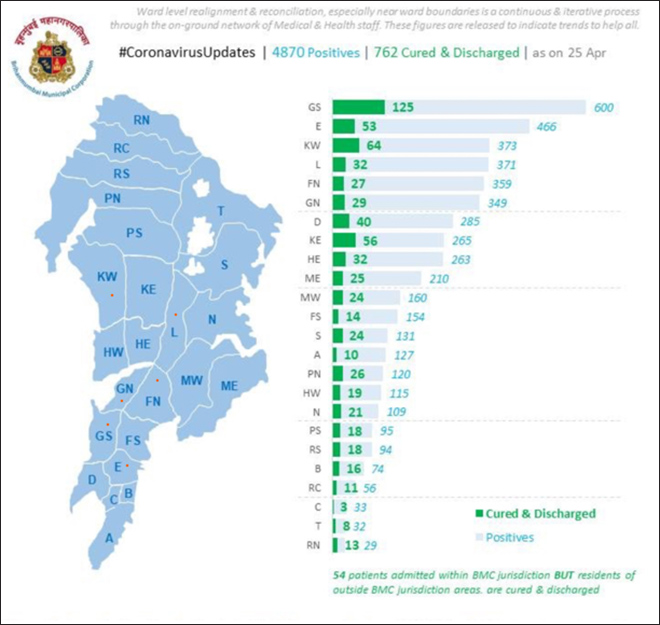
Over 50% cases in six wards and 16% of Mumbai area
While the whole of Mumbai lies in the red zone, the numbers reveal a worrying trend — over half of Mumbai’s corona infected cases are concentrated in six administrative wards/zones, which comprises of 16% of entire Mumbai. Coincidently, all these six administrative zones (G South, E, K West, L, F North, G North) have large slum pockets and house large number of informal migrants who work in the city. Each of these high-density zones which have above 300 positive cases, carry 28% of the total city population and 24% of the total slum population of Mumbai (as per 2011 census, see table).
High density cluster
A look at the Mumbai map tells you that five of these zones are intertwined as they are located next to each other, and thus contagious in nature. While they are administratively divided for civic management, their flow into each other and permeability is strong. Therefore, their intersections and interplay will need to be looked at as a huge area rather than small units divided by paper drawn boundaries. This could be defined as a special high density cluster which could be planned together, and facilities related to manpower and infrastructure could be shared.
Koliwada (fishing villages) management
There could be sharing of experiments between wards in case of tackling COVID-19 in communities living in similar housing types across the administrative lines like koliwadas (fisherfolk villages) in Worli, Mahim, Sion and Juhu, where there is a high outbreak percentage. The traditional fisherfolk of Mumbai known as ‘Koli’s’ are a highly organised community and local leaders and community representatives could be roped in for movement control and support to vulnerable people and communication.
Slum clusters
Two of the most affected wards — ‘L’ and ‘F’ North have over 50%, while ‘G’ North has 33% of its population living in slums which is the large Dharavi-Sion-Kurla pocket.
Populated with inadequate household water and sanitation, little or no waste management, lack of basic services, secure tenure and adequate housing, the concepts of hand washing, physical distancing, self-quarantine, self-isolation or community-wide lockdowns are often difficult in these zones. These areas could be clubbed especially where control measures will have to be still implemented restricting the social and economic life of slum dwellers and informal workers, and locally appropriate approaches be developed to mitigate the aftereffects of the pandemic.
Government rollout
In the current situation, as the government indicates extending the lockdown post 3 May 2020 in Mumbai, the financial capital of India, the city administration is trying its best to combat the contagion. In the past one month, the city has brought down its case doubling rate from 3.1 days to about 7.8 days. While its death rate percentage is about 3.9%, the survival rate is almost six times at 17.3%.
Slum survey
In a further step to ensure that people with other health conditions are addressed, it has decided to undertake a house survey in slums where all vulnerable populations — senior citizens and those with co-morbidities like diabetes, hypertension, asthma and heart disease will be identified and basic parameters will be checked. They will be referred to a non-COVID-19 peripheral hospital if treatment is needed.
Increase in testing/containment
For now, testing remains the top priority for the local government. Approximately 50,000 tests have been conducted in both public and private facilities in Mumbai. This is approximately testing 3,800 persons per million, till 26 April 2020. About 184 special screening clinics were set up by the government from 5 April to 24 in which 7,203 beneficiaries are screened and 2,494 swabs collected from suspected cases. The municipal body has also got a go-ahead to start plasma therapy. Three units have already been collected from donors for the process.
Out of the total cases in Mumbai. 1,647 cases are detected as a result of contact tracing, containment measures, fever clinics. All high-risk and low-risk contacts of COVID-19 patients are advised home quarantine. Such 92,112 persons are home quarantined and 18,807 individuals have completed 14 days home quarantine periods till 21 April.
Sanitising premises
Similarly, huge impetus has been laid on sanitizing premises. As per the Government of India guidelines, sanitisation of 53,386 premises — both government and private which include the municipal corporation building, premises of COVID-19 positive patients, medical facilities and semi-government organisations has been carried out up to 24 April in Mumbai.
Increasing institutional containment facilities
The increase in the number of asymptomatic patients have pushed the government to create gigantic Wuhan-like quarantine facilities for 25,000 asymptomatic patients have been set up in sport complexes while 350 municipal schools are being prepared to increase the capacity by 10,000 beds. For now, the Maharashtra government is preparing to meet the current numbers and the predicted future challenges - the central team has projected that Mumbai will have 75,000 cases by mid-May. While the government has put up a tough fight and is giving all it has, to face this challenge, but its only time which will tell that how it fared.
Mumbai in numbers (updated on 28 April, 2020)
Number of infected cases 5589
Number of people cured- 1015
Number of deaths- 219
COVID-19 doubling rate – 8.18
TABLE SHOWING STATUS OF TOP SIX RED ZONES IN MUMBAI WITH OVER 300 CASES
(COMPILED BY OBSERVER RESEARCH FOUNDATION, SOURCES: MCGM, MEDD, DP 2014-34)
| WARD |
New Cases (on April 25) |
New Cured (on April 25) |
Cured |
Total cases |
POPULATION (2011 census) |
Area (HA) |
DENSITY
(pp/ha) |
SLUM POPULA
TION/ |
% SLUM POPULA
TION |
| G SOUTH |
34 |
23 |
125 |
600 |
377746 |
929 |
407 |
78300 |
21 |
| E |
24 |
14 |
53 |
466 |
393286 |
717 |
548 |
77800 |
20 |
| K WEST |
32 |
22 |
64 |
373 |
748688 |
2442 |
307 |
108800 |
15 |
| L |
38 |
-8 |
32 |
371 |
902225 |
1556 |
580 |
490400 |
54 |
| F NORTH |
33 |
4 |
27 |
359 |
529034 |
1201 |
441 |
308400 |
58 |
| G NORTH |
28 |
4 |
29 |
349 |
582007 |
876 |
684 |
189600 |
33 |
| TOTAL |
|
|
|
|
3532986 |
7721 |
|
1253300 |
|
| MUMBAI (TOTAL) |
|
|
|
|
12442373 |
45828 |
|
5207700 |
|
Map of Mumbai where all the six top zones are marked as red dots
BOX: AREAS UNDER EACH OF THE SIX WARDS
G SOUTH - Worli, Worli-Koliwada, Prabhadevi, west of Sayani Road, Race Course, Arthur Road Jail, Curry Road
E WARD- Byculla, Lakdi Bunder, Kamathipura, Mumbai Central, Jijamata Zoo, Kasturba Hospital
K WEST- Juhu, Oshiwara, Gilbert Hill, Nanavati Hospital, Amboli, Yari Road, Andheri West
L - Chunabhatti, Kurla, Tilak Nagar, Kranti Nagar, Asalfa
F NORTH -Sion, Kings Circle, Pratiksha Nagar, Anik Nagar, KJ Somaiya
G NORTH - Dharavi, Mahim Creek/ Causeway, Shivaji Park
The views expressed above belong to the author(s). ORF research and analyses now available on Telegram! Click here to access our curated content — blogs, longforms and interviews.