Rooftop solar (RTS) systems are changing the dynamics and economics of the energy sector across the world. Government of India’s Ministry of New and Renewable Energy (MNRE) has ambitious plans of adding 100 GW of solar power by 2022, of which 40 GW is planned to be generated through Grid Connected RTS.
A variety of policies and incentive schemes are being formulated to upscale the RTS in the country. Mapping the RTS potentials of various regions of India can provide a sound basis for creating a roadmap to achieve the goals set by the government.
As per the MNRE, the current total installed capacity of solar power in India is at 16,611 MW (as on 30/11/2017). Out of this capacity, about 864 MW comes from the RTS installations. Approvals of another 1,767 MW RTS projects have been issued. India’s progress on the large-scale solar installation has been commendable with another 6,500 MW to be added by March 2018.
However, the country is still lagging behind on the RTS front. Hence, to realise the target of 40 GW by 2022, there is a need for many urgent policy reforms.
MNRE’s SRISTI
The MNRE had recently set out a new draft policy paper to accelerate its RTS power programme. The concept stated in the paper is called Sustainable Rooftop Implementation for Solar Transfiguration of India (SRISTI). The scheme brings a policy change by making distribution companies (Discoms) the front runners in the RTS implementation by providing them performance-linked monetary support. The draft document says that ‘discoms will be the sole implementing agency for the implementation of rooftop solar scheme of the MNRE in the next Phase’. This scheme has been proposed to ensure that India achieves the 40 GW target within time.
Year-wise targets set by the MNRE draft policy
| Year |
2015-16 |
2016-17 |
2017-18 |
2018-19 |
2019-20 |
2020-21 |
2021-22 |
|
Target
(in MW) |
200 |
4,800 |
5,000 |
6,000 |
7,000 |
8,000 |
9,000 |
Year wise Rooftop Solar Targets till 2022
Sector-wise targets
| Sector |
Targets (in MW) |
| Commercial & Industrial |
20,000 |
| Institutional |
5,000 |
| Residential |
5,000 |
| Social |
5,000 |
| Government |
5,000 |
Sector wise Rooftop Solar Targets set by MNRE draft policy – SRISTI
Role of discoms
The draft policy lists a few duties to be undertaken by the discoms like rooftop assessment, bid process management, technical studies, up-gradation of digital systems, providing time-bound services to RTS consumers, inspection and monitoring of RTS plants, online database management of commissioned capacity, consumer awareness and publicity, ensuring availability of net-meters, empanelled vendors along with rates, providing grid connectivity, etc.
Currently, many of these tasks are being conducted by various entities of the RTS ecosystem in the country. The discoms, along with institutions like the Centre and State energy ministries, State nodal energy agencies, Centre and State electricity regulators, academic institutions, market surveyors, industry players, RTS consultants, etc. are performing these functions in silos. What is missing is a single platform for such process to be streamlined for proliferation of the RTS nodes.
Rooftop mapping and its benefits
In order to realise the stated targets, there is a need for sector-wise reports detailing various roadmaps to achieve the stated targets. One of the basic building blocks towards such a study will be assessing the RTS potential that metropolitan cities, urban areas, peri-urban areas and rural regions possess. This shall aid all stake-holders viz. government bodies at national and local levels, discoms, project developers, installers, financing institutions and consumers to access detailed information and data of the RTS sector.
- Government bodies can frame improved sector-wise policies
- RTS potentials along with the data of existing electricity network infrastructure can help analyse the impact on distribution transformers and the grid. Discoms can study the effects of RTS electricity penetration and optimise their finances
- RTS developers will have a readily available market survey
- Such rooftop mapping data can result in studies of shading impact on potential systems and avoid incorrect installations and thereby help RTS installers to make optimal system designs
- Consumers will no longer have to look for consultants to know the viability of a RTS plant for their roof. They will know the exact area available to them for installation, the amount of electricity the plant will generate and the payback period of the investments they make.
Examples of solar maps and RTS Dashboards
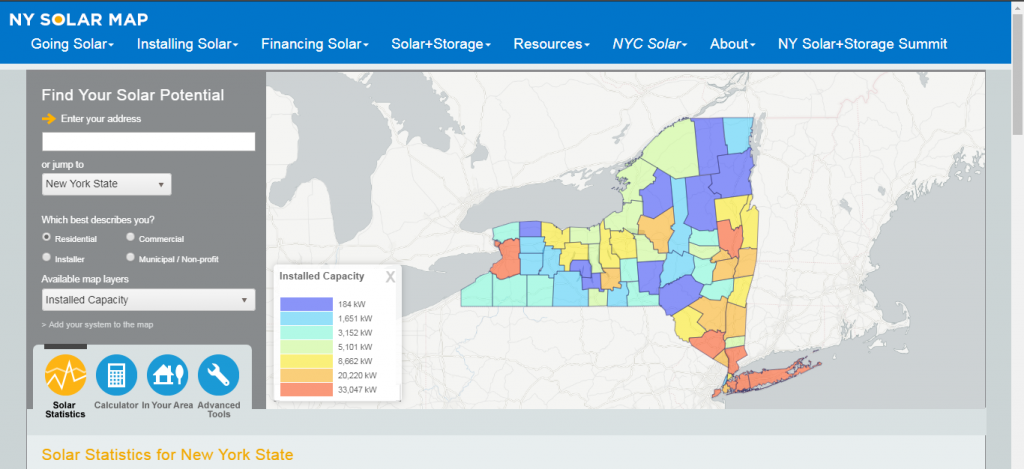
We could borrow a page out of the City University of New York’s (CUNY) ‘Sustainable CUNY’ programme that has developed a dashboard (see below) showing statistics on the growth of RTS in the New York State, with county and city-level maps, charts, and several interactive features. The NY Solar Map and Portal is the state’s one-stop shop for customers, installers, and municipal leaders to access RTS information. It also provides step-by-step guidance and information on the RTS. The map has a growing number of layers, showing solar deployment, costs, utility data, permitting regulations and the location of battery storage systems in the New York City. A cost and performance calculator helps to estimate the size and performance of a system on any building in the state. As part of an assessment of energy resiliency, CUNY is investigating optimal locations for siting ‘solar + storage’ on critical facilities.
 New York Solar Map and Portal website
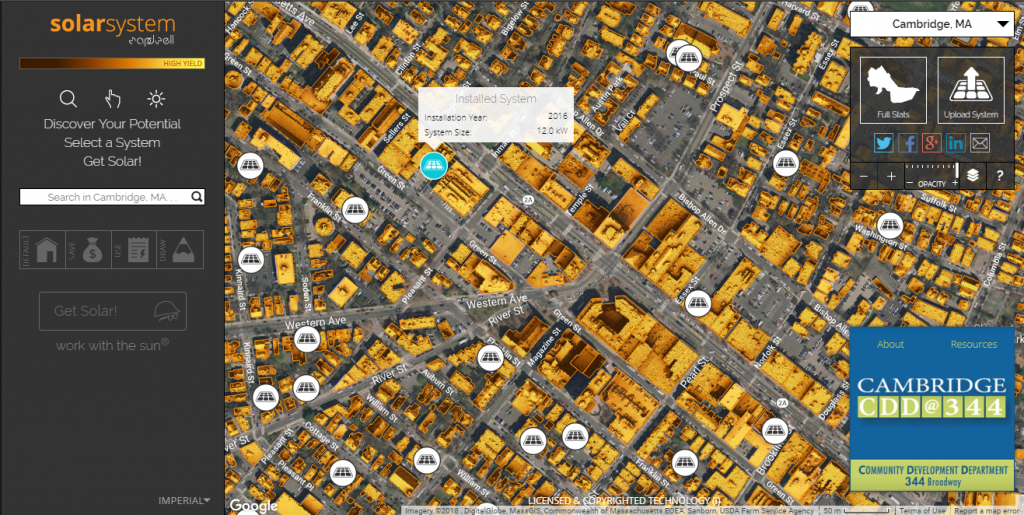
Another learning can come from the Massachusetts Institute of Technology (MIT) spinout Mapdwell (see below) which is mapping solar potential for entire cities and provide a cost-benefit analysis for each rooftop. On Mapdwell’s satellite-map website, individuals can click on a rooftop to receive information about the installation price, energy and financial savings, and the environmental impact. Mapdwell has mapped eight cities across the US and are currently expanding to all major metropolitan areas. Mapdwell also provides city-level statistics on high-yield potential solar capacity and other metrics, giving municipalities a clearer picture of the costs and savings of promoting solar power. For example, Mapdwell estimates that Boston has about 1.5 GW of untapped solar capacity, Washington D.C. has 2 GW and San Francisco roughly 3 GW.
 Mapdwell website dashboard for the city of Cambridge, Massachusetts
Rooftop solar mapping in India
There are various techniques to map areas for estimating RTS potentials. Some of the present techniques involve the use of tools like Geographic Information Systems (GIS), Laser Interferometry Detection and Ranging (LIDAR) and high resolution aerial photography. These techniques require considerable investments in cutting-edge infrastructure and technologies. The other effortless geographical data available is via Google Maps, Bing Maps, Wikimapia, etc. These resources make available vast amount of information for free, but not in detail. Assessment tools can be used on such data to estimate the RTS potentials of various regions.
In India, the topographies of various provinces, urban to rural, vary significantly. Most of the metropolitan cities themselves have a huge diversity in rooftop arrangements. Additionally, most of India’s cities have witnessed unplanned urbanisation in the last decade. Such unplanned urbanisation shows lack of clearly demarcated areas for different usages. Managing to categorise buildings by the type of usage is indeed a challenge in most Indian cities. Also, plotting precise shadow-free rooftop areas is a key task in deploying large capacity of RTS systems.
The city of Bangalore has made a move in the direction of mapping the city through LIDAR. The project has been jointly undertaken by Bangalore Electricity Supply Company (Bescom), Karnataka Renewable Energy Development Limited (KREDL) and the Centre for Study of Science, Technology and Policy (CSTEP). The budget for the project is Rs three crore. However, this will not suffice to map all the eight districts under Bescom. Bridge to India (BTI) has already mapped the cities of Delhi and Patna to estimate their rooftop potentials. ORF, in collaboration with IIT Bombay’s National Centre for Photovoltaic Research and Education (NCPRE) and Centre for Urban Science and Engineering (CUSE), IEEE Bombay Chapter and BTI has estimated the RTS potential for Greater Mumbai.
The Mumbai mapping study has been done making use of minimal resources, where all the mapping was crowd sourced through the students from the engineering colleges. This ensured that while the city was able to get its RTS potential mapped, the students got a hands-on experience in the field. These estimation studies, conducted via varying methodologies, give a wide range of options that can be taken up for replication across all Indian cities and towns.
Mapping the way ahead: Building virtual platforms
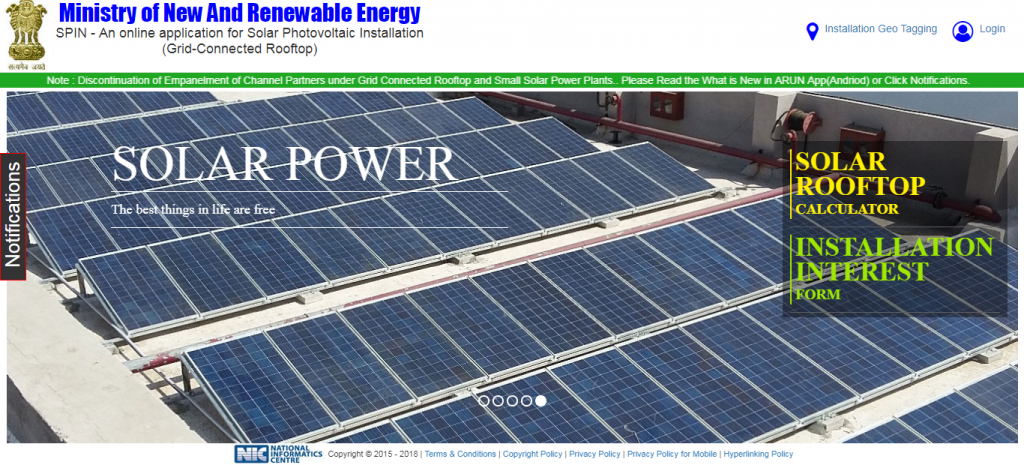
To make the most optimal use of resources for RTS mapping, the cheaper, simpler and replicable techniques should be initially opted to assess the less accurate sector and the region-wise potentials. Once this data is available, various segments can be prioritised for the more expensive mapping techniques to generate accurate RTS potentials. The State nodal energy agencies or academic institutions can undertake this work and feed it to a platform which will be accessible to other stakeholders. The MNRE has already worked in this direction to set up a website, SPIN (Solar Photovoltaic Installation), which provides generic estimates of a RTS installation. This website itself can be upgraded to give detailed information of the RTS potentials of different regions along with a plethora of other data that concerns the RTS sector.
 Solar Photovoltaic Installation (SPIN) website developed by MNRE
SPIN can become a dashboard for citizens, industry players and government bodies to gain details on the RTS potentials. States and cities can also establish their own websites. Experts in the field of GIS should be taken on board to explore mapping exercises. There needs to be capacity building of the nodal personnel in the RTS field on this front. Mapping exercises can help in the development of upcoming city infrastructure to make it RTS friendly. Mapping can provide data on typical roof forms which can lead to innovative RTS models for installations. Awareness of various government schemes and information on procedures to set up RTS can be made handy through such a website.
Benefits of mapping for the discoms
Discoms have never been in favour of large RTS deployment. They fear of losing their prime customers to such installations, which impact their revenues. But the fact is RTS mapping can help them optimise their economic models to maintain their finances.
Discoms have to reduce their Aggregate Technical & Commercial (ATC) losses under the Ujwal Discom Assurance Yojana (UDAY) scheme. RTS mapping can help them channelise installers towards areas where such ATC losses can be reduced. The Central Business Districts (CBDs) in urban areas consume substantial amounts of electricity in day hours. Discoms and State electricity boards struggle to meet peak electricity demands in the day in such CBDs. The RTS maps of CBDs can help strategise shaving of these peak demands.
It is a worthy sign that the Central government is committed to provide incentives worth Rs 23,450 crore through the SRISTI scheme. But the prospective policy can be realised through variety of data intermingling on platforms which help find the best suited sites for RTS installations.
With digitisation of the energy sector and Internet of Things poised to grow in the future, India should proactively upscale efforts to define processes by commencing an initial step of mapping its RTS potential. Any step towards achieving growth in the RTS sector, through a scheme like SRISTI or other policy interventions, can be fulfilled only through a strong foundation of mapping RTS potentials.
The author is an Associate Fellow at Observer Research Foundation, Mumbai
The views expressed above belong to the author(s). ORF research and analyses now available on Telegram! Click here to access our curated content — blogs, longforms and interviews.


 New York Solar Map and Portal website
 Mapdwell website dashboard for the city of Cambridge, Massachusetts
 Solar Photovoltaic Installation (SPIN) website developed by MNRE
 PREV
PREV

