The novel coronavirus that had affected approximately 600 people by March 25; today, has trickled into each state and union territory (UT) of India barring the Lakshadweep Islands—placing India as the third most affected country in the world. In the week between August 04-10, India recorded more daily cases than the United States and Brazil.
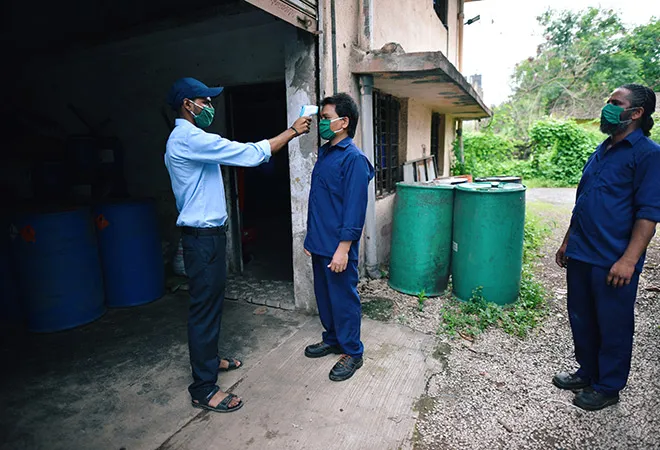
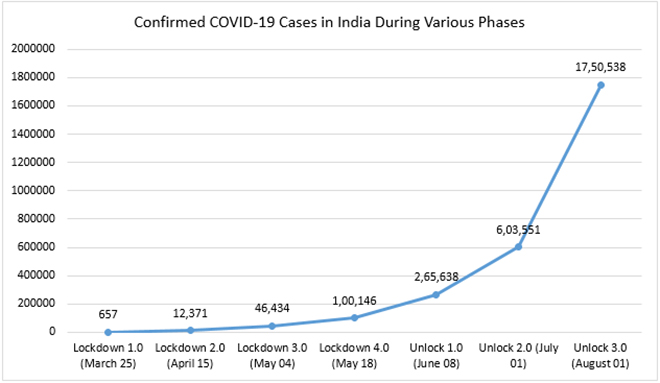
June 8 marked the first phase of the re-opening of the economy. At the time, the country had 2,65,638 confirmed COVID-19 cases. By August 1, which was the beginning of “Unlock 4.0”, India had 17,50,538 confirmed cases. The easing of restrictions during each phase of re-opening has led to an increase in business activities, movement across cities, and inter-state travel with a consequent increase in human interaction. Amidst these activities, the widespread transmission within communities has deepened, bringing to the fore the need for mask wearing, hand hygiene and physical distancing.
While the rise in COVID-19 cases in recognised hotspots like Maharashtra, Tamil Nadu, Uttar Pradesh has continued, new hotspots have emerged, where the disease is even less controlled. States and districts that managed to successfully contain the spread of the virus during the preliminary spread are now witnessing an unprecedented surge. In the week between August 06-12, Karnataka, Bihar, West Bengal, and Assam recorded 45,045, 25,821, 20526, and 18,554 cases respectively. To understand the sudden spike in cases, Google Community Mobility Reports (GCMR) are important tools to study the interplay between the increase in mobility due to relaxed restrictions and the increase in cases (taking into account the incubation period of the virus). They capture the change in mobilty patterns (positive/negative percentage) compared to the baseline days (baseline day = median value from the five weeks, from 3 January — 6 February 2020). A similar trend can be seen across states, i.e., an upward trend in mobility levels followed by a steep rise in cases.
 Source: https://www.covid19india.org/
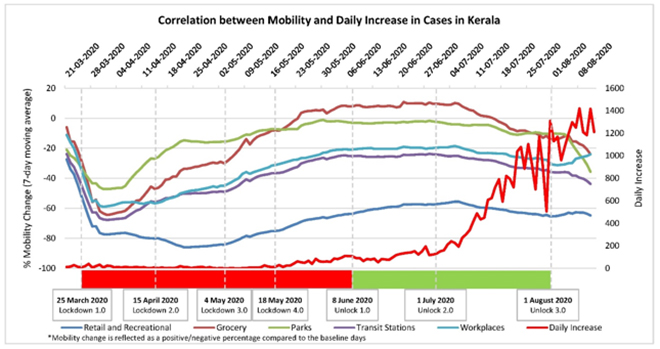
A Post-Kerala Model Spike?
The much-adulated success of the “Kerala Model” in containing the spread of the virus is being questioned. Through aggressive testing, tracing and isolating of primary and secondary contacts, the situation seemed to be in control in the first half of the year. However, the state has observed a steady increase in the number of cases since July. A state that took three months to reach 10,000 cases, reported another 15,000 cases in less than three weeks. While some experts say that the increase is a result of the reverse migration of labourers from different parts of the country and abroad, officials believe it is due to the negligence of the people in Kerala, who seem to have let their guard down. This has resulted in amplification of localised transmission. On April 1, the mobility across Transit Stations and Workplaces dropped to -67.71% and -58.71% respectively. On June 1, the same increased to 26.42% and -21.71%. The increase in cases can be corroborated with the increase in mobility that is evident during June.
 Source: Google Community Mobility Reports / https://www.covid19india.org/
Worsening Situation in Bihar
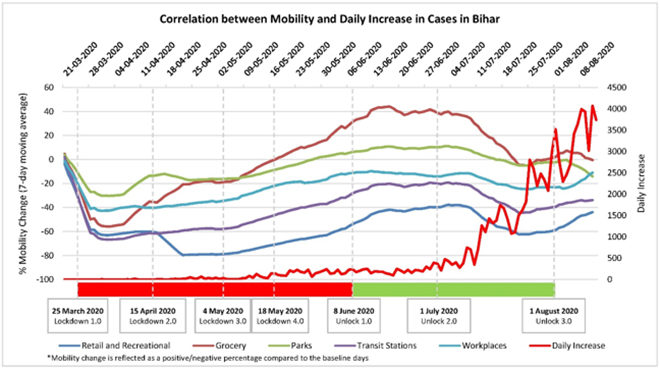
Bihar had recorded a mere 9,808 cases by the end of June, whereas on August 20, the total tally stood at 1,12,759. The alarming rise in cases in Bihar can be attributed to several reasons. Firstly, the reverse migration of labourers from the big cities to their homes in remote areas of Bihar, wherein, it was proved difficult to trace and isolate them. Secondly, due to the social stigma prevailing around COVID-19 and mandatory quarantine conditions, migrants refrained from informing the local authorities upon their arrival at their home destinations. As a result of this, the vicious cycle of infecting people they came in contact with began. For instance, a health department report in Bihar found that six people were responsible for infecting 164 more. Thirdly, recreational activities, like playing cards in groups, have been a super-spreader in Bihar.
 Source: Google Community Mobility Reports / https://www.covid19india.org/
Additionally, relaxations on inter-state travel, including bus movement without a mandatory pass, have led to an increase in the movement of people from place to place. As a result, districts that were earlier “COVID-Free” are now suddenly witnessing a surge. Despite the creation of 89 hotspots in Patna alone, even after the visit of a three-member committee from New Delhi, the number of cases is still rising. GCMR data suggests that negligence and ignoring of social distancing and stay-at-home orders continue to be the causes for the grave situation in Bihar. To this end, on April 1, the mobility across Parks, Transit Stations, and Workplaces was -30.1%, -66.6%, and -42.6% respectively. Whereas on July 01, there was a remarkable increase - 10.4% (Parks), -20.4% (Transit Stations), and -14% (Workplaces). The recent notification by the state government which imposed a lockdown from August 1-16 is a step forward; following which, local authorities will’ need to be more vigilant towards restricting non-essential movement and mass gatherings.
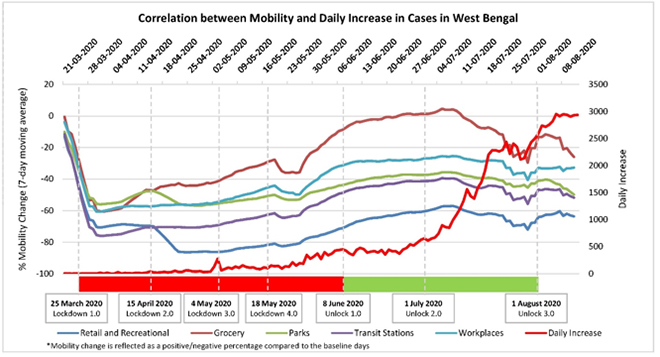
West Bengal as an emerging new Hotspot?
The state that had reported only 18,560 cases by June 30, today stands at 1,25,922—placing itself as the seventh most affected state in the country. From July 12 to August 12 alone, the state recorded 75,873 new cases. Schools, colleges, cinema halls, theaters, bars, and large congregations are still prohibited. With Unlock 3.0, restrictions on movement during the night have been lifted, and yoga institutes and gyms outside of containment zones have also been allowed to re-open. While flights to Kolkata from six cities (Delhi, Mumbai, Pune, Chennai, Nagpur, and Ahmedabad) are banned until August 31, what was more striking was that Independence Day celebrations had been allowed in the hope that social distancing norms and other guidelines issued by the government would have been to be adhered to.
 Source: Google Community Mobility Reports / https://www.covid19india.org/
To contain the spread of the virus, the state government has been following a practice of imposing a lockdown two days every week. While the rationale behind this is to restrict the movement of people, all essential and non-essential economic activities in West Bengal have been functioning with minimal restrictions since unlock 1.0. On April 1, the mobility across Transit Stations and Workplaces dropped to -76% and -60.28% respectively. Whereas on August 01, this mobility increased to -46.85% and -32.85%.
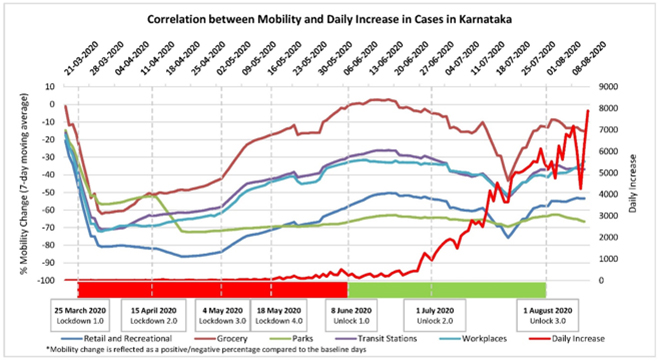
Karnataka’s 3T Strategy Wearing Out
Despite recording 72,379 cases in August alone, Karnataka has moved towards re-opening the economy and lifting restrictions such as allowing inter-state travel, and lifting of Sunday curfew and night curfew since August 1. Karnataka’s three-pronged approach Test, Trace and Treat was successful in containing the initial spread of the virus. The state had 15,242 confirmed cases by 30 June, which increased to 2,49,590 on August 20, placing Karnataka as the fourth most affected state in India. While the initial spread was only limited to a few cities and districts only, recent reports show that many districts have seen the emergence of new infections due to relaxations in inter-district travel.
 Source: Google Community Mobility Reports / https://www.covid19india.org/
The reasons for the recent spike in cases in Karnataka have been the centre of focus in the state. Some believe that it is due to Bruhat Bengaluru Mahanagara Palike’s (BBMP) negligence, while GCMR data has documented the correlation between the increase in mobility as businesses return to normal and people letting their guard down with the spike in cases. The mobility across Retail and Recreation and Transit Stations that dropped to -80.85% and -70.85% respectively on April 01, increased to -54% and -31.57% on July 01.
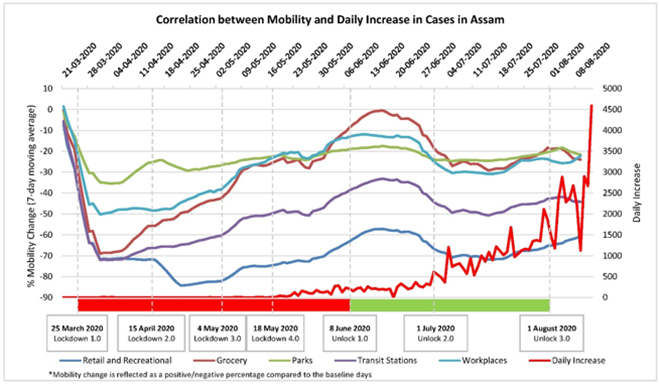
Assam’s uptick in cases
Of the total cases reported in Assam (71,796), ~84% of the cases have been recorded in July and August alone. To this end, GCMR data indicates that during the four different phases of the lockdown, restricted movement can be attributed to the contained spread of the virus. As Assam started re-opening its economy from June 1, there has been an increase in the movement of people. On May 1, the mobility across Retail and Recreation and Transit Stations dropped to 82.42% and 61.14% respectively. While on July 01, this mobility increased to 67.47% and 45.43%.
 Source: Google Community Mobility Reports / https://www.covid19india.org/
On August 13, Assam was one of the biggest contributors to the daily confirmed COVID-19 cases. Despite the uptick, inter-district travel is permitted from Monday to Friday on buses with 50% capacity. City buses and other public transport, which were disallowed during the lockdown, have been permitted to resume services with limited occupancy from August 16.
An increase in mobility levels can add to the pace of the virus spread in two ways. Firstly, an increase in transit stations where adhering to social distancing is not guaranteed, and secondly, an increase in footfall to workplaces, retail and recreational activities, parks, and grocery stores will induce closer human interactions, thereby, aiding the spread of the virus. GCMR data provides evidence that shows a possible link between mobility levels and the spread of the virus. The data indicates that the lockdown measures taken by the Central Government, including physical distancing measures, mandating masks, and restrictions on non-essential mobility were efficient tools to limit the spread of COVID-19 and also served to prevent the overburdening of the healthcare systems.
However, this step has had a detrimental impact on the economy as well as poverty levels. There was a need to resume business activity to kick start the economy and improve livelihoods, as well as focus attention on voluntary compliance of practices like hand hygiene, mask wearing, and maintaining physical distance while venturing out. The question remains, while mobility restriction has been an important public health tool adopted by several countries, how do we strike an optimal balance between the probable (positive) impact on public health and the hostile effects on freedom of movement, economy, and society?
*Analysis has been done based on Mobility Data from 21 March to 09 August and Daily Increase in Cases from 21 March to 13 August.
The views expressed above belong to the author(s). ORF research and analyses now available on Telegram! Click here to access our curated content — blogs, longforms and interviews.