
This article is part of the series Comprehensive Energy Monitor : India and the World
Most climate scientists believe that carbon dioxide (CO2) emissions must be reduced by at least 50 percent by 2050 to avoid the most dangerous impacts of global climate change. To achieve this objective while also continuing with current lifestyles, countries must decarbonise by reducing the amount of CO2 emission intensity (CO2 produced for each unit gross domestic product ) at greater than 4 percent per year. This seems like an achievable target but, this rate is three times the 1.3 percent per year global average rate sustained since the 1860s. Most of the reduction in CO2 emission intensity was achieved without any radical policy interventions. Fuels with higher carbon to hydrogen ratio such as firewood were replaced with cheaper fuels with lower carbon to hydrogen ratio such as coal, oil, and gas. The challenge today is that a shift must be engineered artificially through policy in an environment where no one is sure what alternative fuels one can shift to without compromising on fossil fuel lifestyles.
In 2010, India committed to a reduction of CO2 intensity by 20-30 percent of 2005 levels by 2020. This called for India to achieve an average reduction of over 2 percent in a year. India’s CO2 emission intensity fell from 1.005 in 2005 to about 0.849 in 2020 which is an annual decrease of nearly 1.03 percent and a total decline of over 15 percent (GDP in constant dollars). In 2015, India committed to reducing its CO2 intensity by 33-35 percent of 2005 levels by 2030 as part of its offer to the Paris Agreement. India is on course to achieve this target and if current trends in CO2 intensity decline continue, India is likely to overachieve the goal by a huge margin.
The challenge today is that a shift must be engineered artificially through policy in an environment where no one is sure what alternative fuels one can shift to without compromising on fossil fuel lifestyles.
Some countries in Organisation for Economic Cooperation and Development (OECD) have achieved lower rates but this was not necessarily because of a shift towards alternative fuels or greater efficiency in using energy as a study on OCED countries that examined historic decarbonisation rates reveals. Structural changes in the economy played a part. Overall, the study shows that at a national scale, achieving a 4 percent per year or greater rate of decarbonisation is unprecedented in recent history. Decarbonisation rates sustained from 1971-2006 range across the 26 OECD nations from a 3.6 percent per year decline in CO2 emissions per unit of GDP in Sweden to a 0.7 percent per year increase in carbon intensity of the economy in Portugal. The un-weighted average rate for all 26 nations was 1.5 percent per year, only 16.5 percent faster than long-term global decarbonisation rates (1.3 percent per year).
Only five nations achieve sustained decarbonisation rates more than double the long-term global historic average: Sweden (at 3.6 percent per year), Ireland (at 3.2 percent), the United Kingdom (UK) and France (each at 2.8 percent), and Belgium (at 2.6 percent). Six other nations achieved rates between 50 and 100 percent greater than the global average rate: Germany (2.5 percent per year), the United States, Denmark, and Poland (each at 2.3 percent), Hungary and the Netherlands (at 2.0 percent).
In contrast to Sweden and France, Ireland and the UK relied principally on gains on energy intensity to drive overall de-carbonisation. Nearly 89 percent of decarbonisation in Ireland and 78 percent in the UK derive from reductions in energy use per unit of GDP. Normally, improvements in energy intensity are considered a proxy for improvements in end-use energy efficiency. This is not necessarily true. Changes in the sectoral makeup of a nation’s economy can significantly impact the energy intensity of economic output, as relatively energy-intensive agriculture or industry gives way to services. Improvements in the energy efficiency of power generation technologies will show up as changes in energy intensity trends, even though such measures are related to energy supply-side policies and factors.
Changes in the sectoral makeup of a nation’s economy can significantly impact the energy intensity of economic output, as relatively energy-intensive agriculture or industry gives way to services.
In the case of the UK, both forces were seen to be prevalent. Manufacturing as a share of UK GDP declined from 28 percent in 1971 to 11 percent in 2006, a 59 percent decline, nearly double the average decline for OECD nations. Imports as a share of UK GDP also rose notably, from 21 percent in 1971 to 30 percent in 2006, although this compares favourably to the climb in imports in other OECD nations over this period.
Additionally, the UK electricity mix shifted heavily from coal-fired power to natural gas in under the ‘dash for gas’ policy in the 1990s, after Margaret Thatcher decided to punish coal mining unions using the newly abundant production of North Sea gas fields. Owing to the lower carbon output of natural gas relative to coal, the ‘dash for gas’ initiative contributed to the decarbonisation of the UK energy supply, but it also helped drive energy intensity gains, as older coal-fired power stations were replaced by modern, combined cycle natural gas plants with operating efficiencies almost double that of an older coal-fired plant.
Similarly, Ireland underwent a substantial economic transition during the period 1971 to 2006. While manufacturing held a relatively constant share of Ireland’s GDP over this period, the nation saw the share of GDP derived from the relatively energy-intensive agriculture sector fall from 15 percent in 1971 to just 1 percent in 2006. At the same time, the share of GDP from services other than retail and wholesale trade, restaurants and hotels roughly doubled in share, from 22 percent of Ireland’s economy in 1971 to 41 percent in 2006. It is, thus, conceivable that sectoral economic transitions account for the large bulk of Ireland’s improvement in energy intensity over this time.
Nations experiencing the fastest rates of energy intensity improvement are characterized more by significant shifts in the sectoral makeup of their economies, rather than the aggressive pursuit of energy efficiency measures, including Ireland, the UK, the US, and Poland.
Sweden and France achieve sustained accelerated improvements in the carbon intensity of energy supply of 2.5 percent and 2 percent per year, respectively, from 1971 to 2006, roughly double any other OECD nation over this period primarily through a shift in power generation from fossil fuels to nuclear power. Except Ireland, in no cases were sustained energy intensity improvement rates observed much more than 2 percent per year, with most nations experiencing rates ranging from 1 to 1.5 percent per year. These rates fall far short of the assumed global rates of energy intensity gains more than 2.5 percent per year in global mitigation predicted in the scenarios developed by the International Energy Agency.
Nations experiencing the fastest rates of energy intensity improvement are characterized more by significant shifts in the sectoral makeup of their economies, rather than the aggressive pursuit of energy efficiency measures, including Ireland, the UK, the US, and Poland. This indicates the substantial contribution of sectoral transitions to energy intensity improvement rates and makes it difficult to discern the impact of energy efficiency policy efforts on energy intensity trends. In India too, the structural composition of growth shifting away from industry and move towards less energy intensive services sector was among the key reasons for gains in CO2 emission intensity.
Looked at in isolation from the rest of the world the figures from OCED countries may give a false sense of optimism that de-carbonisation goals are within the realm of the achievable. But when we look at the world as a complete system it becomes clear that sectoral shifts from manufacturing to services in OECD countries was possible because of the export of carbon intensive manufacturing to the developing world. Japan had an explicit policy of locating heavily polluting industries in foreign countries. European Union (EU) reduced carbon dioxide emissions by 6 percent from 1990 to 2008 by exporting production to developing countries. In the same period, EU import of embodied carbon from developing countries increased 36 percent. 18 percent of embodied carbon was through exports from China. The export of pollution does not contribute to an overall reduction in carbon emissions. It merely transfers carbon guilt from one country to another. But in a world which allocates carbon mitigation responsibility by country exporting pollution to another country appears to be a strategic means to score climate points.
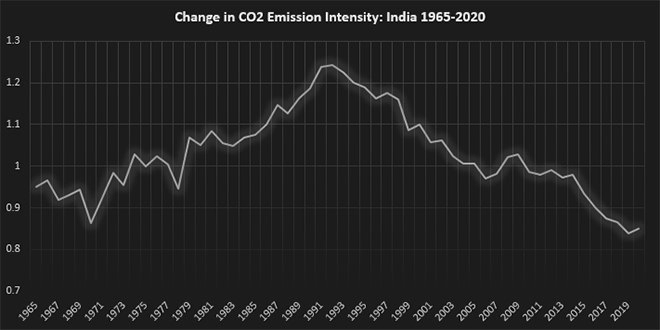 Source: The unit for CO2 intensity per unit of GDP is Tonnes/1000$ (constant 2010 US$).
The views expressed above belong to the author(s). ORF research and analyses now available on Telegram! Click here to access our curated content — blogs, longforms and interviews.