Introduction to the Region
The Indian Ocean represents almost 20% of world’s ocean area and connects shores of three continents. The region consists of 36 countries, with the exception of Australia, all developing economies, with total coastline area of 66,526km, i.e. 40% of global coastline.
Following map indicates container port throughput, the total number of containers handled by a port, per country, expressed in Twenty-foot Equivalent Units (TEUs), and a share in the world coastline area for individual countries in the region.
Source: UNCTADStat
Trade routes & infrastructure
Indian Ocean hosts one of the most important global maritime routes connecting Far East with Europe. It passes though the South China Sea, Strait of Malacca, Indian Ocean, Red Sea, Suez Canal and Mediterranean until Atlantic, and carries majority of the ultra-large containerships. The Ocean’s maritime routes are pivotal for the worldwide supply of energy. It is estimated that almost 40% of energy supply is transported from the Persian Gulf to Europe and Asia through its waterways.
Singapore Port, the most important in the region and second busiest port in the world based on container traffic and cargo tonnage, is located in the Strait of Malacca. Linking Indian and Pacific Oceans, the Strait plays a pivotal role in the global commerce.
The map presents the major maritime routes and ports in the Indian Ocean.
Source: American Association of Port Authorities, World Port Rankings 2014;
Merchant fleet
Indian Ocean Rim countries together held 12% (approx. 20000 ships) of world merchant fleet in 2015, including over 4,000 general cargo, 2,000 oil tankers and almost 1000 container ships.
The chart presents merchant fleet structure of six top countries in the region.
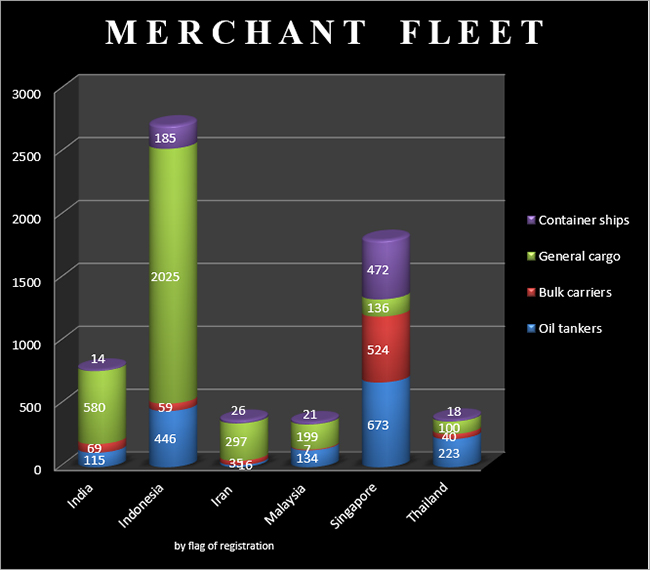 Source: UNCTADStat
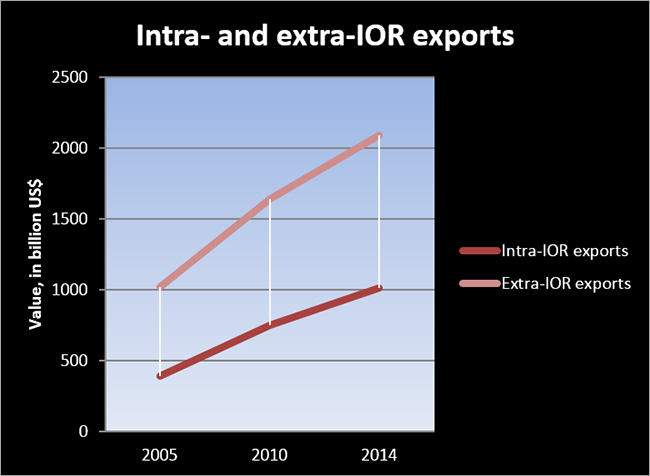
Who trades with whom in the Indian Ocean?
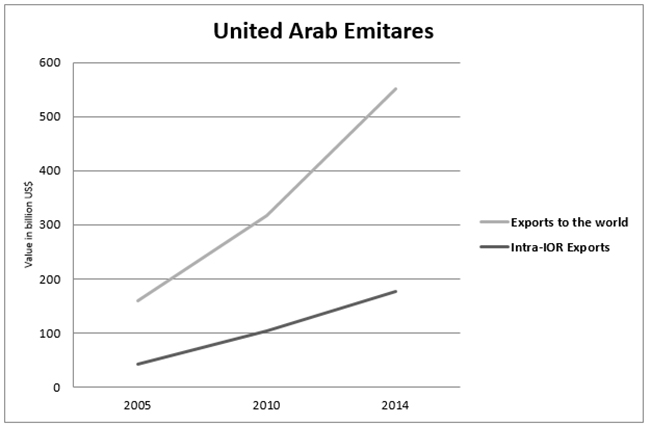
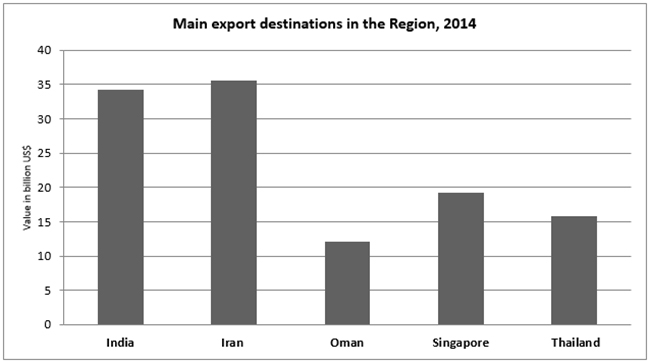
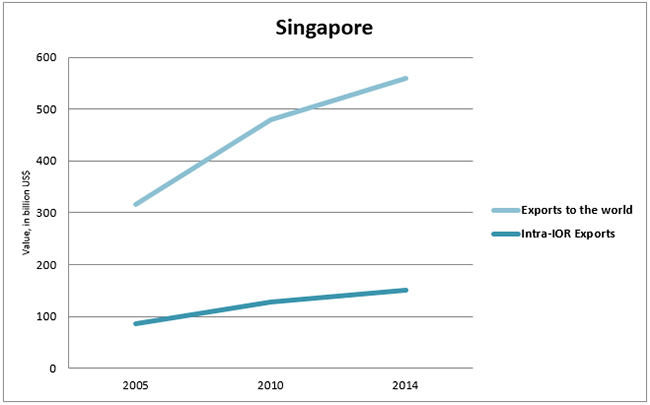
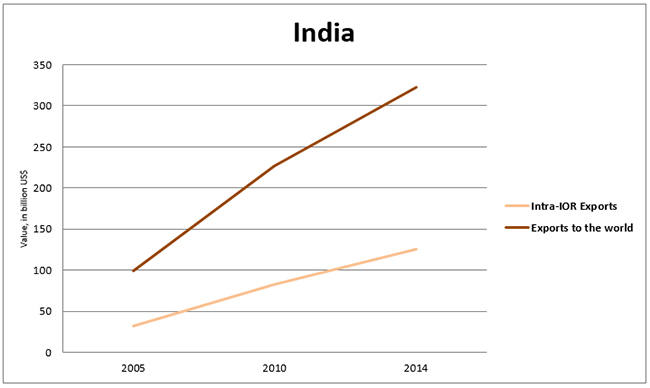
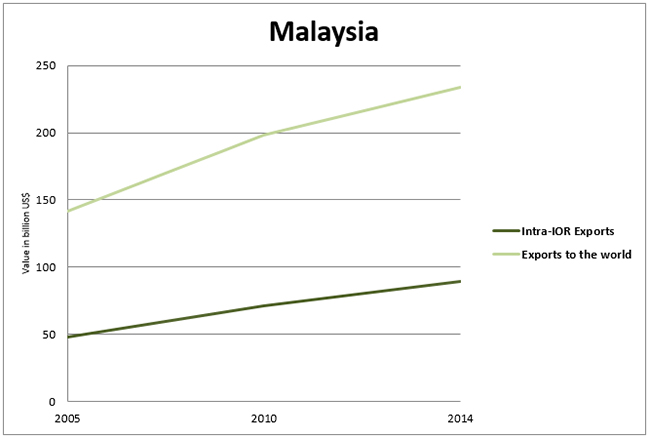
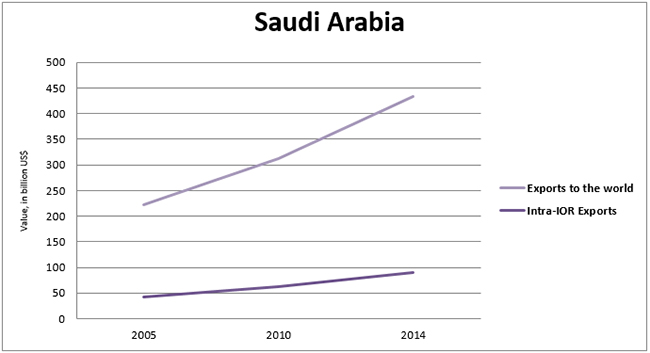
Intra-Indian Ocean trade, although increased in the last decade, remains modest. From US$ 391,098 million in 2005, the intra-IO exports grew to reach over US$ 1 billion in 2014, i.e. 30% of region’s total exports to the world. The United Arab Emirates, the biggest trader in the region in 2014, directed almost 50% of its exports to other IO countries, followed by Singapore, India, Malaysia and Saudi Arabia.
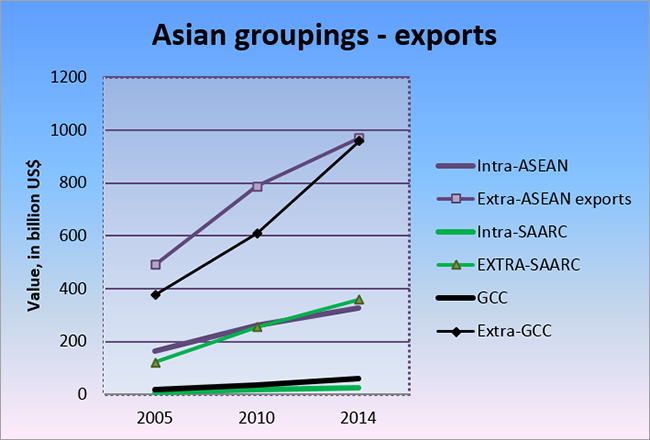
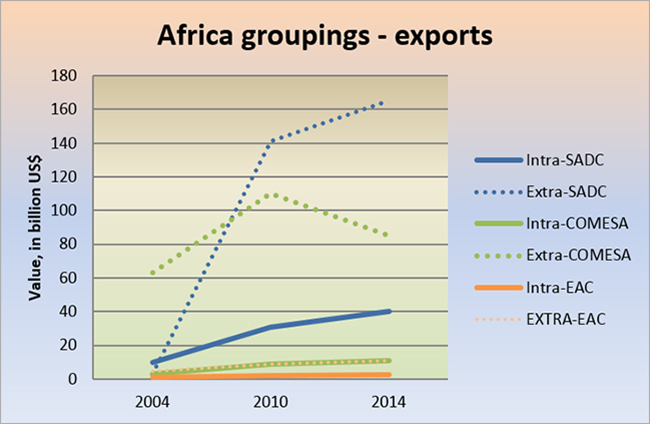
With the exception of ASEAN, which internal exports in 2014 accounted for almost 25% of its total exports to the world, the intra-group trade constituted less than 10% of total exports for SAARC, GCC, COMESA, and less than 20% for SADC and EAC.
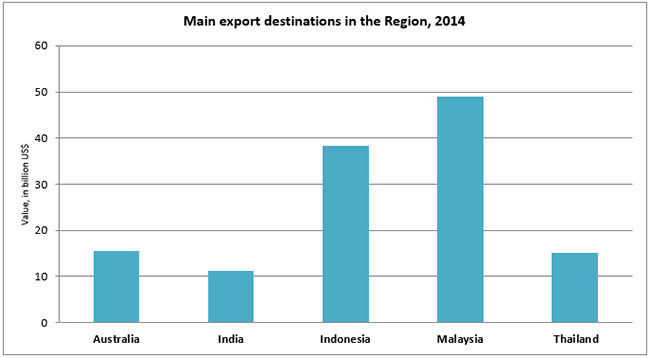
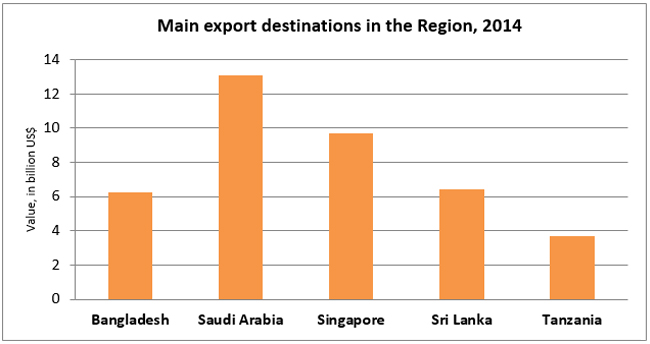
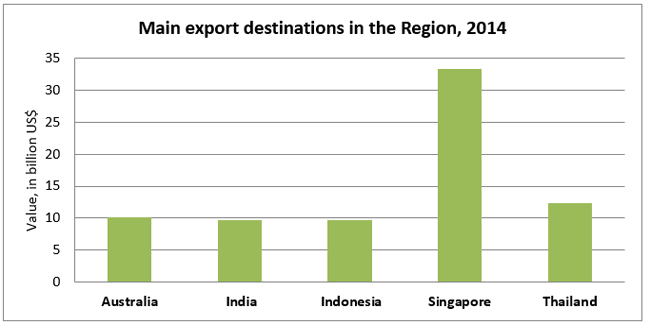
Top performing exporters & their destinations
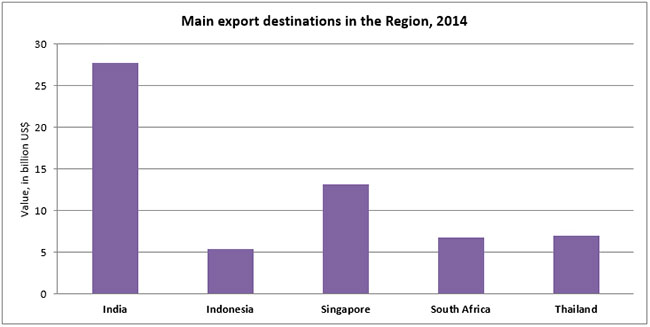
Source: UNCTADStat
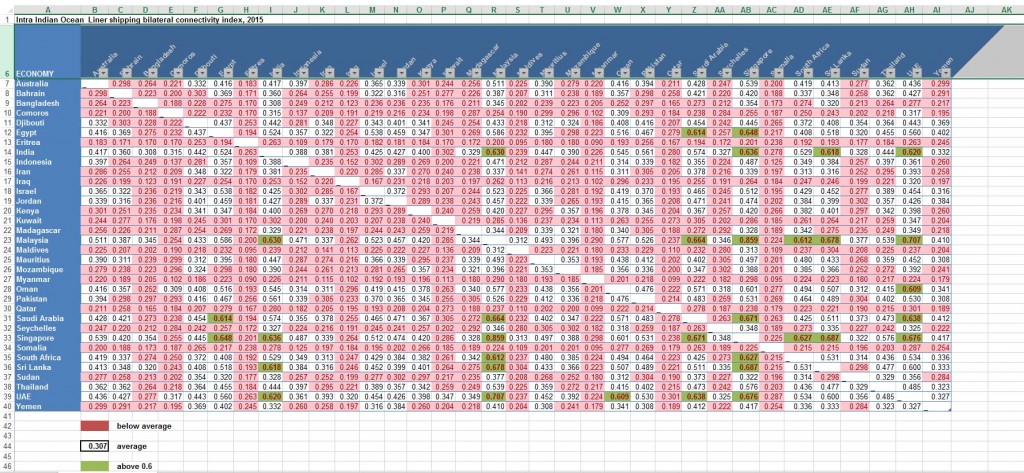
Intra-Indian Ocean liner shipping connectivity
Modest intra-Indian Ocean trade is reflected by UNCTAD’s Bilateral Liner Connectivity Index, which measures liner shipping connectivity between two countries (0 : min - 1 : max). The average bilateral connectivity between the Indian Ocean countries remains low (at 0.307) with the exception of Singapore, which enjoys the highest index with other partners in the regions (0.859 with Malaysia).
 Source: UNCTADStat
Intra Indian Ocean_Liner shipping bilateral connectivity index, 2015
Source: UNCTADStat
Intra Indian Ocean_Liner shipping bilateral connectivity index, 2015
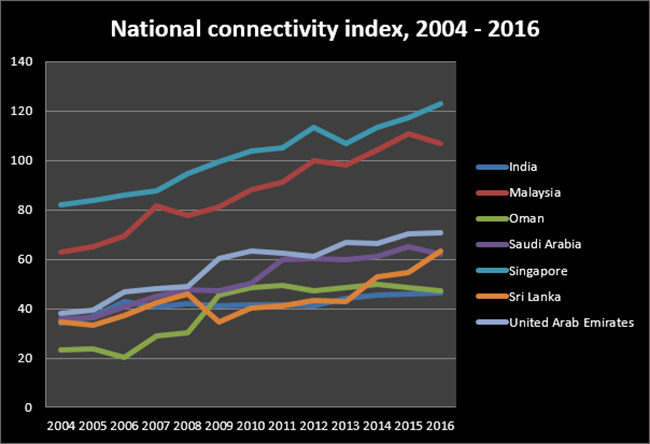
Indian Ocean connectivity with rest of the world
An increase of the National Connective Index for the Indian Ocean States indicates their growing integration into the global liner shipping networks in the last decade. Yet, the countries from the region maintain the most intensive shipping connections with China and European economies.
The chart presents the trend of the Liner Shipping Connectivity Index, which indicates a country's integration level into global shipping networks, for top most connected countries in the Indian Ocean Region from 2004 to 2016.
 Source: UNCTADStat
The map presents ten most connected countries in the region and their top partners.
Source: UNCTADStat
Source: UNCTADStat
The map presents ten most connected countries in the region and their top partners.
Source: UNCTADStat
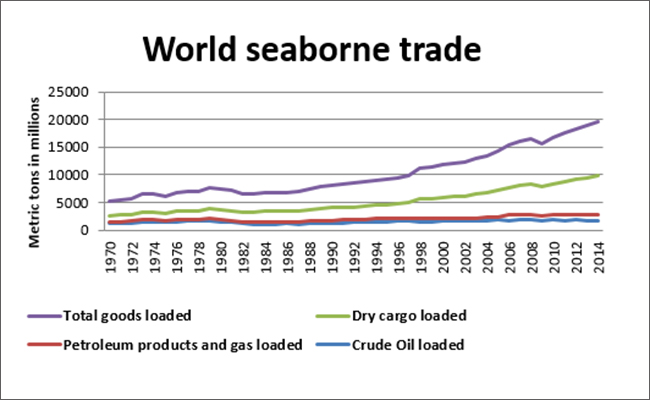
Recent maritime trends: a temporary phenomenon or a new norm?
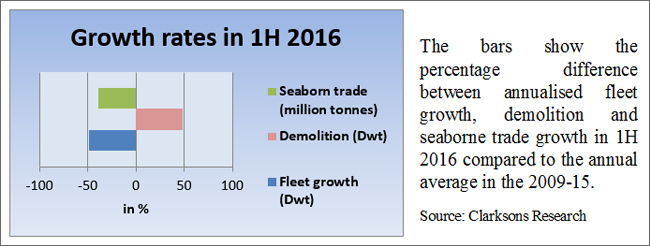
World seaborne trade increased by less than 2% in 2015 - the slowest pace since the financial crisis. In the first half of 2016, the fleet growth has been negative, while demolition increased approx. 50%, in comparison to the annual average for 2009-2015.
Following tables present latest maritime trade indicators
 Source: UNCTADStat
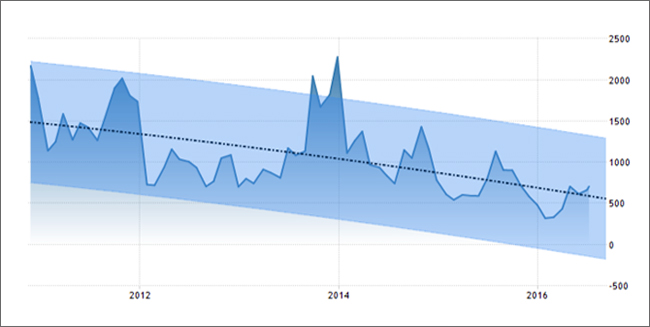
Baltic Exchange Dry Index
The Baltic Dry Index, which measures cost of shipping dry bulk, i.e. mainly raw material used as inputs for the production of intermediate or finished goods, has been falling since mid-2015 and reached its record low in February 2016.
 Source: http://www.tradingeconomics.com/commodity/baltic/forecast
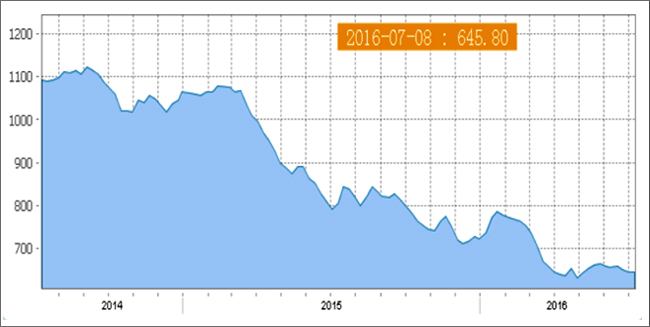
China Containerized Freight Index
The recent slowdown of China’s economy in particular, played a pivotal role in declining world seaborne trade. This trend has translated into a decrease of traffic on the region’s major sea routes and ports. China Containerized Freight Index, based on the price of containers leaving from all major ports in China, witnessed significant drop since the mid-2015, as presented in the table.
Source: Shanghai Shipping Exchange
Trade Indicators - 2015
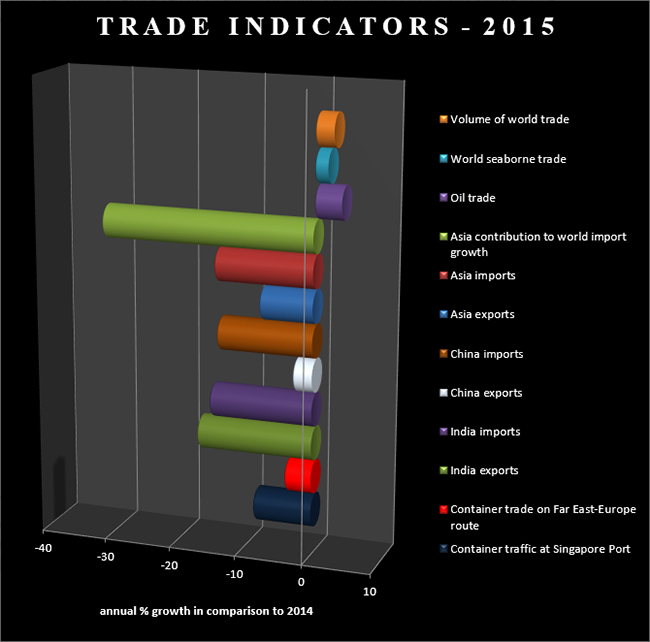 Source: WTO, Clarksons Research, Bloomberg
Mega-regionals – future game-changers or game-breakers?
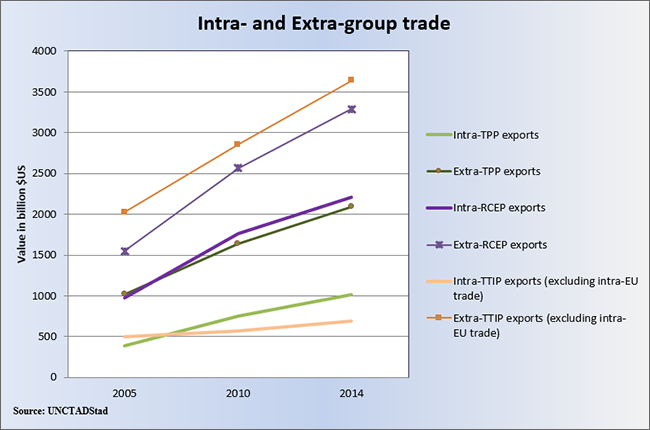
The expanding network of preferential trade agreements, especially the upcoming mega-regional trade deals, appears to be the most relevant potential game-changer for the global economy and the individual countries in the region.
The table presents past export trends of TPP, TTIP and RCEP partners.
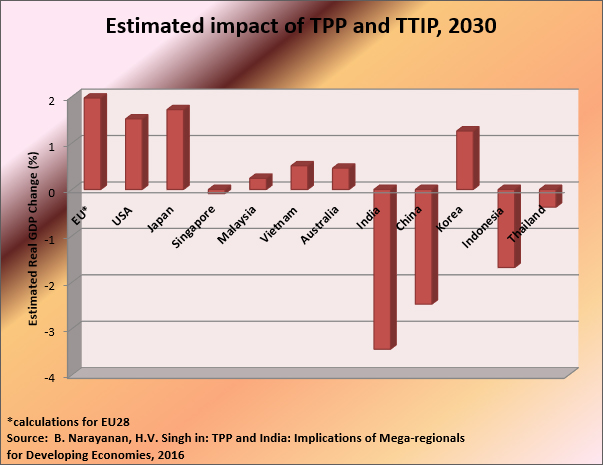
Following chart presents estimated effects of TPP, TTIP, should they come into force, on the selected countries.
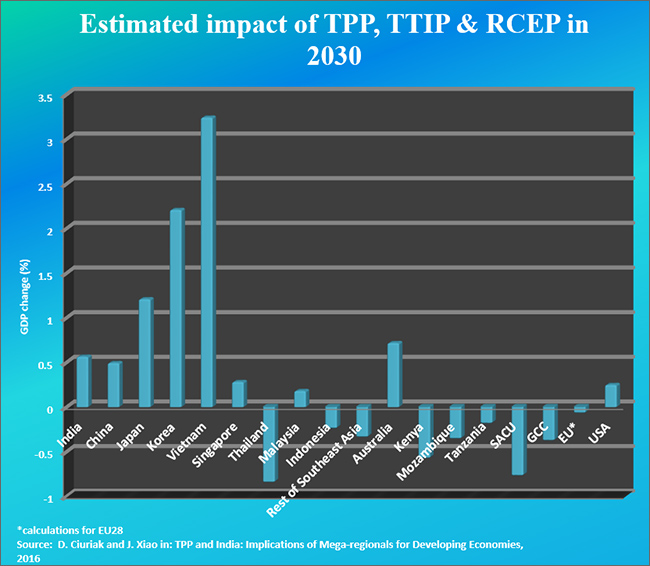
The chart presents estimated combined effects of TPP, TTIP and RCEP, should they come into force, on the selected countries.
Data compiled by Katarzyna Kaszubska
The views expressed above belong to the author(s). ORF research and analyses now available on Telegram! Click here to access our curated content — blogs, longforms and interviews.